
The land and ecosystems of Aotearoa New Zealand are globally unique and nationally significant. Land offers us resources, and supports our livelihoods and economy, property and places, along with our health and quality of life.
For some Māori, connection to land is through whakapapa (ancestral lineage), placing people in a special relationship as a part of ecosystems (Harmsworth, 2022a; Timoti et al, 2017). These connections are emphasised in Māori language (te reo Māori), where the word ‘whenua’ means both ‘land’ and ‘placenta’ – to give nourishment and sustenance (Harmsworth & Awatere, 2013).
Diverse plants and animals are endemic to New Zealand (found nowhere else in the world). Ecosystems, soils and landscapes also have their own intrinsic value, and conserving our natural spaces is important to the majority of New Zealanders (DOC, 2011).
The activities that drive changes in our environment are often based on land. The choices we make today about how we use the land, and our activities on it, are central to whether we see improvements or deterioration not only on the land, but in downstream freshwater and marine environments, and in the air and atmosphere.
Land-use practices for agriculture, forestry and urban development contribute significantly to declines in freshwater quality and biodiversity. Pollution from excess sediment, nutrients, pathogens and contaminants harm our freshwater and marine ecosystems (see section 3: Freshwater and section 4: Marine). Land use and management influence air quality, and are central to mitigating and adapting to climate change (see section 5: Air and section 6: Atmosphere and climate).
Actions on land have both immediate and longer-term consequences. We are also still facing the legacy effects of human deforestation. For example, sedimentation (Sabetian et al, 2021), increased vulnerability to invasion by non-native species (Brownstein & Monks, 2024) and extinction debts (Walker et al, 2023) for places and species where ecosystems are now below a threshold level so they cannot recover.
This section looks at two important issues. The first is about soil and land use: how we use and manage the land and the issues this creates for soil erosion, soil health and contamination, and urban greenspaces and land fragmentation. The second looks at changes in terrestrial habitats and native species, and how they are threatened by habitat loss and invasive species.
For the wider effects, see section 7: Impacts on people, society and the economy.
Updates to livestock numbers and irrigated land indicators
Since the large increase in intensification of land use between the 1980s and mid-2010s, this trend has stabilised, with small shifts since the last indicator updates. Dairy cattle numbers have declined since the peak in 2014. However, the area of irrigated agricultural land increased between 2019 and 2022, implying that more intensive farming has continued to expand.
(See Land use and management has intensified, putting pressure on soil health, water quality, and indigenous biodiversity.)
Waste data new to reporting
Data that are new to the environmental reporting series show the large amount of waste that New Zealanders sent to municipal landfills each year between 2021 and 2023, compared with international reporting. Between 2018 and 2023, the household and municipal waste disposed per person stabilised, after increasing between 2012 and 2018.
(See Waste and contaminants pollute soil and water.)
Updated erosion indicators
Indicator updates confirm previous reporting, showing that 5 percent of New Zealand’s land is classified as highly erodible, and risks of erosion by landslide remain the most common class of erosion risk. Erosion is likely to further increase in combination with predicted higher-intensity rainfalls due to climate change.
(See Erosion varies regionally, placing pressure on downstream freshwater and marine environments.)
Updated extinction threat indicator: indigenous terrestrial birds and reptiles
Indicator updates for indigenous terrestrial birds and reptiles show a high proportion of species remain threatened with extinction, or at risk of becoming threatened.
(See Many indigenous terrestrial species are threatened with or at risk of extinction.)
Updated national assessments of extinction risk for indigenous bats and frogs, and indigenous terrestrial invertebrates and vascular plants
Updated assessments by the Department of Conservation show most of our indigenous bat and frog species, and almost half of our indigenous terrestrial vascular plant species, remain threatened with extinction or at risk of becoming threatened. Updates also show that of the assessed indigenous terrestrial invertebrate species, a significant proportion remain threatened or at risk.
(See Many indigenous terrestrial species are threatened with or at risk of extinction.)
Soil is the foundation of all land-based ecosystems, from tussock grasslands and wetlands to forests and agricultural landscapes. Healthy soils support biodiversity, cycle nutrients, filter contaminants and store carbon (Hewitt et al, 2015; Stevenson, 2022). From a mātauranga Māori (Māori knowledge) perspective, soil has an ancestral lineage that we are a part of (Harmsworth, 2022a).
Our activities on land affect soil condition and terrestrial environments, and have a flow-on impact on all other environmental domains. The following subsections outline these aspects of soil and land use:
- erosion – how soil erosion is affecting different parts of the environment, and how land use and land cover changes can exacerbate this natural process
- land use and management – how these practices affect soil health, and contribute to waste and contamination
- urban densification – how this puts a strain on green spaces, while urban expansion and the fragmentation of highly productive land affect its capacity to grow food. The way we manage urban development not only affects the 84 percent of us living in urban areas (Stats NZ, 2024d), but also has significant consequences for communities across the country.
Erosion affects land, freshwater and coastal environments, and is exacerbated by human activities and climate change.
Erosion varies regionally, placing pressure on downstream freshwater and marine environments.
- New Zealand has naturally high rates of erosion, due to geology and climate. However, these rates have increased due to vegetation clearing for agriculture, and climate change-related events (MfE, 2024i).
- An estimated 182 million tonnes of eroded soil entered New Zealand’s rivers in 2022. This places pressure on receiving environments downstream (see indicator: Estimated long-term soil erosion: Data to 2022, section 3: Freshwater and section 4: Marine).
- In 2022, 5 percent (12,693 square kilometres) of the land was classified as highly erodible. This is land without protective woody vegetation, which is at risk of severe mass-movement erosion. The risk of erosion varies regionally (see indicator: Highly erodible land: Data to 2022 and Technical annex).
- Climate change exacerbates some degradation processes such as landslides, erosion and sedimentation. Soft rock hill country in both the North and South islands is particularly vulnerable. Climate change is predicted to increase erosion rates, though by how much depends on the future climate scenario. Under a low emissions pathway, regional sediment loads are predicted to increase by 1 to 49 percent across the country by 2090, while a higher emissions pathway could see increases of 18 to 233 percent over this period (Neverman et al, 2023; Smith et al, 2023; see section 6: Atmosphere and climate).
- Erosion is a significant concern on Māori land, as over 80 percent of it consists of hilly or mountainous terrain. This makes it highly susceptible to major erosion events such as landslides (Awatere et al, 2021).
Forest management practices can both relieve and put pressure on the environment.
- Tree cover reduces the risk of mass-movement erosion on steep slopes, by protecting soils from wind and rain. Tree roots also stabilise soil (Basher, 2013; Li et al, 2019; Phillips et al, 2023; Rey, 2021). How well this protects against erosion depends on the species, type and age of the forest, and on the root growth encouraged by different soil types and local climate (Phillips et al, 2023).
- For example, in Hawke’s Bay and the Wairarapa hill country after Cyclone Gabrielle, it was estimated that land covered by indigenous forest had a lower probability of landslides than with other land cover types. Land under exotic or indigenous forest is less likely to slide than hill-country pastoral land (McMillan et al, 2023).
- How exotic plantation forests are managed can affect erosion risk, especially on steep slopes. Land can be vulnerable to erosion for several years after harvest, as there is no forest canopy and the roots decay over time, reducing protection from mass-movement erosion (Marden et al, 2023; Phillips et al, 2015; 2024).
- The risk of gully erosion is affected by planting density, and how much of the area around water courses is set aside as a buffer. These buffers are freed from the disturbance of planting and harvesting cycles, and are more likely to be permanently stabilised by native riparian cover (Marden & Seymour, 2022).
- Other issues arising from forest management and harvest can include loss of water-regulating functions, including run-off, and adding to the risks of pest invasion (Jones et al, 2023; Messier et al, 2022; NIWA, nd-b).
- The ways that forests are managed and cleared on steep terrain have generally increased the amount of sediment entering rivers (Larned et al, 2020; Marshall et al, 2023).
The area of exotic forest has expanded, mostly due to the conversion of exotic grassland.
- In 2018, about half (about 12,635,000 hectares) of New Zealand was covered with native ecosystems, and about half (about 13,741,000 hectares) was primarily covered with farms, pasture, plantation (exotic) forests and urban land uses (see indicators: Indigenous land cover, Exotic land cover, Urban land cover).
- Exotic forests covered about 2.1 million hectares in 2018. The area of exotic forest increased by 220,922 hectares (12 percent) between 1996 and 2018 (see indicator: Exotic land cover). This is mostly on hill- and high-country land (MPI, 2022). Of land cover converted to exotic forest between 1996 and 2018, 75 percent was from exotic grassland (see indicator: Exotic land cover).
- Plantation forest currently consists of around 90 percent radiata pine, the remainder being Douglas fir, cypress and eucalyptus (MPI, 2023b). Plantations can also comprise native species such as mānuka, which can be used for honey production (Lambie et al, 2021).
Land use and management can affect the productivity of our land, and contribute to pollution through waste and contaminants
Land use and management have intensified, putting pressure on soil health, water quality and indigenous biodiversity.
- Agricultural land use intensified between the 1990s and mid-2010s. This increased the number of livestock and the yields per hectare, and added more fertilisers and irrigation (Manderson, 2020; Wynyard, 2016; see Environment Aotearoa 2022). Intensification can compromise the health of soils and freshwater (Monaghan et al, 2021; Snelder et al, 2021; see section 3: Freshwater).
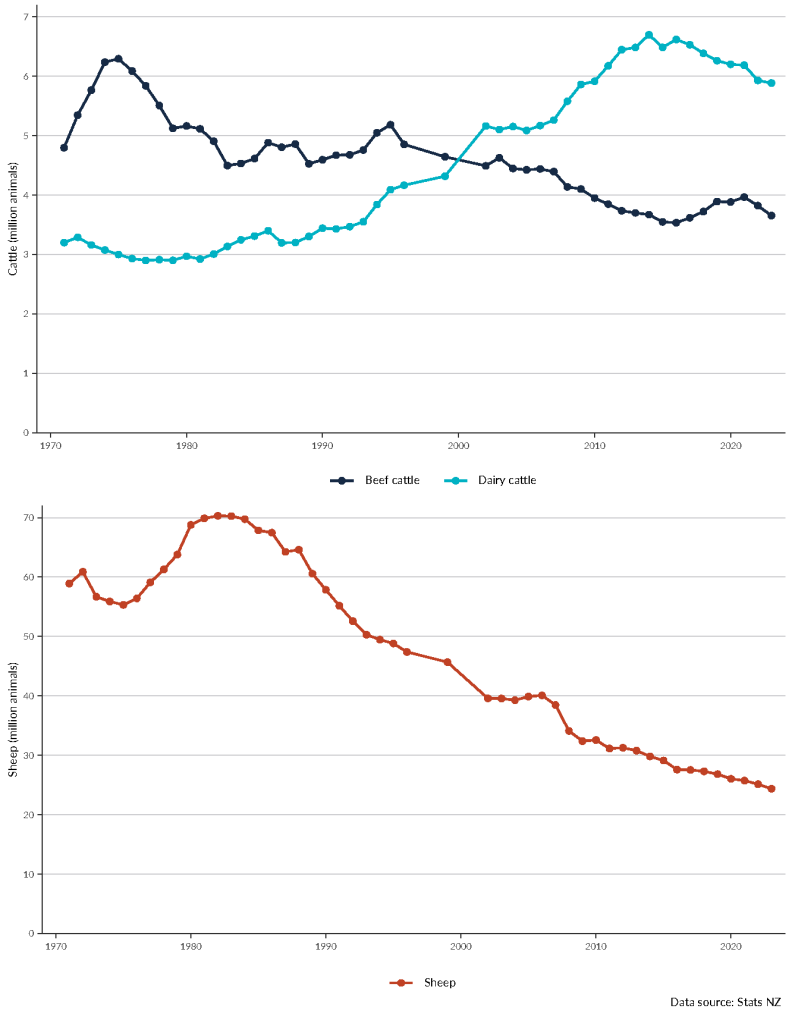
- Much of the intensification is due to a switch from sheep and beef farming to irrigated dairy farming, driven by increasing profitability in the dairy industry (Wynyard, 2016). Dairy cattle numbers nearly doubled from 3.4 million in 1990 to a peak of 6.7 million in 2014. However, the number declined to 5.9 million in 2023 (see indicator: Livestock numbers: Data to 2023 and figure 1).
- The area of irrigated agricultural land nearly doubled between 2002 and 2022, reaching 762,000 hectares, or 5.8 percent of the total farm area. Most of this increase occurred in Canterbury, which had 63 percent of the irrigated land in 2022. More than half of irrigated agricultural land in New Zealand is used for dairy farming (see indicator: Irrigated land: Data to 2022).
- Sales of nitrogen fertiliser consistently increased between 1991 and 2019, from 62,000 to 452,000 tonnes (a 629 percent increase). Sales of phosphorus increased from 94,000 tonnes in 1991 to a peak of 219,000 tonnes in 2005 (a 133 percent increase). They then dropped to 154,000 tonnes in 2019 (a 30 percent decrease from the peak) (see indicator: Fertilisers – nitrogen and phosphorus).
- Despite increases in nitrogen fertiliser and irrigation, gains in pasture eaten on dairy farms have slowed since 2001/02. After increasing 1.48 percent per year between 1990/91 and 2001/02, pasture eaten increased 0.26 percent per year between 2002/03 and 2019/20. This is an early indication that extra fertiliser or irrigation is, on average, yielding a smaller increase in grazeable feed (Chapman et al, 2024).
- Agricultural and horticultural intensification, coupled with changes in land use and land cover, contributes to the loss, fragmentation and degradation of indigenous habitats and the species they support (Clarkson, 2022; DOC, 2020).
Soil quality at monitored agricultural sites is not always within target ranges.
- Soil quality is monitored routinely through seven indicators, with an emphasis on chemical and physical properties across nine land uses. Target ranges are defined for each of the indicators that describe a compromise between optimal crop yield and fewest environmental impacts. Soil quality issues of most concern include compaction (as measured by macroporosity) and elevated phosphorus levels (as measured by Olsen phosphorus) (see indicator: Soil quality and land use and Our land 2021).
- Forty-nine percent of sites were below the target range for macroporosity for 2014 to 2018, indicating that compacted soil limited the flow of oxygen and water (see indicator: Soil quality and land use).
- Sixty-three percent of 450,000 soil samples collected between 2001 and 2015 had Olsen phosphorus levels above the target range. Elevated Olsen phosphorus that washes or leaches into waterways can lower fresh and coastal water quality (McDowell et al, 20201).
1 Olsen phosphorus findings are not being reported from the Soil quality and land use indicator. This is due to the discovery of an error, which overreports the number of sites tested above target ranges
(see indicator: Soil quality and land use)
Waste and contaminants pollute soil and water.
- New Zealand consistently generates among the highest rates of municipal waste per person in the developed world, though there are inconsistencies in how different countries report (OECD, 2024). We sent an average of 688 kilograms of waste per person to municipal landfills each year between 2021 and 2023 (MfE, 2023b). From 2012 through 2018, this average increased 32 percent (570.1 to 755.3 kg per person per year). More recently, it has generally stabilised (with some fluctuation). Landfills received 11 percent less waste per capita in 2023 than the peak in 2018 (MfE, 2023b).
- Much of our waste ends up in landfills. On average, municipal landfills across the country received a total of 3.9 million tonnes of mixed household, commercial and industrial waste each year between 2021 and 2023. Of this material, 9.8 percent was reused, repurposed or recovered (MfE, 2023b).
- Landfills can leak leachate, or liquid containing contaminants. There are controls to contain leachate, but it can still contaminate nearby soil and water, and harm ecosystems and people (MfE, 2004; Siddiqua et al, 2022).
- Chemical contaminants stem from the use of chemicals, including hazardous substances, in industry, agriculture, horticulture and forestry (MfE, 2021a; PCE, 2022). In the 12 months ended 31 June 2023, councils reported that over 45,000 sites had been used for hazardous activities or industries that might cause contamination (MfE, 2024h).
- There is emerging evidence that some New Zealand soils are contaminated with microplastics, although their distribution and effect are uncertain (de Bhowmick et al, 2021; ESR, 2024). Soils receiving applications of biosolids and composts made from municipal waste have a higher risk of contamination (Ruffell et al, 2025). Internationally, it is estimated that soils could currently store more microplastics than surface water in global oceans (Nizzetto et al, 2016; Tremblay et al, 2019; see section 4: Marine).
- Contaminants from land can be carried to freshwater environments and the ocean directly, via stormwater systems, or in untreated or partially treated wastewater (see section 3: Freshwater). Also, some of our waste does not make it to landfill and ends up as litter. Plastic is the most common type of litter found on beaches (see section 4: Marine).
Figure 1: Livestock numbers (beef cattle, dairy cattle, sheep), 1971–2023
Urban densification places pressure on green spaces, and urban expansion encroaches onto highly productive land
Our cities are densifying and expanding, driven by growing populations, and land-use decisions.
- Population growth has contributed to the outward expansion of towns and cities. The total urban area grew by 15 percent between 1996 and 2018 (see indicator: Urban land cover).
- There is a trend towards densification in cities. The decade to 2021 saw a rise in the construction of higher-density dwelling types, including townhouses and apartments, mostly through low-rise infill in existing urban areas (PCE, 2023; Stats NZ, 2024b; see Our land 2024). Meanwhile, towns and cities are also expanding outwards. New subdivisions at the margins are increasingly characterised by larger houses on smaller sections (PCE, 2023).
- Densification helps address the housing supply shortage, can reduce sprawl onto agricultural land and offers opportunities to reduce our transport emissions (PCE, 2023).
Urban development and land fragmentation are decreasing the availability of highly productive land, which can limit options for rural land use.
- Highly productive land is land that is particularly suitable for food production (Curran-Cournane et al, 2021a; see Technical annex). This land type is particularly important for horticulture. It also has cultural and historical value, as Māori gardening and horticulture (māra kai) sites of significance are often on such land near cities (Harmsworth, 2022b).
- About 14 percent (3,830,000 hectares) of the total land area of New Zealand has been classified as highly productive land (NZLRI, 2021; Rutledge et al, 2010).
- Highly productive land is a finite resource. Converting it to housing is effectively irreversible, which means the amount available can only remain stable or decline (Curran-Cournane et al, 2018, 2021b). Conversions reduce how much of this land is available for farming, and could lead to intensification on the remaining land (Curran-Cournane et al, 2021a; Deloitte, 2018).
- In 2002, 69,920 hectares of highly productive land had an urban or residential land use, and so was unavailable for, or restricted from, use as farmland. In 2019, this area had increased to 107,444 hectares (a 54 percent increase) (see indicator: Land fragmentation). This is about 3 percent of New Zealand’s highly productive land (NZLRI, 2021; Rutledge et al, 2010).
- During this same period, the remaining highly productive land became slightly more fragmented. There was a 1.9 percent increase in the area occupied by small-sized parcels (parcels of 2 to 8 hectares) and a 1 percent decrease in the area occupied by parcels over 8 hectares (see indicator: Land fragmentation). Smaller blocks, while still productive, are often shifted out of commercial production over time (Curran-Cournane et al, 2021a; Hart et al, 2013).
The quantity and quality of urban green space is declining.
- Urban green spaces provide important cultural connections for many New Zealanders. Other benefits include reducing stormwater run-off, cleaning the air, lowering ambient temperatures and increasing the diversity of plants and animals that can live in our cities (PCE, 2023).
- Loss of green spaces and their biodiversity can cause a disconnection from our natural heritage, and a loss of cultural identity and sense of place (Blaschke et al, 2024; see section 7: Impacts on people, society and the economy).
- Our cities are currently well-endowed with green space, though some suburbs are greener than others. Green space in some cities covers more than 30 percent of their area (PCE, 2023). However, it is under increasing pressure from densification and expansion that does not include planned green areas.
- In some cities, such as Auckland and Hamilton, parks and green belts are not keeping pace with expansion. Private green space is also declining, and this trend is accelerating (PCE, 2023).
- Densification can degrade our existing urban green spaces. It can result in the removal of trees, and the disturbance and compaction of soils. This in turn can lead to urban heat islands and increase the risk of flooding (PCE, 2024). Increases in population density mean more people can enjoy nearby public parks and reserves, but this can increase pressure on these areas (PCE, 2023).
New Zealand has a high number of endemic species – one of the highest totals worldwide – and many are considered treasured (taonga). Culturally important species, including many threatened terrestrial birds and trees, are vulnerable to diseases like kauri dieback and myrtle rust. Human activities on land, pests, diseases and changes to native ecosystems all combine to threaten iconic species. This subsection explores how these pressures are changing species and habitats.
Many land ecosystems and species are under threat
Many indigenous terrestrial species are threatened with extinction or at risk of becoming threatened.
- Pressures on ecosystems from land-use change, pollution, invasive pest species and climate change have individual and cumulative impacts on indigenous species. New Zealand’s unique biodiversity has a high proportion of threatened or at-risk species – one of the highest amid the global biodiversity crisis (Bradshaw et al, 2010; IPBES, 2018, 2019; see section 3: Freshwater and section 4: Marine).
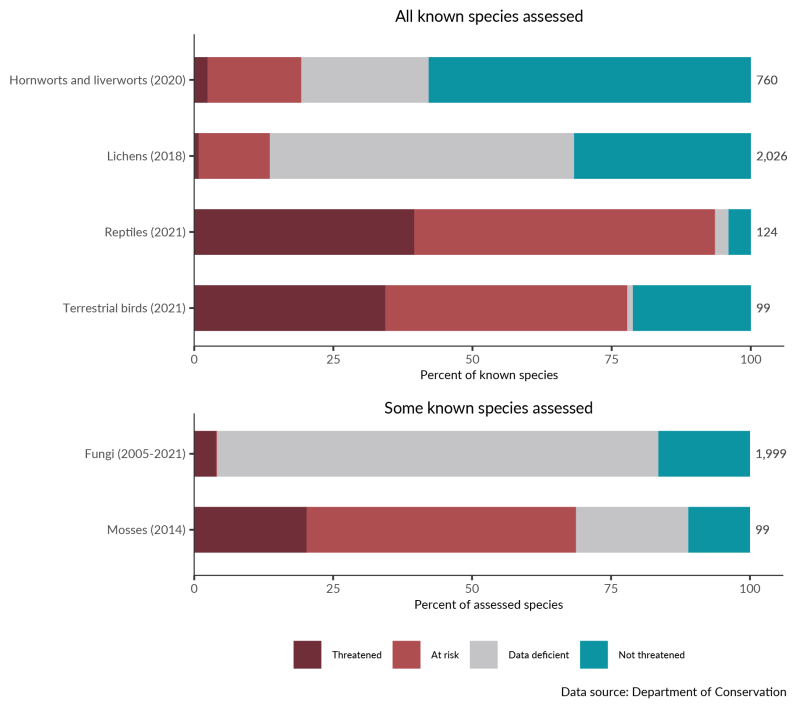
- In 2021, 94 percent (116 of 124) of indigenous reptile species were threatened with extinction or at risk of becoming threatened (figure 2). Estimated population trends show 72 percent of species have decreasing populations and 5 percent have increasing populations (see indicator: Extinction threat to indigenous species).
- In 2021, 78 percent (77 of 99) of indigenous terrestrial bird species were threatened with extinction or at risk of becoming threatened (figure 2). Estimated population trends show 22 percent of species have decreasing populations and 21 percent have increasing populations (see indicator: Extinction threat to indigenous species and Technical annex).
- In 2023, 48 percent (1,260 of 2,621) of indigenous terrestrial vascular plant species were threatened with extinction or at risk of becoming threatened. Estimated population trends show 18 percent of species have decreasing populations and 1.4 percent increasing (de Lange et al, 2024).
- In 2022, 80 percent (4 of 5) of indigenous bat species were threatened with extinction or at risk of becoming threatened. Estimated population trends show three species have decreasing populations and one species increasing (O’Donnell et al, 2023).
- In 2024, 93 percent (13 of 14) of indigenous frog species were threatened with extinction or at risk of becoming threatened. Estimated population trends show 12 species have decreasing populations and one stable (Burns et al, 2025).
- In 2022, 36 percent (1,433 of 3,961) of assessed terrestrial invertebrate species were threatened with extinction or at risk of becoming threatened. Estimated population trends show 0.4 percent of assessed species have decreasing populations, 1 percent stable or increasing, and 26 percent stable; the remaining population trends are unavailable2 (Andrew et al, 2012; Barker et al, 2021; Buckley et al, 2012; Buckley et al, 2015; Buckley et al, 2016; Heath et al, 2015; Heath et al, 2022; Hoare et al, 2017; Leschen et al, 2012; Mahlfeld et al, 2012; Sirvid et al, 2021; Stringer et al, 2012a; Stringer et al, 2012b; Trewick et al, 2018; Trewick et al, 2022; Walker et al, 2021; Walker et al, 2024a; Ward et al, 2017; Yeates et al, 2012; see Technical annex).
- The decline in the health and area of ecosystems and their biodiversity reduces the environment’s ability to recover from disturbances, such as those caused by extreme weather events, long-term environmental changes and climate change (Dasgupta, 2021; Key et al, 2022).
2 Note that only some known species of terrestrial invertebrates have been assessed for extinction threat status and estimated population trends.
Figure 2: Extinction threat to indigenous terrestrial species3
3 Note that extinction threat information updated since the Extinction threat to indigenous species indicator update in 2023 has been included in the text and is based on New Zealand Threat Classification System data downloads, as well as older information from the terrestrial invertebrates species group (see Technical annex; NZTCS, 2025). Figure is based only on information available in the indicator (see indicator: Extinction threat to indigenous species).
Remaining indigenous forest, scrub and tussock provide important habitat for indigenous species, but continue to be lost to other land uses.
- Native land cover includes forests, tussock grasslands and shrublands. Land covered with original or regenerating native vegetation ranges from vast areas of conservation land (mainly in higher, more remote areas) to small, isolated stands of regenerating bush on farms and in cities.
- Before the arrival of humans, native forest covered more than 80 percent of the land (see indicator: Predicted pre-human vegetation). It now covers less than 30 percent. The area covered with native ecosystems, including forests, decreased by about 88,000 hectares between 1996 and 2018, mainly through conversion to pasture and exotic plantation forestry (see indicator: Indigenous land cover).
- Lowland native forests are important habitats for a high proportion of threatened native plant species (Walker et al, 2008). Some animals also persist in the remnant native forest in pastoral systems, such as the brown kiwi in the North Island. However, species that need large, connected forest, such as the kōkako, are generally not present in these modified landscapes (Norton et al, 2020).
- Native forest remnants in farmland are vulnerable to exotic plant invasion via creeping edge effects. These effects are increased by spillover of nitrogen and irrigation from agricultural intensification (Brownstein & Monks, 2024). Wetland remnants are also affected by adjacent land use (see section 3: Freshwater).
- Exotic plantation forests can have positive effects on some native species compared with bare or pastoral land, particularly where native habitat is fragmented. It can protect and connect native ecosystem remnants and provide habitat where no alternative exists (Brockerhoff et al, 2017; Pawson et al, 2010). Threatened and at-risk species found in plantation forests include bats, insect-eating birds such as riroriro (grey warbler), pīwakawaka (New Zealand fantail), and kiwi, and a wide variety of invertebrates found in leaf litter layers, soil and wood (Borkin et al, 2011; Marshall et al, 2023; MWLR, 2018; Pawson et al, 2010).
Pests and weeds threaten biodiversity and put vulnerable ecosystems at risk.
- Weeds (plant pests) are introduced exotic plants that are growing in the wild and damaging native ecosystems. Weeds and other pests can reduce biodiversity by outcompeting other species. They can alter habitats, damage ecosystem functions and even increase fire risk (Brandt et al, 2020; Clarkson, 2022; PCE, 2021).
- For some Māori, pests and weeds can disrupt the balance that Papatūānuku (Earth mother) needs to be well, creating a system that no longer provides for life (PCE, 2021).
- There are over 1,800 exotic plant species that can maintain populations in the wild without human assistance (McAlpine & Howell, 2024; PCE, 2021). The number of wild (naturalised) pest plant species is continuing to grow as there are few barriers to naturalisation (Brandt et al, 2020). The North and South islands each have more of these plants than almost any other island in the world, with exotic species making up 44 percent of our vascular plant life (PCE, 2021).
- Weeds pose a threat to endangered ecosystems (Rapson et al, 2023) and are the main hazard to one-third of nationally threatened native plant species (Hulme, 2020; PCE, 2021).
- Wilding conifers are plant pests that spread from plantation forests through natural regeneration or seeding. They are a serious threat to the ecology and biodiversity of many native ecosystems (Edwards et al, 2020; Etherington, 2022; Froude, 2011; MPI, 2023c; Peltzer, 2018). They particularly affect tussock grasslands, rare ecosystems and subalpine habitats, which are all important for supporting biodiversity (MPI, 2014; Peltzer, 2018)
- Around 2 million hectares across the country are thought to be invaded by wilding conifers (Peltzer, 2018), and the area is expanding by around 90,000 hectares a year (MPI, 2023c). Without management, wilding conifers will form dense forests and could invade about 25 percent of land in New Zealand in 30 years (MPI, 2023c).
- Mammalian pests threaten many native birds, reptiles, invertebrates and plants (DOC, 2020). Between 2013 and 2019, possums were the more common pest in woody areas, while for hooved animals (such as deer and goats), mean occupancy (distribution) was around 70 percent in non-woody areas and 85 percent in woody areas (see indicator: Land pests). Possums and hooved animals have a particularly high impact on growth of some native tree species, as native forests have historically lacked herbivorous mammals (Hawcroft et al, 2024). Pest populations in woody areas are harder to harvest or control (Moloney et al, 2021).
- Introduced pathogens (disease-causing microorganisms) threaten native plants and commercial crops. They include kauri dieback disease, myrtle rust and the kiwifruit vine disease, PSA (Pseudomonas syringae actinidiae). Pathogens affect species that are culturally important for many Māori (Clarkson, 2022; Diprose et al, 2022; Royal Society Te Apārangi, 2014).

2. Land
April 2025
© Ministry for the Environment