Introduction

Aotearoa New Zealand’s freshwater environment supports all aspects of our lives, and we share an intimate connection with it. It is central to our quality of life, supporting the economy, recreation and food-gathering. For many Māori, the freshwater environment is central to customs and protocols (tikanga), knowledge (mātauranga) and traditional food-gathering practices (mahinga kai). 

Despite this, freshwater is under pressure from activities on the land and in the water, and from a changing climate. Although some freshwater bodies are in a reasonably healthy state, many have been degraded by the effects of these pressures on water quality and freshwater habitats. Further, most indigenous freshwater fish and freshwater bird species, including some iconic treasured (taonga) species, are either threatened with extinction or at risk of becoming threatened.  

Rivers and groundwater act as pathways transporting nutrients, sediments and contaminants from the land to the marine environment. Changes in the quality of freshwater can also affect estuaries and coastal waters (see section 4: Marine).  

This section looks at two key issues. 

First, it reports on the state of freshwater quality in our groundwater, rivers and lakes. It also summarises the pressures, including agriculture, wastewater and stormwater, which are responsible for the degraded state of many waterways.  

It then presents evidence on how freshwater quality, land conversion, changes to flows and water courses, pests and climate change are all affecting the state of freshwater habitats and native species

For the wider effects of the state of freshwater, see section 7: Impacts on people, society and the economy

New and updated freshwater indicators and evidence since Environment Aotearoa 2022

Updated national groundwater quality assessment 

New Escherichia coli (E. coli) monitoring data show that contamination by faecal pathogens remains the most widespread water quality issue affecting groundwaters. Evidence not previously available from water suppliers shows that E. coli levels have failed to meet drinking water standards in some samples from aquifers that supply public drinking water.  

An assessment of new nitrate-nitrogen monitoring data has strengthened previous assessments of the scale of nitrate impact in groundwaters. It indicates that a significant proportion of groundwaters have accumulated excess nitrate due to human activities, which can compromise drinking water quality and degrade surface water ecosystems. Groundwaters in most parts of the country continue to comply with drinking water standards, but some aquifers are still not safe for supplying drinking water that has not been treated for nitrate.  

New monitoring data for pesticides and per- and polyfluoroalkyl substances (PFAS) indicate that they are not widespread in groundwaters, and rarely occur above drinking water standards. 

(See Freshwater quality is mixed. In some water bodies, contaminant levels pose a risk to people and freshwater species, habitats and ecosystems.) 

New data and modelled findings for national lake health 

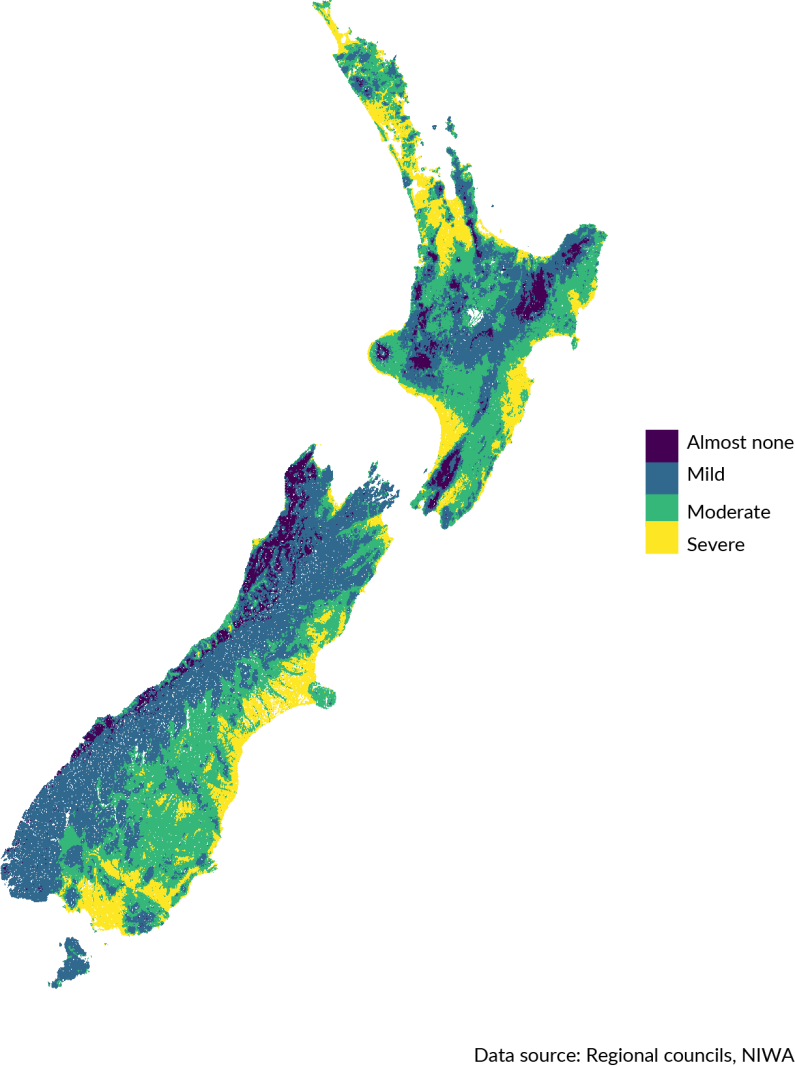
A new model for lake water quality affirms previous assessments that almost half of the country’s lakes are in poor health due to excess nutrients. However, unlike the previous model, it predicts that most of the remaining lakes are in good health, rather than average. This is due to the new model’s improved accuracy for lesser-impacted lakes, and does not reflect a measured change in the state of lake environments between assessment periods. 

(See Some river and lake ecosystems are showing signs of degradation from excess nutrient levels.) 

Updated extinction threat indicator: indigenous freshwater-dependent birds 

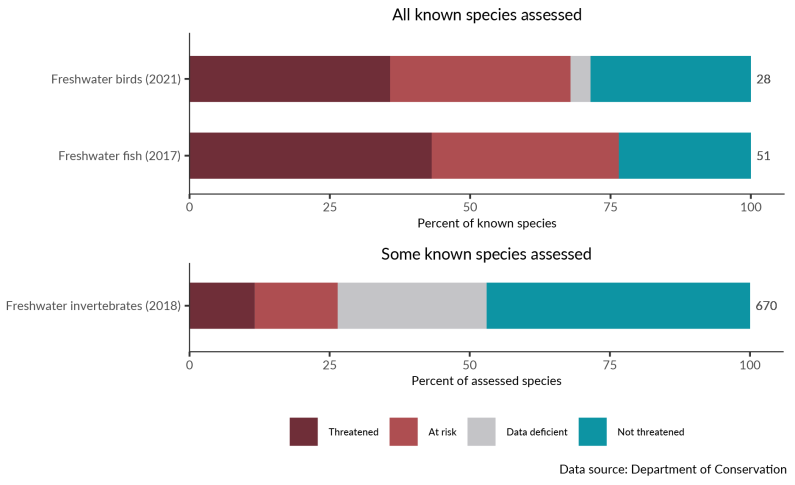
The indicator update for indigenous freshwater-dependent birds shows most species remain threatened with extinction, or at risk of becoming threatened. 

(See Many indigenous freshwater species are threatened with extinction or at risk of becoming threatened.

Updated national assessment of extinction risk for indigenous freshwater plants 

An updated assessment by the Department of Conservation shows a significant proportion of our indigenous freshwater plant species remain threatened with extinction, or at risk of becoming threatened. 

(See Many indigenous freshwater species are threatened with extinction or at risk of becoming threatened..) 

Freshwater quality

The quality of our freshwater is affected by different human activities. This impacts the health of ecosystems, and our ability to safely connect with the freshwater environment. This subsection looks at the state of groundwater, lakes and rivers, and what it means for drinking and swimming. It also examines the pressures that can degrade them.  

Freshwater quality is widely monitored across groundwater, lakes and rivers, and models are used to predict water quality in unmonitored rivers and lakes. Cultural indicators, such as for traditional food-gathering practices (mahinga kai), can show the overall health of freshwater ecosystems. This subsection uses a selection of these measures to assess the extent of freshwater pollution in New Zealand, focusing on faecal pathogens and nutrients. Elevated nitrogen and faecal contamination can make waters unsafe for drinking, and faecal contamination can make them unsafe for recreation. Excess nutrients can degrade freshwater habitats and ecosystems, and harm freshwater species.  

Freshwater quality is mixed. In some water bodies, contaminant levels pose a risk to people and freshwater habitats, species and ecosystems 

Some of our groundwater is unsafe for drinking. 

  • E. coli is monitored as an indicator of the presence of pathogens associated with animal or human faeces, especially Campylobacter. Consuming faecal pathogens in drinking water can make people ill (see section 7: Impacts on people, society and the economy). 
  • Forty-six percent of 1,007 groundwater monitoring sites failed to meet the New Zealand drinking water standard for E. coli on at least one occasion between 2019 and 2024. This indicates a risk to people if they consume water from these aquifers that has not been adequately treated (Moreau et al, 2025).4 
  • Some of our groundwater drinking water sources have been contaminated with bacteria, including deep aquifers (deeper than 30 metres) and springs. Of the 11,026 (pre-treated) samples from water supply bores that were tested for E. coli and reported to Taumata Arowai in 2023, 6 percent failed to meet the drinking water standard. Thirty-three percent of the 326 samples from springs also failed (Taumata Arowai, 2024). 
  • Twelve percent of 1,173 groundwater monitoring sites failed to meet the New Zealand drinking water standard for nitrate-nitrogen on at least one occasion between 2019 and 2024 (Moreau et al, 2025). Groundwater with concentrations above this standard must be treated for nitrate before it is safe to drink (PMCSA, 2023). 
  • For the 184 wells sampled in the 2022 national groundwater survey for pesticides, detected concentrations of one compound exceeded New Zealand drinking water standards in six wells. Detected concentrations of two compounds exceeded the standards in two wells, and detected concentrations of three compounds exceeded them in one well (Close & Banasiak, 2023a; Moreau et al, 2025). 
  • Drinking water standards for other non-natural chemicals were not exceeded in any of the wells sampled in the last national groundwater survey in 2018, or in the first national groundwater survey for per- and polyfluoroalkyl substances (PFAS) in 2022 (Close et al, 2021; Close & Banasiak, 2023b). 

4 Moreau et al (2025) update the information in the current version of the Stats NZ Groundwater quality indicator, published in April 2020. The data from Moreau et al will be incorporated into the next indicator update, but the statistics published in the updated web page may differ due to methodological (or other) differences (see Technical annex).

Some rivers and lakes are unsuitable for swimming and recreation. 

  • Exposure to faecal pathogens through recreational activities such as swimming, paddling and water sports can make people ill (see section 7: Impacts on people, society and the economy). Rivers and lakes can be assessed for their suitability for these activities by using measured E. coli concentrations to calculate the risk of infection from Campylobacter bacteria (see Technical annex).  
  • Models estimate that 45 percent of the country’s total river length was not suitable for activities such as swimming between 2016 and 2020, based on having an average Campylobacter infection risk greater than 3 percent (corresponding to National Objectives Framework (NOF) bands D and E for E. coli) (see indicator: River water quality: Escherichia coli; MfE, 2024f). 
  • For E. coli, trends at 41 percent of river monitoring sites were worsening and 37 percent were improving between 2001 and 2020 (see indicator: River water quality: Escherichia coli). 
  • For the period 2017–22, 9 of 92 monitored lake sites had an average Campylobacter infection risk of more than 3 percent, making them unsuitable for activities such as swimming (Kuczynski et al, 2024; MfE, 2024f). For the 15 sites where trends could be assessed for E. coli, 33 percent were worsening and 20 percent were improving between 2012 and 2022 (Kuczynski et al, 2024; MfE, 2024f).  

The quality of our waterways can make them less suitable for food-gathering (mahinga kai) and treasured (taonga) species, which are important cultural indicators of the health of freshwater ecosystems. 

  • Mahinga kai is a cultural indicator of a healthy freshwater system (Hikuroa et al, 2018; Tipa, 2009). Sustaining and accessing mahinga kai is closely linked to the state of freshwater, and is important for Māori in understanding the health of an ecosystem (Rainforth & Harmsworth, 2019; Tipa, 2009). 
  • A survey of five mahinga kai sites in coastal North Canterbury between 2019 and 2021 detected E. coli on sampled watercress, and in cockles, at concentrations that exceeded health guidelines for human consumption. Concentrations were significantly higher than in the surrounding water (van Hamelsveld et al, 2023). 
  • An assessment of the Wairoa and Waiau rivers using mātauranga observations from 2021 to 2023 observed a decline in the health of mahinga kai species: 9 percent of the harvest was unsafe to eat, and 7 percent of the targeted catch was not safe to harvest due to visible injury or sickness. The assessment also observed an accelerating decline in the availability of mahinga kai species that were traditionally or historically available (Galvan et al, 2024). 

Some river and lake ecosystems are showing signs of degradation from excess nutrient levels. 

  • Nutrients, such as nitrogen and phosphorus, occur naturally in the freshwater environment. However, elevated levels can drive eutrophication – an overload of nutrients that can cause algal blooms, depleted oxygen levels and a range of harmful effects on freshwater ecosystems (Snelder et al, 2020; see Our freshwater 2023). Freshwater can carry nutrients from land into the marine environment, where they can also cause harm (see section 4: Marine). 
  • This subsection assesses the flow-on effects of nutrients on freshwater ecosystems using water quality indices that provide a high-level understanding of ecosystem health: macroinvertebrate community index (MCI) for rivers and trophic level index (TLI) for lakes (see Our freshwater 2023 and Technical annex). For more about nutrients in water, see indicators: River water quality: nitrogen, River water quality: phosphorus, Lake water quality and Coastal and estuarine water quality
  • Between 2016 and 2020, 55 percent of New Zealand’s river length had modelled MCI scores that indicate conditions with moderate or severe organic pollution or nutrient enrichment, and 45 percent had scores that indicate no or mild impairment (see indicator: River water quality: macroinvertebrate community index; figure 3). 
  • For MCI, trends at 56 percent of river monitoring sites were worsening and 25 percent were improving between 2001 and 2020 (see indicator: River water quality: macroinvertebrate community index). 
  • Forty-six percent of lakes larger than 1 hectare had modelled TLI scores indicating poor or very poor health in terms of nutrient enrichment between 2016 and 2020 (see indicator: Lake water quality). A new TLI model that better represents less-affected lakes predicts that 34 percent of lakes larger than 1 hectare are in good or very good health, based on data from 2018 to 2021 (Wood et al, 2023; see Technical annex). 
  • For TLI, trends at 45 percent of lake monitoring sites were worsening and 36 percent were improving between 2011 and 2020 (see indicator: Lake water quality). 
  • For the period 2019–24, groundwater nitrate-nitrogen concentrations were monitored at 1,173 sites. Forty-one percent of sites indicated groundwater in these locations is likely to have accumulated excess nitrate due to human activities. For the 417 sites where trends could be assessed for nitrate-nitrogen, concentrations were increasing at 47 percent of them, and decreasing at 43 percent between 2004 and 2024 (Moreau et al, 2025; see Technical annex).  
  • The concentration of nitrate that is harmful to groundwater species is unknown (Fenwick et al, 2018), but nitrate-rich groundwaters can contribute to ecosystem degradation in the surface water bodies that they flow into (see Our freshwater 2023). 

Figure 3: Modelled median macroinvertebrate community index scores indicating organic pollution and nutrient enrichment in rivers, 2016–20 

Map of New Zealand showing nutrient enrichment levels in rivers in four categories: almost none, mild, moderate and severe.
Note: Nutrient enrichment levels from ‘Almost none’ to ‘Severe’ correspond to National Objective Framework bands A to D (see indicator: River water quality: macroinvertebrate community index; MfE, 2024f).

Land use and human activities are major pressures on freshwater quality 

Land-based human activities contribute to excess nutrients, sediment and pathogens in fresh waterways. 

  • Human activities on land, such as agriculture, forest harvesting and urban expansion, can increase erosion rates and the levels of pathogens, nutrients and sediment in freshwater and marine systems (see Our freshwater 2023 and section 4: Marine). In some parts of New Zealand, increased rainfall and flooding are expected to further increase the amount of eroded sediment reaching downstream environments (see section 2: Land).  
  • When pathogens, excess sediment and surplus nutrients wash or drain into freshwater environments, they can cause ecological and socio-economic harm. Pathogens such as Campylobacter, Cryptosporidium, E. coli and Giardia can make waters unsafe for drinking and recreation (Basher et al, 2011; Devane et al, 2018; Donovan, 2022; Larned et al, 2020; Leonard & Eaton; 2021; see section 7: Impacts on people, society and the economy). 

Intensification and other land-use changes have increased pressures on water quality. 

  • Intensification involves increasing the use of inputs such as fertiliser and irrigation, and draining soils, to increase production. This includes converting land used for less intensive activities such as sheep farming, to more intensive uses such as dairy farming or horticulture (Burge et al, 2023). Agriculture has been intensifying in New Zealand since the 1980s, but the rate has slowed since the mid-2010s (see section 2: Land). 
  • Analyses of national river water quality monitoring data for 2016–20 show that water quality is more degraded when there is more high-intensity pasture and horticultural land upstream (Whitehead et al, 2022). Models indicate that measured long-term changes in water quality leading up to this period were closely associated with agricultural intensification and, to a lesser extent, better farm management (Monaghan et al, 2021; Snelder et al, 2021; see Our freshwater 2023). 

Stormwater, wastewater and other waste discharges are also pressures on freshwater quality 

Wastewater and stormwater are sources of freshwater contaminants, such as pathogens and heavy metals. 

  • Sewage and other wastewater from houses, businesses and industrial processes often contains high levels of pathogens and other contaminants. These are significantly reduced by wastewater treatment, but treated discharges can still carry contaminants into the freshwater environment (Ruffell et al, 2021; see Our freshwater 2020). 
  • Some wastewater bypasses treatment entirely. In the 2022 national performance review by Water New Zealand, participating wastewater service suppliers reported that between 2021 and 2022 there were 3,121 reported overflows of untreated wastewater due to wet-weather events, or due to blockages and mechanical failures during dry weather. However, it is likely that this number is under-reported (Water NZ, 2024). 
  • Stormwater can also carry pollutants from land into freshwater. These pollutants include hydrocarbons and heavy metals from vehicles and industrial yards, and pathogens from animal faeces, wastewater leaks and overflows (see Our freshwater 2023). 
  • River water quality monitoring data for Auckland, Canterbury, Otago and Wellington for 2017–22 indicates that concentrations of the heavy metals copper and zinc were highest at sites with greater proportions of urban land cover in their upstream catchments (see indicator: River water quality – heavy metals: Data to 2022). 

Plastics and chemicals that have been produced and used for decades end up in freshwater. 

  • Plastic waste is a major problem affecting land, freshwater and the marine environments (see section 2: Land and section 4: Marine). Some plastics take centuries to break down, and large quantities are still being produced (PMCSA, 2019). 
  • In 2021 and 2022, most of the items (68 percent) counted in New Zealand freshwater environments in Litter Intelligence surveys were plastic (Litter Intelligence, nd). 
  • Microplastics are generally defined as plastic particles less than 5 millimetres in diameter (De Bhowmick et al, 2021). They have been found in urban streams and are often transported via smaller urban streams. A survey across 52 urban streams found microplastics in samples from all sites (Mora-Teddy & Matthaei, 2020). 
  • Pesticides can stay in the environment for long periods and can enter waterways. They have been used in New Zealand for many decades over large areas of land (Chapman, 2010; Manktelow et al, 2005; Rolando et al, 2016). 
  • In the 2022 national groundwater survey for pesticides and per- and polyfluoroalkyl substances (PFAS), one or more pesticides were detected in 17 of the 184 wells sampled (9 percent). Pesticides were detected in a smaller proportion of wells, and generally at lower concentrations, than in the last survey in 2018 (Close & Banasiak, 2023a). 
  • PFAS were included in the national groundwater survey for the first time in in 2022. Of the 131 wells surveyed for PFAS, one or more were detected in 15 wells (11 percent) (Close & Banasiak, 2023b). 
  • Other non-natural chemical contaminants coming from the manufacture and use of products such as plastics and personal care products have been detected in groundwaters across the country, but mostly at low levels (Close et al, 2021). 

Freshwater habitats and native species

New Zealand has many unique native species that depend on freshwater. When freshwater quality declines, these species and their ecosystems become threatened. This subsection looks at how pressures such as invasive species, sediment and contaminants, along with changes to water flows from irrigation and hydropower, are affecting habitats and placing some species at risk of extinction.

The effects of climate change are intensifying many of these pressures. This is discussed in section 6: Atmosphere and climate.

Human activities and exotic species have led to the loss and degradation of habitats, placing significant pressure on native species 

Much of our historical wetland has been converted to other uses, and the loss and degradation of these places (considered sacred or wāhi tapu by Māori) have continued. This has reduced habitat for dependent native species and diminished many environmental benefits.  

  • New Zealand has lost an estimated 90 percent of historical wetland (repo) area, but the small fraction that remains is vital for the survival of many threatened plant and animal species, including several treasured (taonga) bird species (Clarkson et al, 2013; Dymond et al, 2021; see Our freshwater 2023).  
  • Wetlands continue to be lost. Freshwater wetland area decreased by 1,498 hectares (0.6 percent), and saline repo area by 69 hectares (0.1 percent), between 2012 and 2018 (see indicator: Wetland area). 
  • Wetlands continue to be degraded by drainage and disturbance from adjacent land use, particularly roading and grazing (Burge et al, 2023, 2025). 
  • Wetlands provide many benefits, such as storing carbon, regulating water flow during storms, and purifying water by filtering out nutrients and sediments (Clarkson et al, 2013; Schallenberg et al, 2013). The extent and condition of these ecosystems affect these important processes. 

Freshwater ecosystems can be widely affected by introduced species, some of which degrade freshwater habitats and threaten native species. 

  • Historically, over 200 species of freshwater animals and plants have been introduced to New Zealand, mostly deliberately. Illegal and accidental introductions still occur (NIWA, 2020), such as the gold clam (Corbicula fluminea), which was discovered in the Waikato River in 2023 and has established a breeding population there (DOC, nd-a; MPI, 2023d). 
  • Many introduced freshwater species, such as trout, koi carp, hornwort and didymo, place pressures on our unique native species and ecosystems. Their spread can destabilise aquatic environments and threaten indigenous biodiversity (Baker et al, 2003; DOC, nd-b; MPI, nd-b; NIWA, 2020; Otago Regional Council, 2024; see Our freshwater 2023). 

Contaminants from human activities on land can affect freshwater habitats and species. 

  • Poor water quality, low oxygen levels and warm temperatures can allow toxic concentrations of Clostridium botulinum bacteria to build up in freshwater bodies. This has led to botulism outbreaks that have killed hundreds of freshwater fish and birds, including native and threatened species (BirdCare Aotearoa, 2022; Kāpiti Coast District Council, 2024; MPI, 2023e; Waikato Regional Council, 2023). 
  • Heavy metals in high concentrations can be toxic to aquatic life. They can accumulate in sediments and living organisms (Boehler et al, 2017). 
  • Kākahi habitat decline has been attributed to river regulation, nutrient enrichment and other types of pollution (Phillips, 2007). 
  • Microplastics have been found to accumulate in freshwater organisms. These can cause impacts depending on their physical shape and size, age, density and chemical make-up (Ockenden et al, 2021, 2022; Zimmermann et al, 2020). 

Excess sediment in waterways can degrade habitats and lead to a decline in native freshwater species 

  • Soil washed from the land can degrade freshwater both when it is suspended in the water and when it settles as sediment on a streambed (see indicators: Estimated long-term soil erosion: Data to 2022 and Deposited sediment in rivers; and Our freshwater 2020). 
  • Excess suspended sediment makes the water cloudy, blocking light and reducing the native freshwater plants that provide habitat for native species (NIWA, 2019b; Rowe, 2007; Schallenberg et al, 2013). It is directly harmful to freshwater fish, making it more difficult for them to breathe, feed and migrate (Collier et al, 2017).  
  • Excess deposited sediment smothers natural habitats on the bottom and banks of rivers and lakes – it fills in the spaces between rock and gravel that small fish and invertebrates use to hide and breed. It can also make their food harder to find (Burdon et al, 2013; Clapcott et al, 2011). 

The condition of river and lake habitats is generally moderate to good, but some are degraded by contaminants from land, and invasive plants. 

  • Visual clarity is a measure of underwater visibility in rivers and streams. It indicates how much sediment is suspended in the water. Poorer clarity means there is more sediment, and more risk of harm to species. Clarity is an important indicator of ecosystem health, and of cultural stream health, which includes measures that incorporate Māori values (Galvan et al, 2024; MfE, 2006). 
  • Seventy-seven percent of the country’s river length had modelled visual clarity values that indicated a minimal to moderate impact of suspended sediment on aquatic life (NOF bands A and B) between 2016 and 2020. Twenty-three percent of river length indicated a moderate to high impact (NOF bands C and D) (see indicator: River water quality: clarity and turbidity and Technical annex). 
  • The overall condition of river and stream habitat can be assessed based on 10 measured parameters including flow and habitat diversity, streambed sedimentation, bank erosion, bank vegetation and shade (Clapcott et al, 2019). Flow and habitat diversity, streambed sedimentation and bank vegetation are also some of the indicators used by some Māori to holistically assess the cultural health of rivers and streams (Galvan et al, 2024; MfE, 2006). 
  • Of the 459 river and stream monitoring sites assessed for habitat condition across seven regions between 2013/14 and 2018/19, 79 percent were good or excellent and 21 percent were fair (see indicator: Freshwater physical habitat).  
  • The submerged plant index is a measure of a lake’s ecological health. It reflects the diversity and extent of native and invasive plant species that provide habitats and support ecosystem processes. Between 1991 and 2019, 36 percent of 295 monitored lakes were in poor ecological condition based on their plant communities or were entirely without submerged plants, and 34 percent were in excellent or high ecological condition. Eighty-eight percent of lakes with vegetation had some non-indigenous plant species present (see indicator: Lake submerged plant index). 

Human changes to flows and water courses put pressure on freshwater habitats and native species 

Structures for diverting or controlling water have altered and fragmented river habitats, placing pressure on fish and kōura migrations.  

  • Structures that divert or control water such as dams, weirs, culverts, fords, stop banks and floodgates alter river channels and flows, and the connections between waterways. These changes can reduce populations or prevent the migration and spawning of some species, affecting the range of species that rivers can support (Brierly et al, 2022; Franklin et al, 2018; Graynoth et al, 2008; Harding et al, 2009; see Our freshwater 2023). 
  • These changes can affect the cultural health of rivers and streams. Barriers and changes to flows place pressure on the migration of mahinga kai species such as whitebait (īnanga), eels (tuna) and freshwater crayfish (kōura) (McDowall, 2000). The re-routing of flows in the Tarawera River has greatly reduced environmental and cultural wellbeing (Hikuroa et al, 2018). 
  • A national assessment of river barriers estimates that a minimum of 48 percent of the river network is at least partially inaccessible to migratory fish, though a further 36 percent has not yet been assessed for barriers and could be inaccessible (Franklin et al, 2022). 
  • Confining waterways to well-defined channels sometimes concentrates flows, which can increase the erosion of riverbanks and the amount of sediment deposited downstream (Fuller et al, 2011; Maddock, 1999; see Our freshwater 2020). 

Using water for hydropower and irrigation can change the timing and volume of freshwater flows. 

  • Using and storing water for human activities can affect the natural variability of a river’s flow – the volume of water, how fast it flows, how the flows vary seasonally and in response to precipitation, and the connections between waterways. Diverted or altered flows in one area can affect or alter the flows in connected water bodies, and the health of freshwater ecosystems (see Our freshwater 2020). 
  • About 440 billion cubic metres of freshwater flows in our rivers and streams every year (Collins et al, 2015). In the year ended June 2020, about 752 billion cubic metres were held in aquifers as groundwater (Stats NZ, 2021b). 
  • For the 2017/18 water reporting year, 13 billion cubic metres of surface water and groundwater was allocated for irrigation, drinking, industrial and other uses across the country. The largest share (58 percent) was allocated to irrigation (see indicator: Consented freshwater takes). 
  • Even when it only temporarily stores water, hydroelectric generation can affect the timing and volume of flows downstream of dams and diversions. Some hydro schemes divert flows from one river to another, or to the ocean, and are considered consumptive uses of water. The amount of water used by these consumptive schemes is significant in some regions (see Our freshwater 2020). 

Indigenous freshwater species are under threat 

Many indigenous freshwater species are threatened with extinction or at risk of becoming threatened. 

  • In 2017, 76 percent of indigenous freshwater fish species (39 of 51) were threatened with extinction or at risk of becoming threatened, including seven identified as treasured (taonga) (figure 4). Estimated population trends show 63 percent of species have decreasing populations and 2 percent have increasing populations (see indicator: Extinction threat to indigenous species). 
  • In 2021, 68 percent of indigenous freshwater-dependent bird species (19 of 28) were threatened with extinction or at risk of becoming threatened (figure 4). A number of these are also considered to be taonga species (Keane-Tuala, 2015; Taura et al, 2017; Te Manahuna Aoraki Project, 2022; see Our freshwater 2023). Estimated population trends show 29 percent of species have increasing populations and 25 percent decreasing (see indicator: Extinction threat to indigenous species).  
  • In 2017, 39 percent of indigenous freshwater plant species (71 of 180) were threatened with extinction or at risk of becoming threatened (figure 4). Estimated population trends show 20 percent of species have decreasing populations and 77 percent have stable populations (see indicator: Extinction threat to indigenous species). 
  • In 2018, 26 percent of assessed indigenous freshwater invertebrates (177 of 670) were threatened with extinction or at risk of becoming threatened, including three identified as taonga (figure 4). Estimated population trends show 3 percent of assessed species have decreasing populations and no species has an increasing population (see indicator: Extinction threat to indigenous species and Technical annex). 
  • In 2023, 43 percent of indigenous freshwater plant species (77 of 180) were threatened with extinction or at risk of becoming threatened. Estimated population trends show 21 percent of species have decreasing populations and 77 percent have stable populations (de Lange et al, 2024; see Technical annex). 

Figure 4: Extinction threat status of indigenous freshwater species

Bar graphs showing categories of indigenous freshwater species, with the percentage that are threatened, at risk, data deficient, or not threatened.
Note: Totals given for species on the right of this figure show the total number of species assessed. Complete assessments are those where all known species in the group have been assessed. Partial assessments are those where not all species in the group have been assessed (see indicator: Extinction threat to indigenous species).

5 Note that extinction threat information updated since the Extinction threat to indigenous species indicator update in 2023 has been included in the text and is based on New Zealand Threat Classification System data downloads (see Technical annex; NZTCS, 2025). Figure is based only on information available in the indicator (see indicator: Extinction threat to indigenous species).