Introduction

Human activities have driven rapid increases in atmospheric greenhouse gas concentrations, causing Earth to warm. The global mean surface temperature was estimated to be 1.1 degrees Celsius above pre-industrial levels in 2011–20. Projections suggest it will exceed 1.5 degrees by 2030 (IPCC, 2023; WMO, 2024). While this may seem like a small increase, even slight rises can drive increasingly significant changes to the natural environment (see Our atmosphere and climate 2023). The 10 warmest years on record have all been in the past decade (2015–24), with 2024 the warmest (WMO, 2025).  

In Aotearoa New Zealand, we see rising air and sea temperatures, changing rainfall, more frequent droughts, accelerating sea-level rise, glacial retreat and more frequent or severe extreme weather events. These trends are expected to continue with further warming. 

Climate change intensifies pressures and accelerates changes in land, freshwater, marine and air ecosystems. It exacerbates threats such as land degradation, invasive species, resource extraction and pollution. Biodiversity is under pressure from climate change. We see this through changes in where species live, their habitats, their interactions, and in life cycles and seasonal timing. Extreme weather events have direct and damaging impacts on species and ecosystems. 

Biodiverse and resilient ecosystems can shield us from the worst impacts, as they absorb some emissions and can provide buffers against extreme weather events and rising seas. Conversely, the continuing loss of biodiversity and degradation of ecosystems weaken their ability to provide these benefits (see Our land 2024). 

This section looks at our emissions and how our activities are contributing to an increase in concentrations of greenhouse gases in the atmosphere. It then focuses on our changing climate and how this is affecting the environment.  

For the wider consequences, see section 7: Impacts on people, society and the economy.  

New and updated atmosphere and climate indicators and evidence since Environment Aotearoa 2022

Update to greenhouse gas concentrations indicator 

The 2023 indicator update confirms that atmospheric concentrations of carbon dioxide, methane and nitrous oxide, measured in the Wellington area, increased in the decade up to 2022. 

(See Atmospheric concentrations of greenhouse gases in New Zealand have increased substantially since pre-industrial times, and have continued to increase in recent years.) 

New data on greenhouse gas emissions from human activities 

The 2024 update of New Zealand’s greenhouse gas inventory shows that in 2022 our total gross emissions were at their lowest since 1999, but still higher than in 1990. All sectors (except Tokelau) saw reductions in emissions between 2021 and 2022. 

Carbon sequestered by land use, land-use change and forestry offset a quarter of our emissions in 2022, compared with 1990 when sequestration by this sector offset about a third of our emissions. 

(See Our greenhouse gas concentrations and emissions profile.) 

Updated climate indicators and new evidence  

Indicator updates show New Zealand’s average air temperature continues to rise, and most monitored areas are experiencing more warm days and higher growing degree days (indicating longer growing seasons). The frequency of medium-term (agricultural) drought is increasing in many places.  

The updates also show that the south of New Zealand is becoming wetter, and the north and east are becoming drier. Maximum daily rainfall is likely increasing across more areas of the South Island, and likely decreasing across more areas of the North Island, and extreme wind is likely decreasing across most of New Zealand. These findings are supported by additional new evidence indicating that extreme weather events are becoming more frequent and severe due to climate change from human activities. 

The 2024 update to the national climate projections for New Zealand provides insight into the future state of several climate variables, including temperatures, rainfall, drought and extreme winds. 

(See New Zealand’s climate is changing.

More evidence for climate impacts on species and ecosystems 

Evidence continues to grow that climate change intensifies pressures on land, freshwater and marine ecosystems, exacerbating threats such as land degradation, invasive species, resource extraction and pollution. 

Evidence continues to grow that climate change affects where species live, their habitats, interactions, life cycles and seasonal timing across terrestrial, freshwater and marine ecosystems. 

(See Many impacts of climate change affect biodiversity and ecosystems.) 

Our emissions

Greenhouse gas emissions from human activities are accumulating in the atmosphere. They are the most significant driver of climate change since pre-industrial times. 

Natural influences, such as climate oscillations, can also lead to shorter-term changes over years and decades. However, by increasing the amount of greenhouse gases in the atmosphere, humans are having a significant impact on our climate. 
Our greenhouse gas concentrations and emissions profile 

Atmospheric concentrations of greenhouse gases in New Zealand have increased substantially since pre-industrial times, and have continued to increase in recent years.

  • In 2023, global atmospheric carbon dioxide (CO2) concentrations were 419.3 parts per million (ppm), higher than at any time in at least 2 million years (IPCC, 2023). 
  • The highest atmospheric CO2 concentration observed in New Zealand between 1972 and 2022 (415.5 ppm) was in August 2022. This was up 6 percent since 2012, and around 48 percent higher than pre-industrial levels of 280 ppm (Ciais et al, 2013; see indicator: Greenhouse gas concentrations). 
  • The highest observed atmospheric methane (NH4) concentration in New Zealand between 1989 and 2022 (1881.4 parts per billion [ppb]) was in October 2022, around 169 percent higher than pre-industrial levels of 720 ppb (Ciais et al, 2013; see indicator: Greenhouse gas concentrations). 
  • The highest atmospheric nitrous oxide (NO2) concentration observed in New Zealand between 1996 and 2022 (335.5 ppb) was in December 2022, around 24 percent higher than pre-industrial levels of 270 ppb (Ciais et al, 2013; see indicator: Greenhouse gas concentrations). 

New Zealand has a unique greenhouse gas emissions profile.  

  • Our share of global greenhouse gases emissions is small, but gross emissions per person are high compared with other developed countries (MfE, 2024d). 
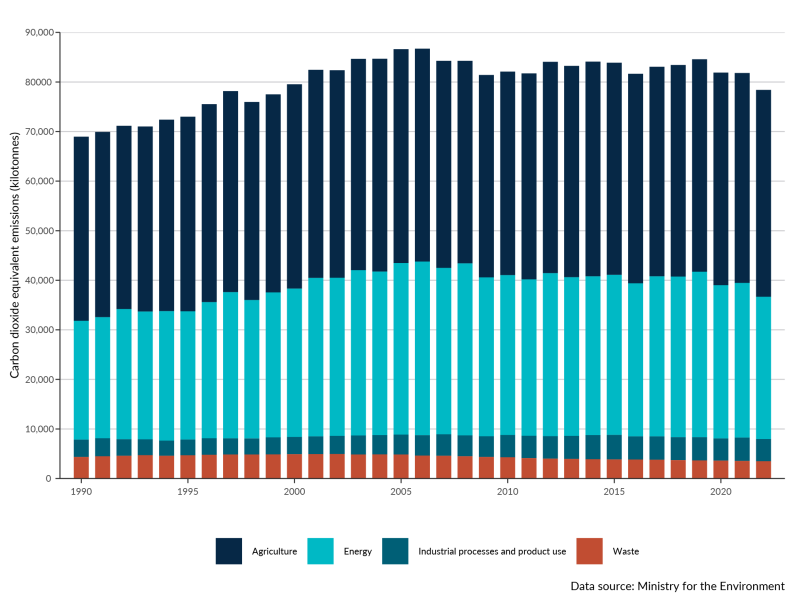
  • Most developed countries emit more CO2 than NH4 and NO2, but for New Zealand it is the opposite. This is mainly due to the scale of the agriculture sector proportional to population, a relatively small energy sector and a high proportion of renewable electricity (MfE, 2024d); (figure 9). 
  • Methane and NO2 emissions from agriculture made up 52 percent of gross emissions in 2022. Livestock emitted 90 percent of NH4, and agricultural soils emitted 92 percent of NO2, mainly due to effects of livestock waste and fertiliser use (MfE, 2024c). 
  • Carbon dioxide emissions made up 40 percent of the country’s gross emissions in 2022. Emissions from road transport (part of the energy sector) accounted for 39 percent of gross CO2 emissions in 2022 (MfE, 2024c). This is driven by a high rate of road vehicle use – per capita rates of CO2 emissions from road transport are some of the highest in the world (MfE, 2024d; see section 5: Air).  

Gross emissions peaked in 2006 and have been declining since 2019. 

  • In 2022, our gross greenhouse gas emissions were 14 percent higher than in 1990, and 7 percent lower than in 2019. After peaking in 2006, they stayed relatively stable through to 2019, after which they declined year on year (MfE, 2024c).  
  • The effects of the COVID-19 pandemic were a factor in lower emissions between 2020 and 2021, but did not influence their continued decrease between 2021 and 2022. This most recent reduction has seen emissions at their lowest since 1999, with reductions across all sectors, except Tokelau (MfE, 2024c).  
  • Methane emissions increased by 2 percent between 1990 and 2022. Since peaking in 2006, they have declined slightly (MfE, 2024c). Carbon dioxide emissions increased 24 percent between 1990 and 2022. They increased between 1990 and 2008, before plateauing and beginning to decline in 2019 (MfE, 2024c). 
  • Nitrous oxide emissions increased 35 percent between 1990 and 2022, and combined fluorinated gases increased 87 percent (MfE, 2024c).  
  • Our net emissions are projected to decrease in the future. Based on the economic conditions and policies in late 2024, net target accounting emissions (which include all gross emissions and a subset of emissions and removals from the land use, land-use change and forestry sector) are projected to decrease 20 percent between 2020 and 2030, and 35 percent between 2020 and 2050 (MfE, 2024j).  

Figure 9: Annual gross greenhouse gas emissions by sector, 1990–2022 

Column chart showing carbon dioxide equivalent emissions in kilotonnes between 1990 and 2023. Each column is divided into four sectors: agriculture, energy, industrial processes and product use, and waste.
Note: Emissions presented here exclude those from Tokelau. Gross emissions do not include reductions from the land use, land-use change and forestry sector (MfE, 2024c). The energy sector includes transport.

Greenhouse gas emissions from most sectors decreased in 2022.  

  • Agriculture: Emissions have been declining slowly since peaking in 2014, and decreased 1.4 percent between 2021 and 2022. This reduction is mainly due to long-term decreases in beef cattle and sheep populations, and lower synthetic fertiliser use (MfE, 2024c; see section 2: Land). 
  • Energy: Emissions decreased 8 percent between 2021 and 2022. This included a 39 percent reduction in public electricity generation and heat production emissions due to high rainfall increasing the proportion of power generated by hydropower. Petroleum-refining emissions also dropped 76 percent following the closure of the country’s only oil refinery (Marsden Point) in March 2022 (MfE, 2024c). 
  • Road transport: Emissions decreased 1.6 percent between 2021 and 2022, to levels 5 percent lower than before the COVID-19 pandemic (MfE, 2024c). This reduction may be due to a combination of factors, such as changes in driving patterns or the increased use of more fuel-efficient cars (MfE,2024d).  
  • Industrial processes and product use: Emissions decreased 5 percent between 2021 and 2022, mainly due to the closure of the Marsden Point Oil Refinery, and the effects of the COVID-19 pandemic (MfE, 2024c). 
  • Waste: Emissions decreased 1.5 percent between 2021 and 2022, to levels 4 percent lower than 2019. Waste emissions have been declining since 2002 due to ongoing improvements in landfill management and wastewater treatment (MfE, 2024c). 

Carbon dioxide is removed from the atmosphere when plants grow and store carbon, which offsets some, but a decreasing percentage, of our emissions. 

  • The land use, land-use change and forestry sector offset 25 percent of New Zealand’s gross greenhouse gas emissions in 2022, a decrease from 1990, when it offset 35 percent. Net removals from this sector are variable because of the influence of forest planting and harvesting cycles (MfE, 2024c).  
  • New Zealand is experiencing historically high rates of afforestation, and low deforestation rates, mostly affecting exotic forests, which help absorb carbon (MfE, 2024c). Up to the latest measurement in 2018, native vegetation cover was decreasing, reducing the ability of native forests and other native vegetation to absorb carbon (see section 2: Land). 
  • Healthy peatlands and wetlands offer vast, long-term carbon storage potential (Ausseil et al, 2015). However, their ongoing degradation and drainage for agriculture (see section 3: Freshwater) results in releases of stored organic carbon into the atmosphere (Clarkson et al, 2013). More than 600,000 tonnes of carbon were lost to the atmosphere from peatland fires at Kaimaumau-Motutangi and Awarua wetlands in 2022 (Pronger et al, 2024).  

Other emissions also affect the climate and atmosphere 

Global efforts to reduce the use of ozone-depleting substances have reduced the hole in the ozone layer, but some substitutes are potent greenhouse gases. 

  • New Zealand has phased out the use and manufacture of the ozone-depleting substances, controlled under the Montreal Protocol to protect the stratospheric ozone layer, which took effect in 1992 (MfE, 2021b). 
  • The size of the ozone hole naturally varies from year to year, but is on track to recover. Global ozone levels are projected to return to pre-1980 levels by the mid-2060s (NASA, 2024; WMO, 2022).  
  • The annual average thickness of the ozone column at Lauder, Otago decreased between 1979 and 2022 but was slightly thicker than the global average over the same period (see indicator: Atmospheric ozone). 
  • Hydrofluorocarbons are potent greenhouse gases often used as substitutes for ozone-depleting substances. From 2019, hydrofluorocarbons and related compounds have been phased down under the Kigali Amendment to the Montreal Protocol (MfE, 2019). 
  • New Zealand’s hydrofluorocarbon emissions were 14 percent higher in 2022 than in 2019, and accounted for 34 percent of emissions from the industrial processes and product use sector (MfE, 2024c).  

Particles in the atmosphere can have heating and cooling effects on the climate. 

  • Aerosols are small solid or liquid particles in the atmosphere that are formed by human and natural sources. They affect the weather and climate in many ways, including by influencing cloud formation and solar radiation (Hamilton, 2015; Ruiz-Arias, 2021; Sakai et al, 2016; Shi et al, 2022; Spada et al, 2015; Su et al, 2024). 
  • Understanding of how these particles interact with clouds remains limited, and is a large source of uncertainty in understanding Earth’s climate and future changes (Boucher et al, 2013; Su et al, 2024). 
  • Black carbon absorbs sunlight due to its dark colour, and has localised warming effects in New Zealand (see Our atmosphere and climate 2023). It mostly comes from vehicles, domestic fires and wildfires (Bond et al, 2013; Lee et al, 2022). No inventory exists for black carbon emissions in New Zealand, though nitrogen dioxide emissions can be used as a proxy for these (see section 5: Air and Our atmosphere and climate 2023). 
  • Wildfires and dust storms in Australia produce dust that can be carried to New Zealand. They have the potential to influence our climate (Brahney et al, 2019; Nguyen et al, 2019). 

Our changing climate

Climate change is causing warmer temperatures, shifting rainfall patterns, more frequent droughts and stronger winds. These changes affect how and when we can grow food, store water or build infrastructure.  

The changing climate is also altering natural climate phenomena such as El Niño and La Niña, making extreme weather events more intense. This puts additional pressure on habitats and species, leading to biodiversity loss and ecosystem disruption.  
New Zealand’s climate is changing 

Long-term annual average temperatures are rising, with fewer frost days and increasing growing degree days (indicating longer growing seasons). 

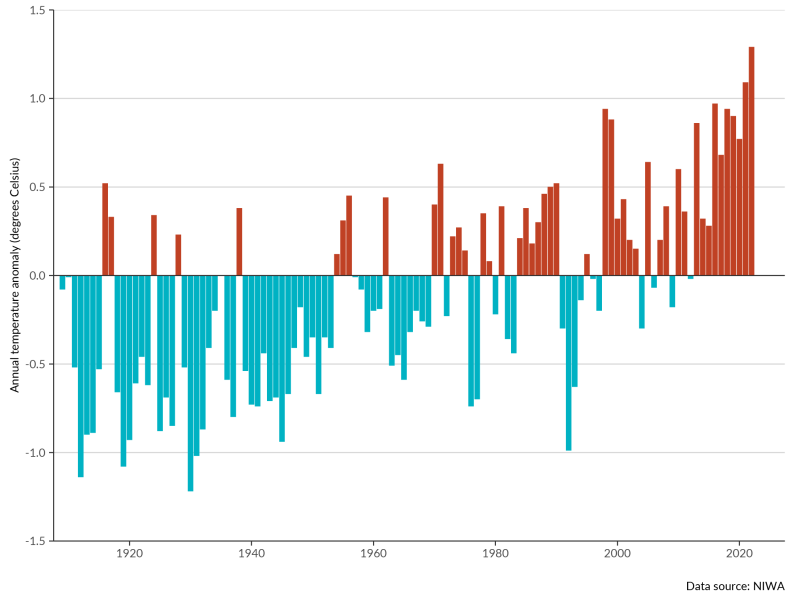
  • The annual average temperature in New Zealand has increased 1.26 (± 0.27) degrees Celsius between 1909 and 2022, and 8 of the 10 warmest years on record occurred between 2013 and 2022 (see indicator: Temperature and figure 10). The annual average temperature is projected to increase 1.9 degrees Celsius by 2090, compared with the 1995–2014 period under the Shared Socio-economic Pathway 2-4.5 scenario (MfE, 2024b; see Technical annex).  
  • The number of warm days (when the maximum temperature is above 25 degrees Celsius) increased at 25 of 30 monitoring sites across New Zealand between 1972 and 2022, and decreased at three (see indicator: Temperature). More warm days are projected for most of the country, especially the north and east of the North Island (MfE, 2024b).  
  • The number of frost days (when the minimum air temperature is below zero degrees Celsius at 1.2 metres above the ground) decreased at 20 of 27 sites between 1972 and 2022, and increased at five (see indicator: Frost and growing degree days). Fewer frost days are projected for the west and south of the South Island (MfE, 2024b).  
  • Growing degree days (the amount of warmth available for plant and insect growth during a growing season) increased at 29 of 30 sites between 1972 and 2022 (see indicator: Frost and growing degree days). 

Figure 10: New Zealand annual average temperature anomaly, 1909–2022 

Column graph showing annual sea-surface temperature anomalies for each year 1909-2022, with a greater number of positive anomalies in recent years indicating warming temperatures.
Note: The baseline for temperature anomalies is the average annual temperature for the 30 years from 1961 to 1990 (see indicator: Temperature).

Rainfall patterns are changing, with the south becoming wetter and the north and east becoming drier. 

  • Annual rainfall increased at 15 of 30 monitoring sites between 1960 and 2022, and decreased at eight. There were increases at many sites in the southern South Island, and decreases at many sites in the northern half of the North Island (see indicator: Rainfall). By 2090, the west and south of the South Island are projected to have higher annual rainfall. The North Island is projected to have lower annual rainfall, particularly in the north and the east (MfE, 2024b).  
  • Most sites with increasing rainfall trends also had increases in their annual maximum oneday rainfall amounts. Annual maximum one-day rainfall increased at 12 of 30 sites, and decreased at 10 (see indicator: Extreme rainfall). 

Frequency of medium-term agricultural drought is increasing in many places.  

  • The frequency of medium-term agricultural drought events (a marked shortage of moisture compared with what is expected across a six-month period) increased at 15 of 30 monitoring sites between 1972 and 2022, and decreased at six (see indicator: Drought). By 2090, drought is projected to increase in the east of New Zealand and decrease in the west (MfE, 2024b).  

Extreme winds are decreasing at most sites. 

  • Annual averages of the daily maximum wind gust decreased at 14 of 17 sites between 1980 and 2022, and increased at three (see indicator: Extreme wind). 
  • Fewer windy days (with maximum wind speed more than 10 metres per second) per year are projected for much of the North Island, and more are projected for most of the South Island by 2090 (MfE, 2024b).  

Extreme weather events are becoming more frequent and/or more intense.  

  • New Zealand has recently seen multiple severe weather events happening at the same time or in the same place, or both. One example is the atmospheric river that delivered an unprecedented amount of rainfall to Auckland in January 2023, closely followed by the effect of Cyclone Gabrielle across much of the North Island in February 2023 (Harrington et al, 2023; Stone et al, 2024). 
  • In 2021, extreme rainfall events that caused flooding in Canterbury were 10 to 15 percent more intense because of climate change. Similarly, extreme weather and associated flooding on the West Coast in 2021 were nearly 10 percent more intense due to climate change (MfE, 2023a; Stone et al, 2022). 
  • Floods are among the most frequent and damaging natural hazards in New Zealand (Frame et al, 2020; Royal Society Te Apārangi, 2016). They are mostly caused by heavy and/or prolonged rainfall but can be mitigated or exacerbated by other factors such as land use and infrastructure (Auliagisni et al, 2022). As the climate changes, flooding caused by higher rainfall and rising sea levels is expected to increase (Bodeker et al, 2022; Pourzand et al, 2023; Thomas et al, 2024) 
  • The frequency of tropical cyclones is slightly decreasing over the South Pacific basin (Roberts et al, 2020), but the cyclones that do form are more severe (Bodeker et al, 2022; Chand et al, 2022). 
  • The frequency of extreme temperature events in New Zealand has increased two to threefold due to human influence since pre-industrial times (Thomas et al, 2023; see Technical annex). 
  • The wildfire risk is changing. The number of days with very high and extreme fire danger increased at 12 of 28 sites between 1997 and 2019, and decreased at eight (see indicator: Wildfire risk). Comparison of fire risk is complicated due to the difference in fuel type used for analysis between sites (see Technical annex and Our atmosphere and climate 2023). 
  • In the 2021/22 wildfire season, 4,417 fires burnt an area of 4,864 hectares. This area was smaller than in the wildfire seasons in 2020/21 (4,586 fires burnt an area of 13,348 hectares) and 2019/20 (5,735 fires burnt an area of 10,415 hectares) (FENZ, 2021, 2022, 2023). 
  • The wildfire risk is expected to increase across many regions of New Zealand through the rest of the century, compared with its first two decades (Langer et al, 2021; Melia et al, 2022). 

Climate varies naturally but natural variation might be changing too 

El Niño Southern Oscillation and Southern Annular Mode influence natural climate variability.  

  • Natural patterns of change (oscillations) influence the weather and climate in New Zealand, including the El Niño Southern Oscillation (ENSO), Interdecadal Pacific Oscillation (IPO) and Southern Annular Mode (SAM) (see indicators: El Niño Southern Oscillation, Interdecadal Pacific Oscillation and Southern Annular Mode). 
  • ENSO has three phases: neutral, El Niño and La Niña (NIWA, nd-a). New Zealand may experience more northeasterly winds and wetter conditions in the north and east, and warmer-than-average air and sea temperatures during La Niña. During an El Niño phase in summer, increased westerly winds, more rain in the west and dryness in the east occur. In winter, El Niño can lead to more frequent, cooler southerly winds (see indicator: El Niño Southern Oscillation; Ummenhofer et al, 2009). However, understanding of how ENSO modulates the climate remains limited. 
  • The most recent El Niño phase was from July 2015 to April 2016. This was one of the two strongest El Niño phases between 1990 and 2022, the other occurring during 1997 to 1998. The most recent La Niña phase was from April 2022 to December 2022 (see indicator: El Niño Southern Oscillation). 
  • Climate models indicate that ENSO variations have increased in size by up to 10 percent since 1960, partly due to rising greenhouse gas concentrations in the atmosphere (Cai et al, 2023). One result is that El Niño and La Niña events are becoming stronger and more frequent (Cai et al, 2023). 
  • SAM is associated with the strength and position of westerly winds and storm tracks. The recent declines in extreme wind magnitude and frequency in New Zealand are likely related to SAM more often being in a ‘positive’ phase, which moves storm tracks further south (NIWA, nd-b; Thompson et al, 2011). 
  • Evidence indicates the positive trend of SAM over recent decades is an indirect response to stratospheric ozone depletion and climate change (Goyal et al, 2021; King et al, 2023; Morgenstern, 2021). 

Complex atmospheric phenomena influence rainfall and flooding.  

  • Varying atmospheric circulation affects the transport of moisture and has a complex connection to precipitation in New Zealand (Bennet & Kingston, 2022; Thomas et al, 2024). 
  • New Zealand is exposed to extreme precipitation events caused by fronts, atmospheric rivers, cyclones and other atmospheric phenomena. In particular, we are in a region of high atmospheric river activity (Reid et al, 2021). Longer extreme precipitation events generally lead to higher rainfall accumulation and more widespread flooding (Vishwanathan et al, 2024). 
  • Extreme precipitation events often occur when multiple atmospheric phenomena interact. For example, prolonged heavy rain can occur when atmospheric blocking (high-pressure systems that halt normal weather movement) interacts with atmospheric rivers (Prein et al, 2023; Vishwanathan et al, 2024). 
  • Notable examples include the July 2021 Westport flood, caused by an atmospheric river stalling over the Buller River catchment (Stone et al, 2022), and the February 2023 northeastern flood, linked to Cyclone Gabrielle stalling off the north coast (Harrington et al, 2023). 

Many impacts of climate change affect biodiversity and ecosystems 

Climate change intensifies pressures from human activities on ecosystems, amplifying threats such as land degradation, invasive species, resource extraction and pollution. 

  • Increased frequency and intensity of heavy rainfall events exacerbate land degradation through landslides and soil erosion, especially in areas with exposed soils or non-native vegetation. This can reduce the productivity of the land, and increase the amount of sediment that washes into downstream environments (see section 2: Land, section 3: Freshwater, section 4: Marine and section 7: Impacts on people, society and the economy). 
  • Climate change creates more favourable conditions for exotic pests and diseases to invade, establish and spread (Keegan et al, 2022; Meurisse et al, 2023; Mouton et al, 2022). This poses a growing threat to the natural environment and primary sectors (Meurisse et al, 2023; see section 3: Land, section 4: Marine and section 7: Impacts on people, society and the economy). 
  • Total glacier ice volumes in New Zealand decreased 35 percent, and the rate of annual loss increased between 1978 and 2020 (see indicator: Annual glacier ice volumes). Receding glaciers and changes to snow cover are expected to affect flows in glacier- and snow-fed rivers, altering downstream water supply for ecosystems, irrigation and hydropower (Keegan et al, 2022; Purdie, 2022; Queen et al, 2023). This also increases risks of natural hazards arising from higher run-offs and lake outburst (IPBES, 2018). 
  • Streamflow patterns have changed across the country as the climate has changed. Between 1969 and 2019, winter streamflow increased in the western South Island and decreased in the northern North Island. Summer streamflow decreased across the northern regions of the North Island (Queen et al, 2023). This has compounded the effects of water take and land use on river flows in some areas (Booker & Snelder 2023; see section 3: Freshwater). 
  • More frequent floods and droughts can exacerbate many forms of water pollution, from sediments to pathogens and pesticides (IPCC, 2022). Increasing freshwater temperatures are expected to increase the risk of cyanobacteria blooms, degrading water quality and potentially rendering some freshwater unsafe for consumption (Puddick et al, 2022). 
  • Rising sea-surface temperatures, marine heatwaves and ocean acidification can exacerbate fishing pressure by affecting the lifecycle and reproduction of marine species such as kōura (crayfish) and tāmure (snapper), which are already declining due to overfishing and other human activities (Cummings et al, 2021; Gee, 2021; Heeringa, 2021; Shears et al, 2024).  

Climate change is directly affecting land, freshwater and marine habitats and species already under pressure from other human activities. 

  • Wildfires pose a growing risk to forests, as well as to wetlands and tussock grassland, which are already in decline (Case et al, 2023; Melia et al, 2022; Pronger et al, 2024; see section 2: Land and section 3: Freshwater). Recovery from fire events is slow, and fires can disrupt the natural succession of ecosystems and favour non-native species over native ones (Case et al, 2023; Perry et al, 2014; Richardson et al, 2018). 
  • Changes in precipitation and rising temperatures alter the timing of seasonal events such as flowering, growth and migration, and species interactions. The impacts are felt across entire terrestrial ecosystems. For example, rising temperatures contribute to the increased frequency of beech mast (a period during which beech trees produce a large amount of seeds). This can lead to outbreaks of pests (rats, mice and stoats) that threaten native forest birds and long-tailed bats (King, 1983; O’Donnell et al, 2017).  
  • Some alpine species of lizards, insects and birds may face habitat loss as warming is expected to shift snowlines (Jarvie et al, 2022; Koot et al, 2022; Lorrey et al, 2022; Weinhäupl & Devenish-Nelson, 2024).  
  • Droughts can alter soil properties and carbon cycling (Macinnis-Ng & Schwendenmann, 2015) and cause changes to forest diversity as more drought-resistant species survive (Wyse et al, 2013). Droughts can harden soils, making it difficult for species such as kiwi to extract food (Boffa Miskell, 2020). 
  • Changes in freshwater temperatures, and in drought and flood frequency, are predicted to influence the life cycles and successful migrations of some native freshwater fish species (Awatere et al, 2021; Egan et al, 2020; Keegan et al, 2022). Increased rainfall and flooding can degrade habitats for freshwater fish, freshwater-dependent birds and other freshwater species (Awatere et al, 2021; Goodman, 2018; Keegan et al, 2022). 
  • Rising sea-surface temperatures can reduce food availability for seabirds in some areas (Mills et al, 2008; Salinger et al, 2023). Ocean acidification and warmer temperatures are expected to make it harder for species such as molluscs and corals to grow and maintain their shells and skeletons (Anderson et al, 2022; Law et al, 2018).  
  • Primary productivity (see section 4: Marine) is expected to decrease around the North Island and west coast of the South Island in response to increasing sea temperatures, but may increase in water off southern New Zealand (Roberts & Hendriks, 2022).  
  • Marine heatwaves have caused unusual fish migrations, severe bleaching and necrosis of sponges, large losses of farmed salmon and southern bull kelp (rimurapa), and likely contributed to the mass mortality of blue penguins (kororā) in the Bay of Plenty (Salinger et al, 2019, 2020, 2023). In some areas where the bull kelp was completely lost during the 2017/18 heatwave, an invasive, nonnative kelp established. This coincided with a sharp decrease in green-lipped mussels (kākahi), an important traditional food-gathering (mahinga kai) species (Awatere et al, 2021; Thomsen et al, 2019). 
  • Sea-level rise and storm surges threaten coastal ecosystems and freshwater species by moving saltwater farther into coastal freshwater environments, altering their salinity (Cañedo-Argüelles et al, 2013; IPCC, 2022; Neubauer et al, 2013; Schallenberg et al, 2003). Rising sea levels have also led to a loss of nesting sites for various shorebirds (Keegan et al, 2022). 
  • Seawalls and coastal hardening protect our homes and communities from rising sea levels. However, they also limit the ability of coastal habitats, such as sandy beaches, dunes and wetlands, to retreat inland. This may cause further loss of these important habitats (Allan et al 2023; Douglas et al, 2022; MfE, 2024g; Stewart et al, 2020).