
The air we breathe plays an important role in our health and our quality of life. Although we cannot see the air, we can see its impacts on people and the environment.
Air and light link all components of Earth, and reflect cultural connections to the environment (te taiao). In the Māori language (te reo Māori), the word hau can mean air or wind, and can also refer to the vital essence or vitality of a person, place or object. The origins of these words recognise that our health (hauora) and the health of the air (hau takiwā) are interlinked. The clarity of the air and visibility of the night sky are important for many Māori cultural practices.
This section looks at two key issues. The first relates to air quality and the sources of air pollution. In Aotearoa New Zealand, air quality is generally good compared with many other countries, largely due to prevailing winds. However, increasing urbanisation can mean that more people are at risk of exposure to polluted air.
The second key issue in this section is artificial light and its effects on the environment. Artificial light at night is increasing in both extent and brightness, with potential impacts on native species.
Air pollution and artificial light also have wider consequences – see section 7: Impacts on people, society and the economy.
Updates to air quality indicators
Concentrations of the air pollutants particulate matter (PM10 and PM2.5), nitrogen dioxide, and sulphur dioxide continue to decrease at most monitoring sites. However, many sites still exceed World Health Organization (WHO) guidelines at times.
No monitoring sites exceeded WHO guidelines for the air pollutants ground-level ozone and carbon monoxide.
(See Air quality is improving, but pollutant levels in some areas could pose risks to human health.)
Updated data for road vehicles and reductions in transport emissions
Although the air pollutant emission factor has not been updated, new evidence shows that motor vehicle engine and fuel improvements continue to reduce air pollutant emissions from transport. This is despite increases in the total number of kilometres travelled in a year, the size of our vehicle fleet, and the proportion of our vehicles with diesel engines (which has been growing steadily). However, the number of electric vehicles (battery electric and plug-in hybrid) has grown, nearly doubling from 2022 to 2024.
Updates to home heating data
New data show that burning wood and coal for home heating (which is a major source of particulate matter emissions) continues to decline in favour of heat pumps and electric heaters. However, although coal burning is now very rare, about one-third of homes still rely on burning wood or pellets.
(See Burning wood for home heating is a major source of PM2.5.)
Air quality standards in New Zealand require monitoring of four gas pollutants: nitrogen dioxide (NO2), sulphur dioxide (SO2), carbon monoxide (CO) and ground-level ozone (O3) (LAWA, 2023b).
Particulate matter (PM) is another form of monitored air pollution. PM is tiny solid particles and liquid droplets suspended in the air. It can include substances such as heavy metals and microplastics (Fan et al, 2022; Semadeni-Davies et al, 2021).
This subsection compares air quality measures to national standards (NESAQ) and international guidelines (WHO), to understand the risks to human health (for details on standards, see Technical annex).
Most of the monitoring network is in urban areas where we expect pollution to be highest and where people are more exposed. As a result, we know little about air pollution in less populated areas, or its effects on native species and ecosystems.
This subsection also reports on air pollutants that have direct impacts on human health. It does not cover greenhouse gas emissions (for this information, see section 6: Atmosphere and climate).
Air quality is improving, but pollutant levels in some areas could pose risks to human health
Gas pollutants are decreasing in most places where they are monitored, but NO2 and SO2 concentrations exceed guidelines in some areas.
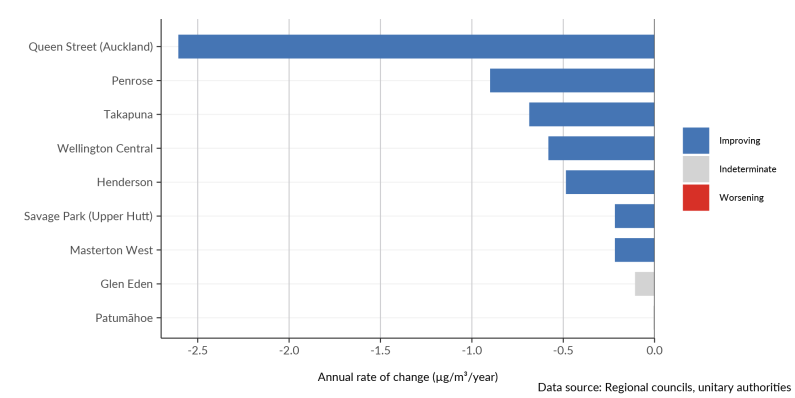
- Trends in annual average NO2 concentrations were improving at 99 of 114 sites (87 percent) in the New Zealand Transport Agency | Waka Kotahi monitoring network between 2014 and 2023. No sites showed worsening. Trends in NO2 concentrations were improving at seven of the nine regional council and unitary authority sites between 2016 and 2023, and no trend was detected at the other two (figure 7).
- Concentrations of NO2 were above the 24-hour WHO guideline at 6 of 10 sites (60 percent) between 2020 and 2023. Five of 10 sites were above the annual WHO guideline at least once during the same period and one site was above the one-hour NESAQ standard (see indicator: Nitrogen dioxide concentrations: Data to 2023 and Technical annex).
- Between 2016 and 2023, trends in annual average SO2 concentrations were improving at three of four sites, and no trend was detected for the other site.
- Concentrations of SO2 were above the 24-hour WHO guideline at two sites between 2020 and 2023. No sites exceeded the one-hour NESAQ standard (see indicator: Sulphur dioxide concentrations: Data to 2023).
- Between 2016 and 2023, trends in annual average ground-level ozone concentrations were improving at Patumāhoe (Auckland) and worsening at Wellington Central. Both sites were within WHO guidelines between 2020 and 2023 (see indicator: Ground-level ozone concentrations: Data to 2023).
- Between 2016 and 2023, trends in annual average CO concentrations were improving at one of the three sites in the Greater Wellington region where trends could be assessed, and no trends were detected for the other two. All four sites across the Auckland and Greater Wellington regions were within the WHO guidelines between 2020 and 2023 (see indicator: Carbon monoxide concentrations: Data to 2023).
Figure 7: Nitrogen dioxide trends by monitoring site, 2016–23
Particulate matter is decreasing in most places where it is monitored, but concentrations exceed health guidelines in some areas.
- Air quality monitoring in New Zealand focuses on two categories of PM. PM10 refers to airborne particles that are less than 10 micrometres in diameter. PM2.5 is fine particulate matter, a subset of PM10, referring to airborne particles less than 2.5 micrometres in diameter (LAWA, 2023b).
- Between 2016 and 2023, trends in annual average PM10 concentrations were improving at 30 of 41 sites where trends could be assessed (73 percent) and worsening at 4 (10 percent).
- Concentrations of PM10 exceeded the 24-hour NESAQ standard at 19 of 58 assessed sites (33 percent) on two or more days between 2020 and 2023. Thirty-eight sites (66 percent) were above the 24-hour WHO guideline on at least one day per year during the same period. Twenty-seven sites (47 percent) were above the annual WHO guideline in at least one of those years (see indicator: PM10 concentrations (air quality): Data to 2023).
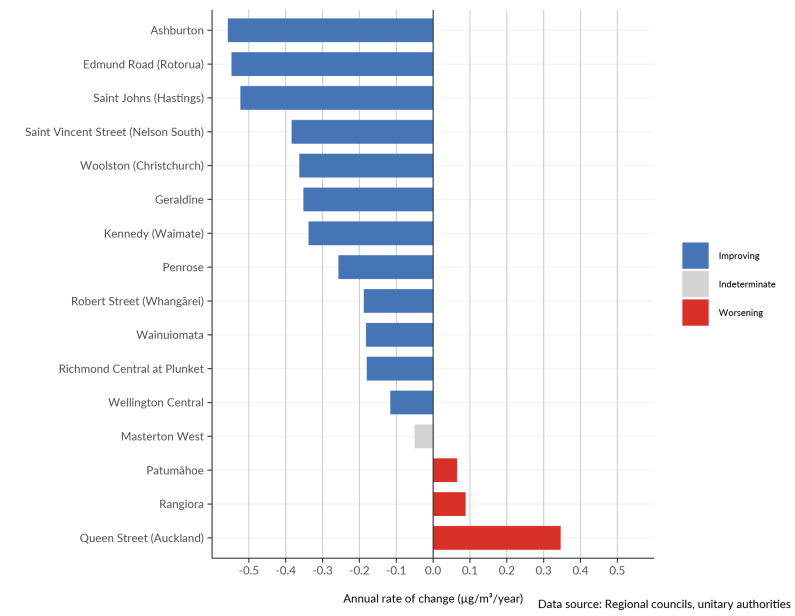
- Between 2016 and 2023, trends in annual average PM2.5 concentrations were improving at 12 of 16 sites where trends could be assessed (75 percent) and worsening at 3 (19 percent) (figure 8).
- Concentrations of PM2.5 were above the 24-hour WHO guideline at all 31 assessed sites at least once per year between 2020 and 2023. Twenty-eight sites (90 percent) were above the annual WHO guideline for at least one year during the same period, and 18 were above it every year from 2020 to 2023 (see indicator: PM2.5 concentrations (air quality): Data to 2023).
Figure 8: PM2.5 trends by monitoring site, 2016–23
Air pollution emissions are reducing, but transport and home heating are still the main contributors
Transport is a major source of air pollutants, including sulphur dioxide, carbon monoxide and nitrogen oxides.
- Air pollutant emissions from transport (including road, aviation, shipping and rail) were lower in 2019 than in 2012 for all monitored pollutants except SO2. Emissions of CO were down 47 percent (over 85,000 tonnes). Nitrogen oxides (NO2 and nitric oxide [NO]) were down 12 percent (over 8,000 tonnes) (see indicator: Air pollutant emissions).
- Road vehicles were the largest source of nitrogen oxides (39 percent) in 2019, with the greatest contribution coming from diesel vehicles (see indicator: Air pollutant emissions). Vehicle fuel combustion, particularly diesel, is also a significant source of PM2.5. Wear of brake pads and tyres, and road surface dust, are major sources of PM10 (LAWA, 2023b; Semadeni-Davies et al, 2021).
- Vehicle ownership per person in New Zealand is among the highest in the world. In 2022, we reached the largest fleet size to date, and the largest percentage of diesel vehicles (21 percent) (EHINZ, 2023; MOT, nd-a). The total number of vehicle kilometres travelled in a year has also increased over recent decades (MOT, nd-a, 2022).
- However, emissions of air pollutants from motor vehicle exhaust are reducing due to stronger vehicle emissions standards, increased uptake of lower-emissions vehicles and improvements in engine technology and fuel quality. This trend is expected to continue (Boamponsem et al, 2024; Metcalfe & Kuschel, 2022; NZTA, 2023).
- Domestic shipping is a significant source of SO2 (contributing 16 percent of all SO2 emissions in 2019), although an international treaty now limits the level of sulphur in ship fuel (MOT, nd-b; see indicator: Air pollutant emissions).
Burning wood for home heating is a major source of PM2.5
- The residential energy sector accounted for 30 percent of PM2.5 and 41 percent of CO emissions in 2019, mainly from wood burning for home heating (see indicator: Air pollutant emissions).
- Heat pumps and electric heaters were the most common types of heating used in houses in 2023. Over time, a smaller proportion of homes have been burning wood and coal, but almost one-third relied on wood or pellet burners in 2023. Less than 1 percent of houses used coal burners (EHINZ, 2020; Stats NZ, nd).
Air pollution comes from various human activities, as well as natural sources and climatic conditions
- Other contributors to air pollution emissions include agriculture, construction, industry and other human activities.
- Agricultural activities emit PM, including through tillage, burning vegetation, crop harvesting, applying fertiliser and livestock waste (Metcalfe et al, 2022; Parfitt et al, 2012; see Our air 2018).
- Construction also emits air pollutants, including PM and nitrogen oxides (Cheriyan & Choi, 2020; Kunak, 2023; Yan et al, 2023).
- Dust from unsealed roads was the largest source of PM10 (28 percent) in 2019. Less than 10 percent of this was PM2.5 (see indicator: Air pollutant emissions).
- Burning coal was a major source of SO2 emissions in 2019 (41 percent), mainly from manufacturing, construction, and public electricity generation and heat production. Aluminium production was another significant source (13 percent) (see indicator: Air pollutant emissions).
- Air pollutant emissions from public electricity generation and heat production were lower in 2019 than in 2012 for all pollutants. Sulphur dioxide emissions were down 40 percent, due to lower emissions from coal burning (see indicator: Air pollutant emissions).
Particulate matter can come from natural sources and is influenced by climate, including wind patterns.
- Particulate matter can come from natural sources, including the oceans and volcanoes. Sea salt is the largest natural source of particulate matter in urban areas of New Zealand (Boamponsem et al, 2024; Davy et al, 2024; Revell et al, 2024).
- Climate conditions influence the amount and types of PM and gases in the air. Stable weather allows pollutants to accumulate, while wind and rain can disperse them (Talbot, 2019; UCAR Center for Science Education, nd; Waikato Regional Council, nd). The weather and climate can also be directly influenced by PM (see section 6: Atmosphere and climate).
- As wind and rain patterns alter with climate change, they will affect the extent to which particulate matter disperses and is removed from the air. Areas with drier conditions and more frequent drought could experience worsening air quality due to lower rainfall, higher fire risks and more windblown dust (Bodeker et al, 2022).
Artificial light at night influences the broader quality of the air we experience. Light pollution affects health and cultural practices, and has economic consequences (see section 7: Impacts on people, society and the economy).
Artificial light at night is becoming brighter and more widespread
Light pollution affects much of the population and may affect native species.
In 2014, 97 percent of New Zealand’s population lived under light-polluted skies (Cieraad & Farnworth, 2023).
Between 2012 and 2021, the lit surface area of the country increased by 37.4 percent (from 3.0 percent to 4.2 percent), primarily in rural areas (Cieraad & Farnworth, 2023).
Brightness intensity increased across 4,694 square kilometres during the same period, and decreased across 886 square kilometres. Most of the decreases were observed in urban centres, but their brightness levels remained high relative to rural areas (Cieraad & Farnworth, 2023).
Evidence of the negative impact of light pollution on species in New Zealand is limited. However, growing evidence indicates that it affects and disrupts the habits, interactions and navigation of some native species, such as bats, wētā and seabirds (Cieraad & Farnworth, 2023; Falcón et al, 2020; McNaughton et al, 2022; Meeuwen-Dijkgraaf, 2021; Schofield, 2021; Sterup, 2024).

5. Air
April 2025
© Ministry for the Environment