
Aotearoa New Zealand’s marine environment plays a key role in our national identity. It supports unique habitats and species, and contributes to our quality of life and economy. For many Māori, the ability to gather seafood (kai moana) is an important indicator of the health of the ocean and enables traditional food-gathering practices (mahinga kai) (see Environment Aotearoa 2022).
The marine environment faces significant pressures from human activities, both on land and at sea, and from climate change. Land management practices that affect freshwater through sediment and nutrient run-off also affect our coasts and oceans. Fishing adds to these pressures, and climate change is altering the ocean in different ways. Although some pressures have decreased in recent years, others are increasing. Many marine species are still threatened with extinction, in part because their habitats are shrinking or being damaged.
This section looks at three interconnected issues affecting coastal and marine ecosystem health: the effects of land-based activities on water quality and marine ecosystems, the impacts of fishing practices, and the consequences of climate change for the oceans.
It then examines the impacts on indigenous marine species and habitats.
For the wider effects, see section 7: Impacts on people, society and the economy.
Updates to coastal and estuarine water quality and primary productivity indicators
More coastal and estuarine water quality monitoring sites reported improving trends than worsening ones between 2006 and 2020. This included all nutrient forms (nitrogen and phosphorus) and some sedimentation measures (suspended solids, turbidity).
Most coastal regions saw increasing primary productivity trends between 1998 and 2022, while oceanic regions showed mixed trends, with both increases and decreases in primary productivity.
(See Land-based activities affect water quality and primary productivity.)
New data for fish stocks, bycatch of protected species, and bottom trawling
Most of the assessed fish stocks in the 2023 update to the Fisheries New Zealand Quota Management System were fished within safe limits, while 12 percent were assessed to be overfished or depleted. The latest national survey of recreational fishers reported a decrease in recreational fisheries between 2017/18 and 2022/23, particularly in the north of New Zealand.
The latest update to bycatch data shows that it continues to place pressure on marine protected species.
Two new assessments from the Ministry for Primary Industries on the extent and intensity of bottom trawling showed a decline over time for deepwater and inshore fisheries. Most seamounts and high-productivity areas are either closed to trawling or have never been trawled, while 13 percent of seamounts were trawled at least once in recent decades.
(See Commercial activity in the marine environment affects ecosystems and biodiversity.)
Updates to sea-surface temperature indicator and new data for marine heatwaves
Average sea-surface temperatures have risen across New Zealand’s four oceanic regions between 1982 and 2023, with their warmest years recorded in either 2022 or 2023.
New evidence shows that marine heatwaves have become more frequent, more intense and longer lasting in some parts of the ocean around the country. These trends are expected to continue.
The 2022 update to national sea-level rise projections from the NZ SeaRise Programme indicated that areas in New Zealand experiencing ongoing downward land movement, may face faster relative sea-level rise than previously reported.
(See Climate change and our marine environment.)
Updated national assessment of extinction risk for indigenous marine invertebrates
An updated assessment by the Department of Conservation shows more than half of our indigenous marine invertebrate species remain threatened with extinction, or at risk of becoming threatened.
This part looks at three interconnected issues affecting the health of our coasts and oceans: water quality, fishing and climate change.
Certain land-use and management practices accelerate sediment build-up and nutrient run-off, affecting water quality in marine environments. Although water quality has improved in terms of nutrients in some estuarine and coastal areas, sedimentation is worsening in many places. Plastic waste, which can end up as litter (see section 2: Land), is accumulating in the ocean and along the coasts. Although fishing pressures have decreased, overfishing, bycatch and trawling continue to deplete some fish stocks, harm protected species and damage the seabed. Climate change exacerbates these issues by driving ocean warming, acidification and sea-level rise. These changes disrupt marine species and ecosystems, and increase their vulnerability to invasive species and human disturbance.
Land-based activities affect water quality and primary productivity
Changing sediment levels in coastal and estuarine areas can cause ecological effects.
- New Zealand has naturally high rates of soil loss, with the amount of sediment entering waterways varying regionally. Land use, including agriculture and forestry, can increase the sediment in rivers, as well as downstream in estuaries and coastal waters (Marden et al, 2022, 2023; Phillips et al, 2017; PMCSA, 2021). Increased frequency and severity of extreme weather events are likely to exacerbate soil loss and downstream sediment (see section 2: Land and section 3: Freshwater).
- Between 2006 and 2020, more coastal and estuarine sites had improving trends than worsening for suspended solids (66 of 84) and turbidity, a measure of how cloudy the water is (54 of 87). Monitoring sites were not distributed evenly around the coastline, and were often clustered around urban centres (see indicator: Coastal and estuarine water quality and Technical annex).
- Sediment accumulation rates in estuaries increased by orders of magnitude after European settlement. Sedimentation has continued in some estuaries over the last 20 years, at variable rates due to factors such as the structure of each estuary, and past catchment disturbances (Jones et al, 2022).
- Excess suspended and deposited sediment in estuaries and coastal areas can reduce and alter habitats, smother sensitive species and affect the gills of some species. Fine suspended sediment can clog the gills of filter feeders such as cockles, pipi and scallops (Booth, 2020; Lowe et al, 2015; Morrison et al, 2009; O’Meara et al, 2017; PMCSA, 2021; Thrush et al, 2021).
Excess nutrients from dairy farming and horticulture can affect coastal and estuarine ecosystems.
- Nutrients such as nitrogen and phosphorus occur naturally in estuaries and coastal waters. However, land activities such as dairy farming and horticulture can lead to elevated nutrient levels (see section 2: Land). Excess nutrients that reach estuaries often have delayed effects, which can vary between different parts of an estuary (Lohrer et al, 2023).
- Excess nutrients in estuaries can cause eutrophication, which is an overload of nutrients that produces algal blooms and depletes oxygen levels. This can be harmful to plants, animals and people (Dudley et al, 2020; Plew et al, 2020; Salmond & Wing, 2022; Snelder et al, 2020).
- For nitrogen and phosphorus, more coastal and estuarine sites had improving trends than worsening between 2006 and 2020 (see indicator: Coastal and estuarine water quality).
- Land activities also cause pathogens such as faecal bacteria to enter rivers, lakes, estuaries and coastal waters. These bacteria come from animal excrement, wastewater discharges and contaminated soil run-off, and can harm ecosystems and people (LAWA, 2021; see section 3: Freshwater and section 7: Impacts on people, society and the economy).
- Faecal coliforms are monitored as an indicator of the presence of disease-causing bacteria in waters. Between 2006 and 2020, faecal coliform levels were improving at 50 percent of coastal and estuarine monitoring sites (25 of 50) and worsening at 24 percent (12 of 50) (see indicator: Coastal and estuarine water quality).
Primary productivity is increasing in coastal regions.
- Marine primary productivity describes the growth of phytoplankton in coastal and ocean waters, which provides the energy that supports most marine food webs. It is affected by nutrients, water temperature and the availability of light (see indicator: Marine primary productivity: Data to 2023).
- Areas of high primary productivity support productive marine ecosystems, including various commercial shellfish and finfish fisheries (MPI, 2021a). However, high primary productivity in estuarine and coastal waters can indicate the presence of harmful algal blooms due to excess nutrients from land (Gall & Pinkerton, 2024; Pinkerton et al, 2023; Roberts & Hendriks, 2022).
- Primary productivity is monitored by measuring chlorophyll-a, an indicator of phytoplankton abundance. Phytoplankton monitoring between 1998 and 2022 indicates that primary productivity very likely increased in most coastal regions, at average rates ranging from 5 to 13 percent per decade.
- The oceanic regions showed increasing and decreasing trends in chlorophyll-a concentrations (see indicator: Marine primary productivity: Data to 2023 and Technical annex).
Plastics continue to accumulate throughout the marine environment and affect marine species, including seabirds.
- Plastic waste can stay in the environment for centuries, and is a major problem affecting the land, freshwater and marine environments (PMCSA, 2019; see section 2: Land and section 3: Freshwater).
- In 2023, most of the items (67 percent) counted on beaches in Litter Intelligence surveys were plastic (Litter Intelligence, nd). Some hazardous additives in plastic have also been detected in plastic debris on our beaches (Bridson et al, 2024).
- Marine species and seabirds are at risk from eating or getting tangled in plastics, which can cause injury or death (Buxton et al, 2013; Clark et al, 2023; PMCSA, 2019).
- Microplastics (less than 5 millimetres long), which result from the breakdown of larger plastics, are widespread throughout the marine environment (Asher, 2023; De Bhowmick et al, 2021; Li et al, 2024; PMCSA, 2019). They typically occur in greater quantities near urban centres (Munsterman et al, 2024).
- Microplastics and the chemicals they release accumulate in animals as they move up food chains, harming marine species, and could pose risks to human health (PMCSA, 2019). They have been found in many of New Zealand’s fish species that are eaten by humans, and in green-lipped mussels (Clere et al, 2022; Mazlan et al, 2022). Understanding the effects of microplastics on ecosystems and human health is a growing area of research (Asher, 2023; De Bhowmick et al, 2021; Li et al, 2024; PMCSA, 2019).
Commercial activity in the marine environment affects ecosystems and biodiversity
- While pressures from commercial and recreational fishing have reduced and most is within safe limits, some fish stocks continue to be overfished. Commercial fishing methods in New Zealand include bottom trawling, dredging, longlining and set netting. Bottom trawling is the most common (MPI, 2023f; see Our marine environment 2022).
- In 2023, 88 percent of assessed fish stocks in the New Zealand Fish Quota Management System (133 of 152 stocks) were fished within safe limits, with 109 of these 133 stocks at or above their management goals (MPI, 2024b).
- However, 12 percent of assessed stocks (19 of 152) were overfished or depleted in 2023, including some stock of black cardinalfish, orange roughy and scallops. Five stocks had collapsed, indicating fishery closures should be considered to rebuild the stock quickly (MPI, 2024b).
- The total estimated catch from recreational fishing in 2022/23 was 3.7 million fish and 1.6 million shellfish. Snapper, kahawai, blue cod and red gurnard together made up 80 percent of all fish harvested by recreational fishers (MPI, 2024c).
- Recreational fisheries declined between 2017/18 and 2022/23, particularly in the north of New Zealand. Contributing factors include extreme weather events in 2023, prolonged La Niña conditions and changes in fishing habits (MPI, 2024c).
Bycatch continues to contribute to population decline and extinction risk of some protected species.
- Bycatch is the unintended capture during fishing of non-target species, including protected ones. Removing or killing important species through bycatch threatens biodiversity and puts pressure on marine ecosystems (MPI, 2021b, 2024c).
- Since 2019/20, Hector’s dolphin deaths due to commercial bycatch have ranged from 0 to 5 per year, except in 2023/24, when 15 deaths were reported. All 15 deaths in 2023/24 were reported on the east coast of the South Island, where an estimated 9,728 (61 percent) of the total estimated 15,847 Hector’s dolphins reside (DOC, 2024a; MPI, 2019a).
- Other marine mammals, large numbers of seabirds and some protected corals are also caught as commercial bycatch. For example, models estimated 3,613 seabirds and 476 fur seals were bycaught in trawling and longline fisheries in 2020/21 (Protected species bycatch, nd). In the 2021/22 fishing year, 2,073 kilograms of protected coral were reported as bycaught (McGovern, 2024).
- Between 2 and 34 captures of protected sea turtles were reported each year between 2007/08 and 2019/20, and 58 were reported in 2020/21 (including 50 leatherback turtles). This reporting includes reports by fishery observers and self-reporting by commercial fishers (Dunn et al, 2022).
The area trawled each year has been declining, but trawling still affects the seafloor and the animals that live there.
- Commercial fish trawling and dredging have lasting impacts on the seabed and its habitats. These include altering seabed structure, damaging habitats, re-suspending sediment, removing species from food webs and disrupting marine populations (Clark et al, 2019, 2022a; MPI, 2023f).
- Between 1990 and 2021, about 11 percent of the exclusive economic zone and territorial seas were trawled. The area trawled each year has been declining over time and was 74,500 square kilometres in 2021 (MPI, 2023f). Methods have also improved in recent years to reduce contact with the seabed, in both deepwater and inshore fisheries (MacGibbon et al, 2024).
- Seamounts, knolls and hills are underwater areas of high productivity and biodiversity that are targeted by some deepwater fisheries (Clark et al, 2019, 2022b). Seamount recovery from trawling is slow: it took about two decades for the first signs of potential benthic (seafloor) community recovery to appear after trawling ceased on the Graveyard Knolls of the Chatham Rise (Clark et al, 2022a).
- Thirteen percent of seamounts, knolls and hills in New Zealand’s exclusive economic zone and territorial seas were trawled at least once between 1989 and 2019 (Clark et al, 2022b).
Aquaculture is a growing sector with positive and negative effects on marine ecosystems.
- The growing aquaculture industry, which includes species like green-lipped mussels, Chinook salmon and Pacific oysters, can have both positive and negative impacts on marine ecosystems (Howarth & Major, 2023; MPI, 2013).
- Mussel farming, for example, can support seafloor communities and some wild fish. However, it can lead to local enrichment of the seabed, and alters the composition of sediments (Howarth & Major, 2023; Underwood et al, 2023). Farm infrastructure can disrupt currents, damage the seabed, shade the seafloor and pose entanglement risks to wildlife (Howarth & Major, 2023; MPI, 2013).
Climate change and our marine environment
The ocean is becoming warmer and more acidic due to climate change, with impacts on marine ecosystems.
- Global oceans have captured nearly 25 percent of total human carbon emissions since industrialisation (Friedlingstein et al, 2020). This is making the ocean more acidic. Surface ocean acidity is estimated to have increased by almost 30 percent from 1750 to 2000 (Jiang et al, 2023). Acidity increased 8.6 percent in subantarctic surface water off the coast of Otago between 1998 and 2020 (see indicator: Ocean acidification).
- Oceans have also captured 90 percent of the excess heat from greenhouse gas emissions, increasing the ocean temperatures (Venegas et al, 2023).
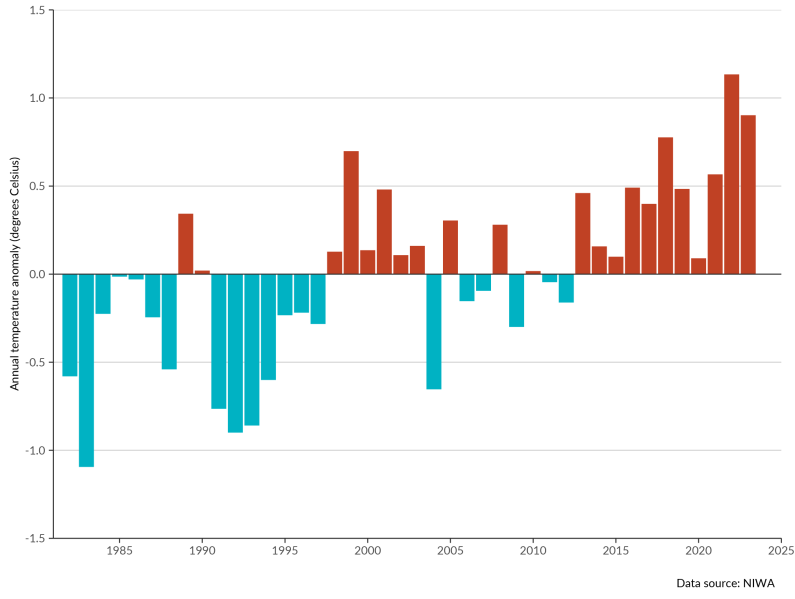
- Between 1982 and 2023, sea-surface temperature in the country’s oceanic regions increased an average of 0.16 to 0.26 degrees Celsius per decade, and in coastal regions an average of 0.19 to 0.34 degrees per decade (figure 5) (see indicator: Sea-surface temperature: Data to 2023).
- Marine heatwaves have become more frequent, intense and longer-lasting, including in New Zealand (Montie et al, 2024; Sun et al, 2023). In 2022, New Zealand experienced a record number of marine heatwave days, and the two longest and most intense marine heatwaves on record in some locations (Salinger et al, 2023; Shears et al, 2024). These trends are expected to continue (Behrens et al, 2022; Bodeker et al, 2022; Sun et al, 2023).
- Marine heatwaves have caused declines and local extinctions of some populations of ocean species. Warmer sea-surface temperatures and ocean acidification alter habitats, and affect the food supply and the growth and life cycles of native marine species, including treasured (taonga) species. This intensifies other pressures such as invasive species and human disturbances (see section 6: Atmosphere and climate).
Warmer seas are accelerating sea-level rise.
- Increasing ocean temperatures cause the water to expand (Venegas et al, 2023). Combined with melting glaciers and ice sheets, this contributes to sea-level rise (Lindsey & Dahlman, 2023; Venegas et al, 2023). Global mean sea level has risen 21–24 centimetres since 1880, and is projected to rise to 0.3–1.0 metres above 2000 levels by 2100 under a low emissions scenario (Grandey et al, 2024; Lindsey, 2023).
- Annual mean coastal sea levels rose faster (relative to land) at four longer-term monitoring sites around New Zealand between 1961 and 2020 when compared with 1901–60. This rate is accelerating – the mean rate of rise between 1961 and 2020 was double that between 1901 and 1960 at three of the four sites (see indicator: Coastal sea-level rise).
- In New Zealand, sea levels relative to land are rising faster in some areas due to downwards land movement. Sea level in those areas is expected to rise 20 to 30 centimetres by 2050 compared with 2005 levels. For many parts of the country, a 30-centimetre rise is a threshold for extreme flooding, above which a 100-year coastal storm becomes an annual event (MfE, 2024g; NZ SeaRise, nd) (see section 7: Impacts on people, society and the economy).
Figure 5: Coastal sea-surface temperature annual average anomaly, 1982–2023
Our marine environment is made up of diverse habitats. These include estuaries, rocky reefs and shores, fiords and seamounts, and open and deep-water habitats. Knowledge of marine habitats and their distribution is limited in New Zealand (Anderson et al, 2019; Lundquist et al, 2024).
These habitats support a large number of native animals and plants, many of them threatened or at risk of becoming threatened with extinction. The spread of non-native species can also contribute to the decline of native species and changes to habitats.
The effects of climate change are intensifying many of the pressures on marine ecosystems; these are discussed in section 6: Atmosphere and climate.
Our indigenous marine species and habitats are under threat
Most indigenous marine bird species are threatened with extinction or at risk of becoming threatened; however, most are estimated to have stable or increasing populations.
- In 2021, 91 percent of indigenous marine bird species (82 of 90) were threatened with extinction or at risk of becoming threatened, including 16 species identified as treasured (taonga) (figure 6). Estimated population trends show 27 percent of species have decreasing populations, 18 percent increasing, 12 percent stable or increasing, and 43 percent stable (see indicator: Extinction threat to indigenous species).
- In 2019, 22 percent of indigenous marine mammal species (10 of 49) were threatened with extinction or at risk of becoming threatened, including seven species identified as taonga (figure 6). Estimated population trends show 13 percent of species have decreasing populations and 2 percent have increasing populations (see indicator: Extinction threat to indigenous species).
- In 2016, 9 percent of shark, ray and chimaera species (10 of 107) were threatened with extinction or at risk of becoming threatened, including one species identified as taonga (figure 6). Estimated population trends show 2 percent of species have increasing populations and 1 percent have decreasing populations (see indicator: Extinction threat to indigenous species and Technical annex).
- In 2021, 56 percent of assessed indigenous marine invertebrate species (443 of 786) were threatened with extinction or at risk of becoming threatened. Estimated population trends show 5 percent of assessed species have decreasing populations, 66 percent stable, and one species increasing6 (Funnel et al, 2024; see Technical annex).
6 Note that only some known species of marine invertebrates have been assessed for extinction threat status and estimated population trends
Figure 6: Extinction threat to indigenous marine species7
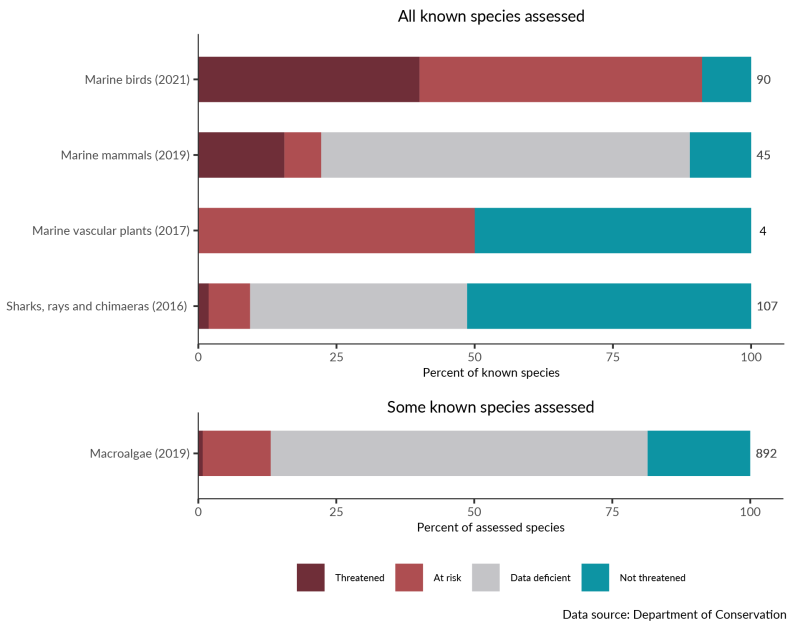
7 Note that extinction threat information updated since the Extinction threat to indigenous species indicator update in 2023 has been included in the text and is based on New Zealand Threat Classification System data downloads (see Technical annex; NZTCS, 2025). Figure is based only on information available in the indicator (see indicator: Extinction threat to indigenous species).
More non-native species are in our marine waters and are spreading to new locations.
- Non-native marine species are being introduced continually, usually carried by ballast water or on the hulls of shipping and recreational vessels (see indicator: Marine non-indigenous species: Data to 2022; Davis & Hepburn, 2020). Several biosecurity measures are in place to prevent non-native species from entering New Zealand and to detect, remove or control these species early (Marine Biosecurity Porthole, nd; MPI, nd-c).
- Non-native marine species can spread quickly and compete with native species. This can result in the decline of native species and changes to habitat. There is also a risk that pathogens could be introduced that may threaten native species, aquaculture or human health (Lane et al, 2022; see Our marine environment 2022).
- As of 2022, a total of 428 non-native marine species had been found in marine waters around New Zealand; 266 (62 percent) have established populations here. Seventy-three new non-native species were found between 2010 and 2022, 44 of which have become established (see indicator: Marine non-indigenous species: Data to 2022).
- In 2021, two exotic sea mustard species, Caulerpa brachypus and Caulerpa parvifolia, were discovered on Aotea Great Barrier Island (see indicator: Marine non-indigenous species: Data to 2022). By August 2024 they had spread to over 1,500 hectares of the upper North Island seabed, competing with other species, disrupting local ecosystems and posing risks to recreational, cultural and commercial marine activities (MPI, 2024d).
Few biogenic and coastal ecosystems are monitored, but data suggest they are experiencing loss or damage.
- Biogenic habitats are those formed by plants and animals. They support biodiversity, stabilise sediments, recycle nutrients, and have cultural, recreational and economic value. Examples include kelp forests, seagrass meadows and sponge gardens (Anderson et al, 2019).
- Few biogenic habitats are monitored in New Zealand, but most that are have experienced loss or damage (Anderson et al, 2019; Bennion et al, 2024; Morrison et al, 2014).
- Mangrove forests are one of the few biogenic habitats that have increased in extent (Anderson et al, 2019; Jones et al, 2022; Morrison et al, 2014). Seagrass meadows are also showing sign of recovery in some locations in recent decades (Lundquist et al, 2018).
- Native vegetation, wetlands and dunes on and near the coast help protect coastal ecosystems from excess sedimentation, nutrient pollution and sea-level rise, among other benefits (Allan et al, 2023; Thompson, 2022).
- Between 1950 and 2008, active sand dune extent decreased 80 percent (see indicator: Active sand dune extent). Remaining active dunes are increasingly threatened by introduced marram grass (Ammophila arenaria). This, coupled with grazing, land development and erosion, degrades the integrity and function of dune ecosystems (Thompson, 2022; see Our land 2024).

4. Marine
April 2025
© Ministry for the Environment