Our freshwater 2023

Our freshwater 2023 examines the most pressing issues in our freshwater environment.
The report is produced jointly by the Ministry for the Environment and Stats NZ.
Our freshwater 2023 examines the most pressing issues in our freshwater environment.
The report is produced jointly by the Ministry for the Environment and Stats NZ.
Alongside the Our freshwater 2023 report, the Ministry has also used the digital storytelling platform ESRI StoryMaps to look at some of the issues.
Navigating our freshwater environment considers what’s going on in our lakes, rivers and groundwater from the perspective of tuna (longfin eels), a taonga species found only in New Zealand.
The StoryMap examines the challenges facing tuna throughout their lives as travel ki uta ki tai (mountains to sea) – and how those challenges affect the freshwater ecosystem, people and communities.
Aotearoa New Zealand’s freshwater environment supports all aspects of our lives, and we share an intimate and innate connection with it. It is central to wellbeing, supporting our economy, recreation, and gathering food. For many Māori, the freshwater environment is central to tikanga Māori (customs/protocols), mātauranga Māori (Māori knowledge), and mahinga kai (traditional food gathering practices).
Despite this, our freshwater environment is under pressure from our activities on the land and in the water, and from a changing climate. While some of our freshwater bodies are in a reasonably healthy state, many have been degraded by the effects of excess nutrients, pathogens, and other contaminants from land.
Most of our indigenous freshwater fish and freshwater bird species, including some taonga (treasured) species, are either threatened with extinction or at risk of becoming threatened. The effects of our historic and contemporary activities on our freshwater environment have impacts on many of the things we value as individuals, communities, and as a nation, such as our iconic and taonga species and being able to swim and practice mahinga kai without risk of illness.
This report has been produced at a particularly poignant time, in the immediate aftermath and initial recovery from a number of severe weather events, notably, Cyclone Gabrielle. The effects of these events have made the combined pressures of climate change, land use, and human modifications to waterways more evident than ever before.
While this report covers these pressures and impacts, it does not discuss them in the context of recent severe weather events. Reporting on topics requires an understanding that is grounded in robust data and validated research, and scientific evidence is only beginning to emerge for these events. As new evidence and research about these events is published, it will be available to inform future reports.
Indicators presented in this report alongside the research literature are based on the best available science and highlight the issues facing the freshwater environment. Ongoing monitoring and advancing research have improved our understanding of these issues, but there are still gaps in our knowledge. This is primarily owing to the challenge presented by the scale and diversity of the freshwater environment, and by the complexity of interactions between land-based pressures and their impacts on freshwater. These and other issues are discussed in the Data and research gaps section.
Our freshwater 2023 is the latest in a series of environmental reports produced by the Ministry for the Environment and Stats NZ. It is the third report in the series dedicated to the freshwater environment, following the 2017 and 2020 reports, and is part of the third cycle of reports released under the Environmental Reporting Act 2015 [Legislation].
In 2019 the Parliamentary Commissioner for the Environment (PCE) released his report, Focusing Aotearoa New Zealand’s environmental reporting system (PCE, 2019). The report identified how the environmental reporting system can be improved, and recommended changes to the system and amendments to the Environmental Reporting Act. Implementation of these changes is in progress and will provide a stronger foundation to ensure we better understand te taiao (the environment) and the impacts people are having on it.
Our freshwater 2023 continues the scaled-back format for environmental reports first signalled in Our air 2021, making information available while we progress the fundamental changes needed to improve the reporting system to align with recommendations from the PCE (PCE, 2019). This is an information-oriented release, with the primary focus on recent information about the freshwater environment. This report brings current freshwater indicators together with what we know from past reports and insights from the research literature. Interactive graphs and maps can be found on the Stats NZ website (see links to indicator web pages throughout this report).

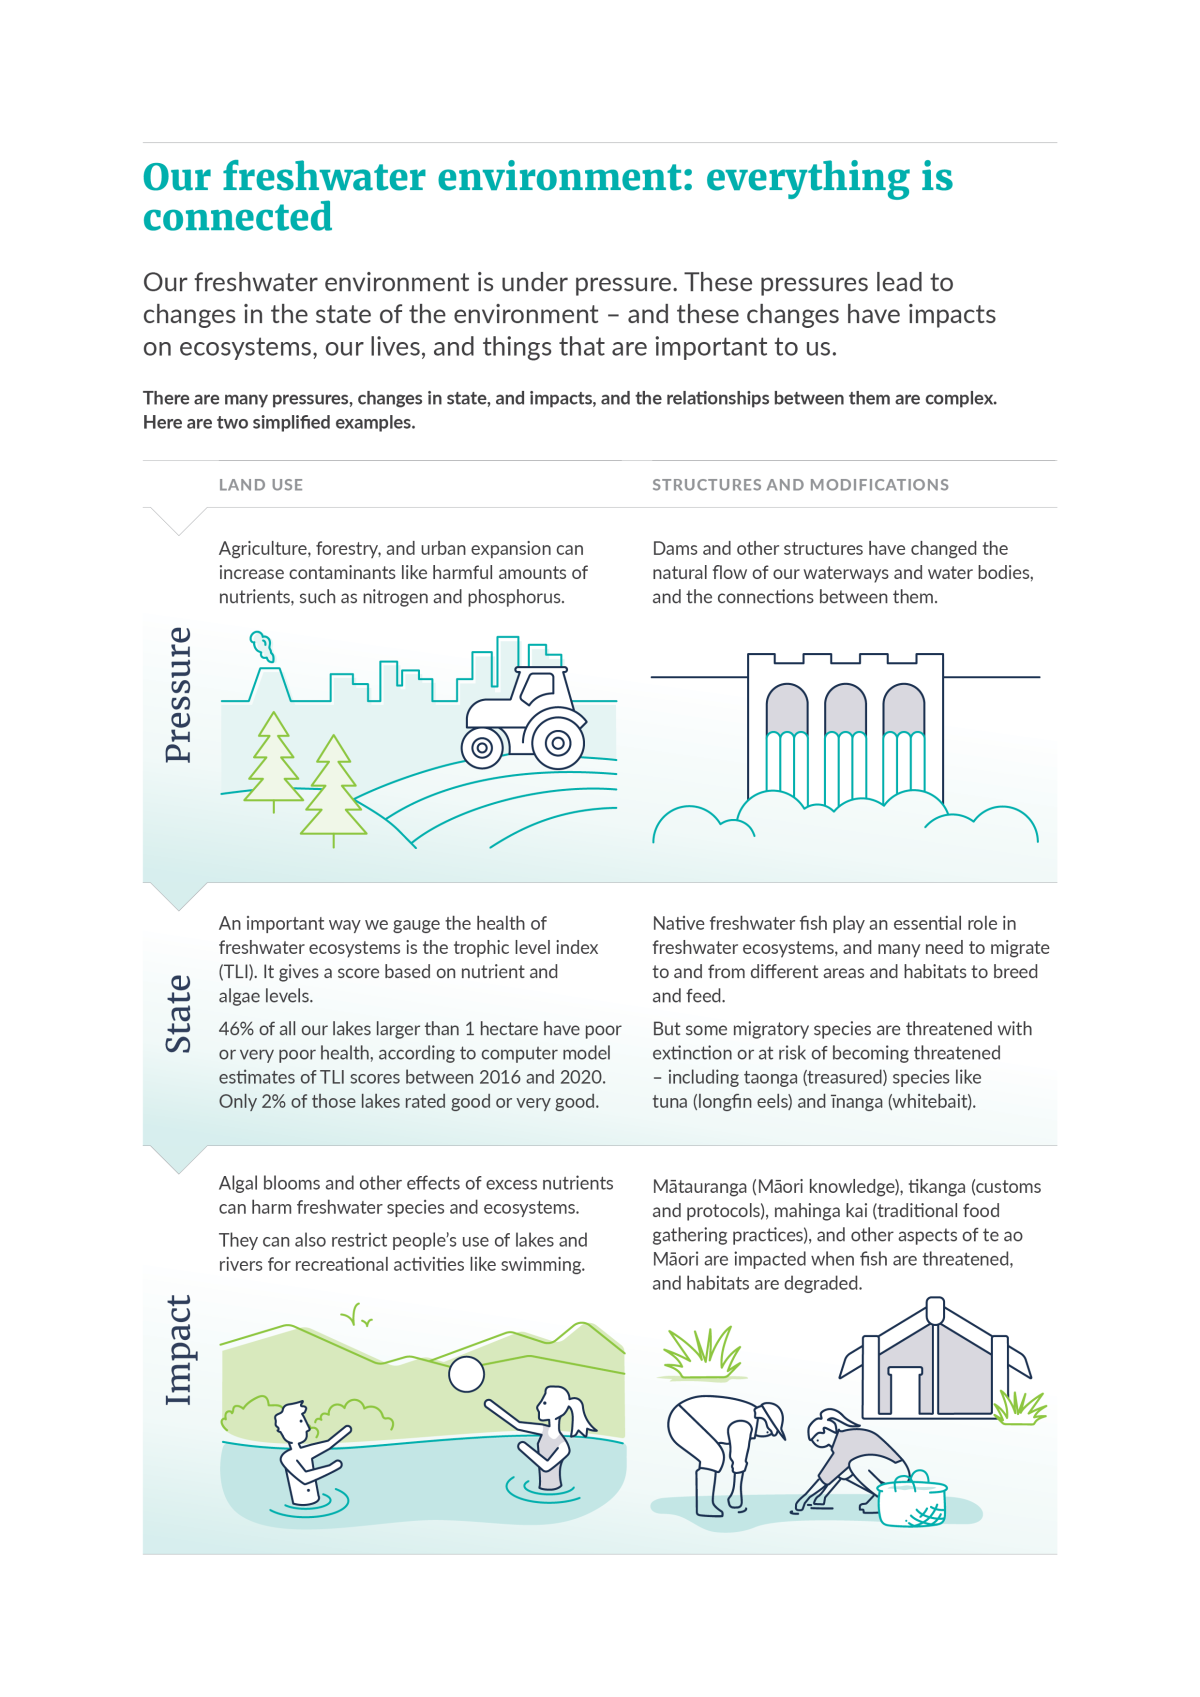
This infographic states our freshwater environment is under pressure. These pressures lead to changes in the state of the environment – and these changes have impacts on ecosystems, our lives, and things that are important to us.
|
|
LAND USE |
STRUCTURES AND MODIFICATIONS |
|
Pressure |
Agriculture, forestry, and urban expansion can increase contaminants like harmful amounts of nutrients, such as nitrogen and phosphorus. |
Dams and other structures have changed the natural flow of our waterways and water bodies, and the connections between them. |
|
State |
An important way we gauge the health of freshwater ecosystems is the trophic level index (TLI). It gives a score based on nutrient and algae levels. 46% of all our lakes larger than 1 hectare have poor or very poor health, according to computer model estimates of TLI scores between 2016 and 2020. Only 2% of those lakes rated good or very good. |
Native freshwater fish play an essential role in freshwater ecosystems, and many need to migrate to and from different areas and habitats to breed and feed. But some migratory species are threatened with extinction or at risk of becoming threatened – including taonga (treasured) species like tuna (longfin eels) and īnanga (whitebait). |
|
Impact |
Algal blooms and other effects of excess nutrients can harm freshwater species and ecosystems. They can also restrict people’s use of lakes and rivers for recreational activities like swimming. |
Mātauranga (Māori knowledge), tikanga (customs and protocols), mahinga kai (traditional food gathering and harvesting), and other aspects of te ao Māori are impacted when fish are threatened, and habitats are degraded. |
As required by the Act, we use pressure, state, and impact to report on the environment and this forms the basis for the report’s structure. The logic of the framework is that pressures cause changes to the state of the environment and these changes may have impacts on our values.
The report describes impacts on freshwater species and ecosystems, infrastructure, culture, economy, public health, and recreation. In addition, it explores our connections to the freshwater environment to the extent that is possible with the available information and identifies information gaps. Note that evaluation of specific policy is out of scope for environmental reporting releases under the Environmental Reporting Act 2015, so are not discussed here.
This report also continues discussions of wellbeing that were the focus of the last synthesis report, Environment Aotearoa 2022. The concepts of wellbeing that support this report include, among others, the Treasury’s Living Standards Framework, the He Ara Waiora framework, and the view that our economic and non-economic wellbeing are inherently connected to te taiao (McMeeking et al, 2019; New Zealand Treasury –Te Tai Ōhanga, 2021; PCE, 2021). For further discussion connecting wellbeing with te taiao, see Environment Aotearoa 2022.
The data used in this report came from many sources including Crown research institutes and central and local government. Further supporting information was provided using a ‘body of evidence’ approach. This body of evidence includes peer reviewed, published literature, as well as mātauranga Māori and observational tools used to identify changes in the freshwater environment.
All data used in this report, including references to scientific literature, were corroborated, and checked for consistency with the original source. The report was produced by a team of analysts and scientists from within and outside of the Ministry for the Environment and Stats NZ, and was reviewed by a panel of independent scientists. The indicators related to the freshwater environment and the date they were last updated are available on the Stats NZ indicators web pages [Stats NZ].
Wai (water) is essential for life. It sustains, cleanses, and refreshes our bodies and provides opportunities for recreation. Wai supports how we live. Freshwater appears in many forms, from tiny alpine streams and puna (springs) to large roto (lakes), repo (wetlands), and the widest awa (rivers). It is also present but unseen in underground rivers and aquifers.
In te ao Māori (Māori world view), the human and non-human worlds are indivisible. Different water bodies have different associated taonga species, and kaitiaki (guardians), that protect the mauri of the wai (Stewart‑Harawira, 2020).
Mauri is a te ao Māori concept that describes the spark of life and active component of that life (Mead, 2003), and the binding force that holds together the physical and spiritual components of a being or thing (Durie, 1998; Morgan, 2006).
There is an intrinsic link between the health and wellbeing of wai and the health and wellbeing of communities (Harmsworth & Awatere, 2013; Stewart-Harawira, 2020). When the mauri of the freshwater environment is negatively affected this can affect the cultural, spiritual, and physical wellbeing of communities. Mauri has been used by many scientists to describe state and sustainability of a particular environment and indicators have been created to assist this (Morgan, 2006) (see: Environment Aotearoa 2022).
In te ao Māori there are many pūrākau (stories) about the origins of our freshwater systems, each with its own whakapapa (genealogy) to describe their relationships to these important waterways. Wainui‑ātea is personified as the mighty waters and through her the other bodies of water are connected (Whaanga & Roa, 2021). After their separation, the soft mists of Papatūānuku (Earth mother) rise to greet Ranginui (sky father), and Ranginui’s tears took the visible form of rain and dew that fall from the sky to give life to the land (Salmond et al, 2019; Reed, 2021). This highlights the holistic connection of water in the atmosphere, in groundwater, and on land. Our previous synthesis report, Environment Aotearoa 2022, framed the freshwater domain with Waitī. She is the whetū (star) in Te Kāhui o Matariki (the Matariki cluster) who is connected to the freshwater environment (see Environment Aotearoa 2022).
Taonga species are endemic to Aotearoa New Zealand (found nowhere else in the world) and significant to Māori, being unquestionably treasured. Taonga species vary among whānau, hapū, and iwi: this can be due to whakapapa connection and identified kaitiaki responsibilities. They are also connected to traditional Māori practices and knowledge (Waitangi Tribunal, 2011). Taonga species names can also vary according to their life-cycle stage, iwi and hapū dialect, and within different regions. Taonga species represent symbols of status, association with death, tohu (signs), predictions of weather, metaphors, and stories (Keane‑Tuala, 2015).
This publication was updated in October 2024 to correct a typo on page 25. The sentence 'Approximately 440 million cubic metres flows in our rivers and streams every year (Collins et al, 2015)' has been changed to 'Approximately 440 billion cubic metres flows in our rivers and streams every year (Collins et al, 2015)'.
Image: Kiwi Droneography – truestock
Our freshwater environment is an interconnected system and is affected by many pressures from human activities.
Land-based activities in catchments have detrimental effects on freshwater through excess sediment, nutrient, and contaminant pollution, and these pressures have been amplified by the intensification and expansion of agriculture and urbanisation.
Diverting, controlling, and abstracting water from our waterways alters the natural flow and resilience of waterways ki uta ki tai – from mountains to the sea – and places pressure on species.
Increases in greenhouse gas emissions are raising sea levels at our coasts and increasing the magnitude and frequency of extreme rainfall and drought, which puts further pressure on the freshwater environment.
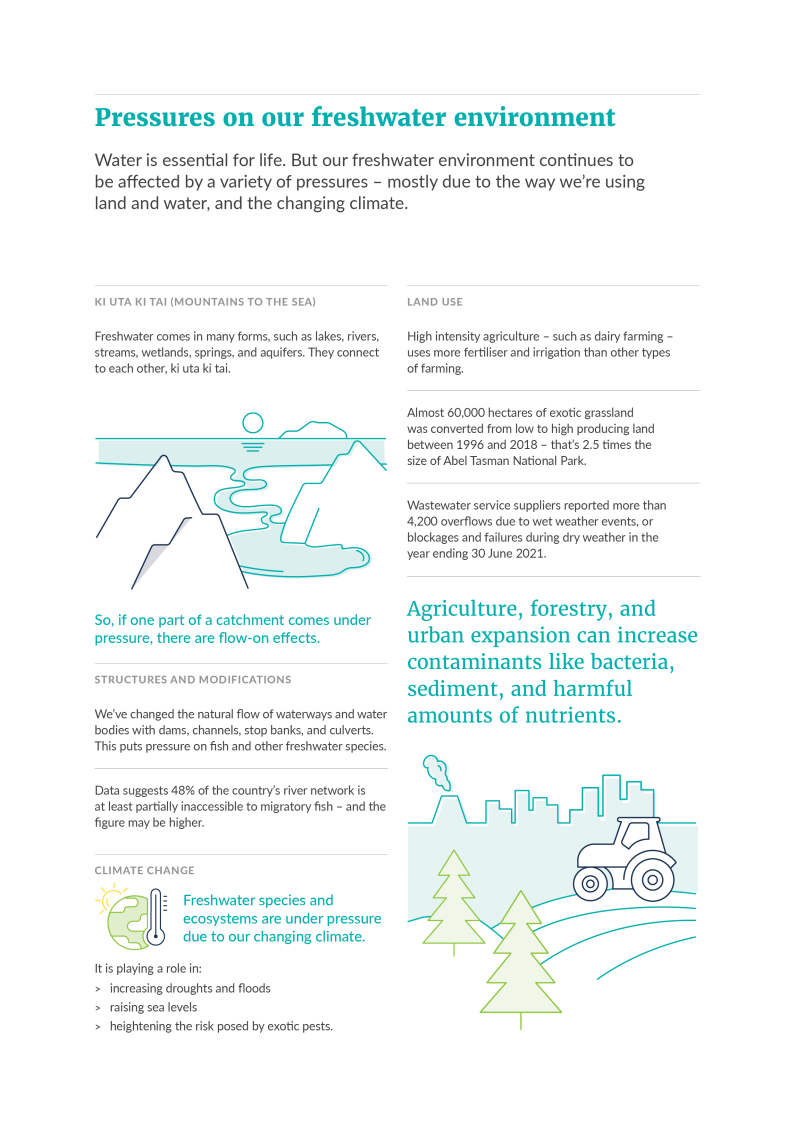
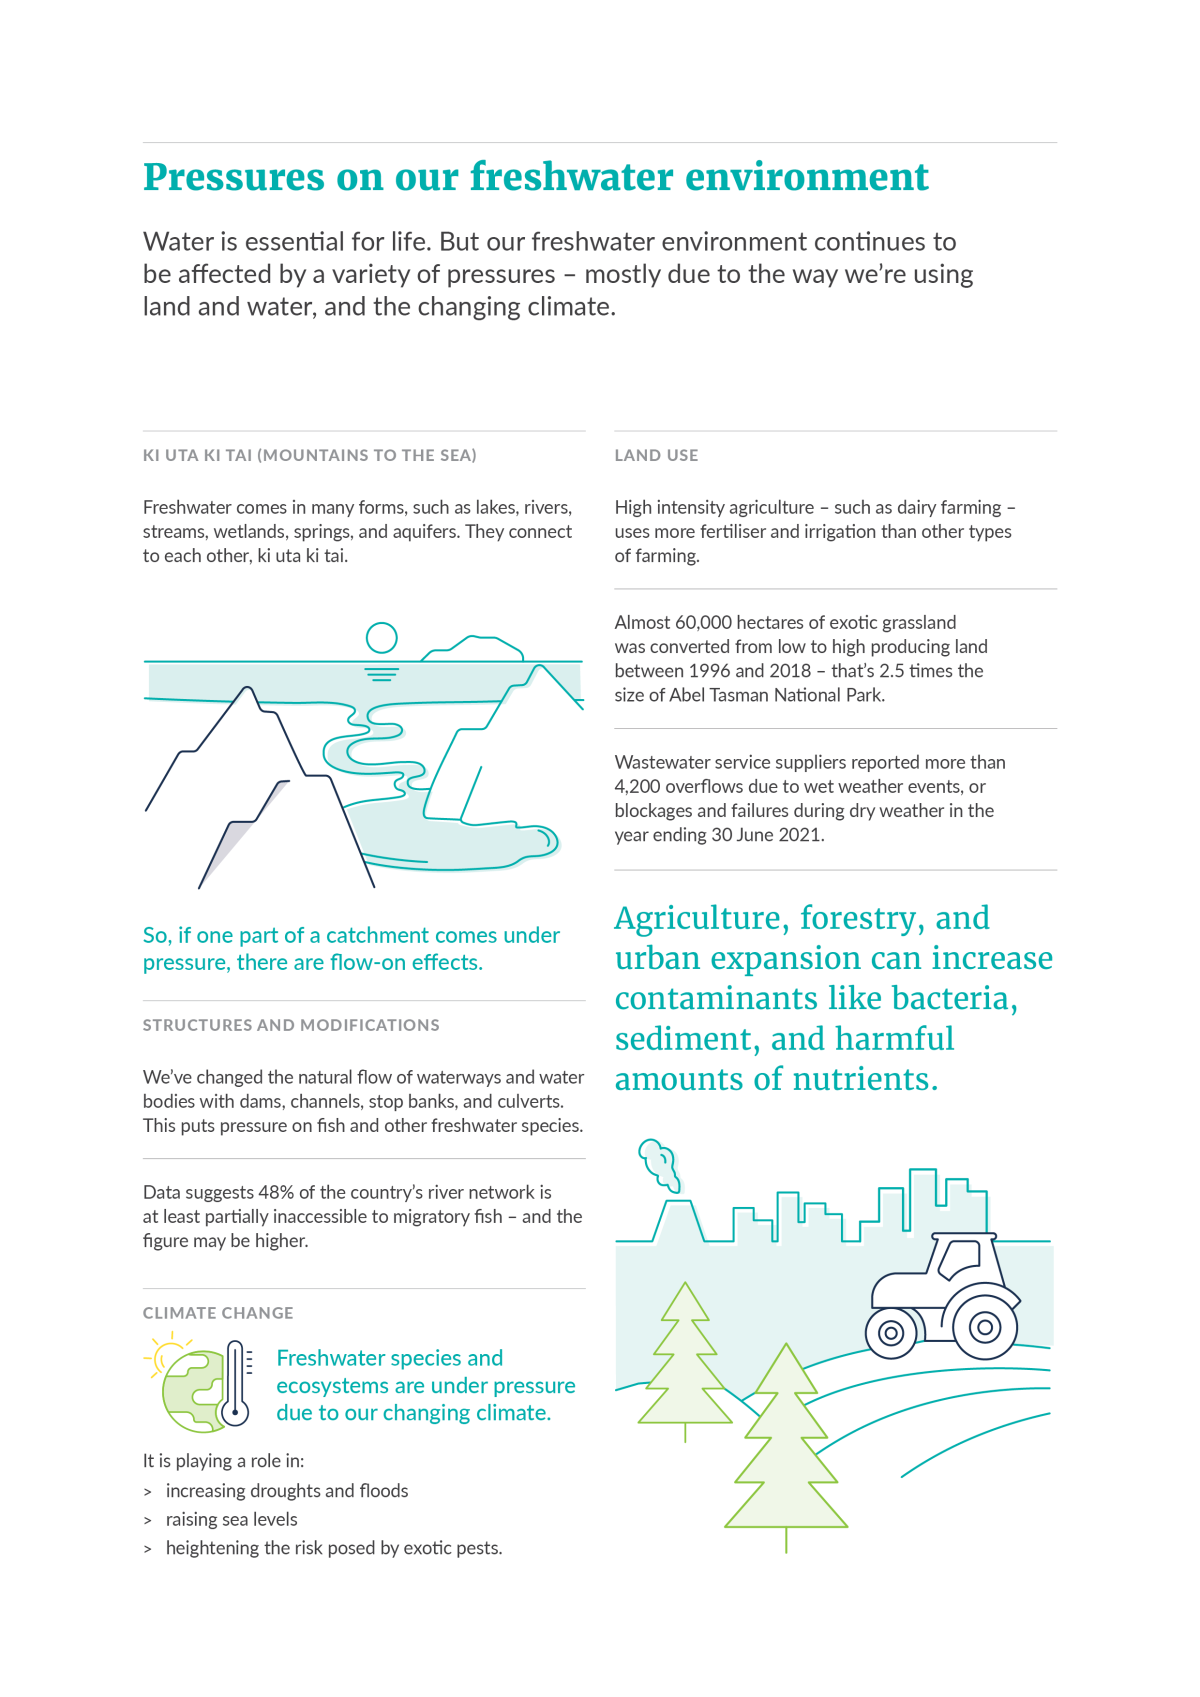
This infographic states water is essential for life. But our freshwater environment continues to be affected by a variety of pressures – mostly due to the way we’re using land and water, and the changing climate.
Ki uta ki tai (mountains to the sea)
Freshwater comes in many forms, such as lakes, rivers, streams, wetlands, springs, and aquifers. They connect to each other, ki uta ki tai.
So, if one part of a catchment comes under pressure, there are flow-on effects.
Structures and modifications
We’ve changed the natural flow of waterways and water bodies with dams, channels, stop banks, and culverts. This puts pressure on fish and other freshwater species.
Data suggests 48% of the country’s river network is at least partially inaccessible to migratory fish – and the figure may be higher.
Climate change
Freshwater species and ecosystems are under pressure due to our changing climate.
It is playing a role in:
Land use
High intensity agriculture – such as dairy farming – uses more fertiliser and irrigation than other types of farming.
60,000 hectares of exotic grassland was converted from low to high producing land between 1996 and 2018 – that’s 2.5 times the size of Abel Tasman National Park.
Wastewater service suppliers reported more than 4,200 overflows due to wet weather events, or blockages and failures during dry weather in the year ending 30 June 2021.
Agriculture, forestry, and urban expansion can increase contaminants like bacteria, sediment, and harmful amounts of nutrients.
Image: Wellington Regional Council
To understand the health of our freshwater ecosystems we need to understand how they connect to each other and to the land: ki uta ki tai (mountains to the sea). There is an intrinsic link between the health and wellbeing of wai (water) and the health and wellbeing of communities. When wai is healthy and flowing, and ecosystem health is intact, mauri is enhanced and it can better provide for our interaction with freshwater, such as mahinga kai (traditional food gathering practices), swimming, and drinking water.
Mātauranga Māori (Māori knowledge) and the freshwater ecosystem health framework help us understand what different freshwater indicators tell us about the overall health of freshwater bodies and the environment.
These indicators show that the health of our freshwater ecosystems is variable around Aotearoa. High levels of organic pollution and nutrient enrichment in many of our rivers and lakes has degraded habitats and can be harmful to freshwater species. Some of our freshwater is unsuitable for swimming and drinking.
Aotearoa has a lot of freshwater, though we also use a lot for activities such as irrigation and hydroelectricity.
Modifications to our freshwater environment have caused the ongoing loss of wetlands, and this reduces the habitat available for our freshwater-dependent native species. Altering flows diminishes the mauri of our awa (river).
Some of our indigenous taonga (treasured) freshwater species, such as kanakana/piharau (lamprey) and kākahi (freshwater mussel), are threatened with extinction and many others are at risk of becoming threatened.
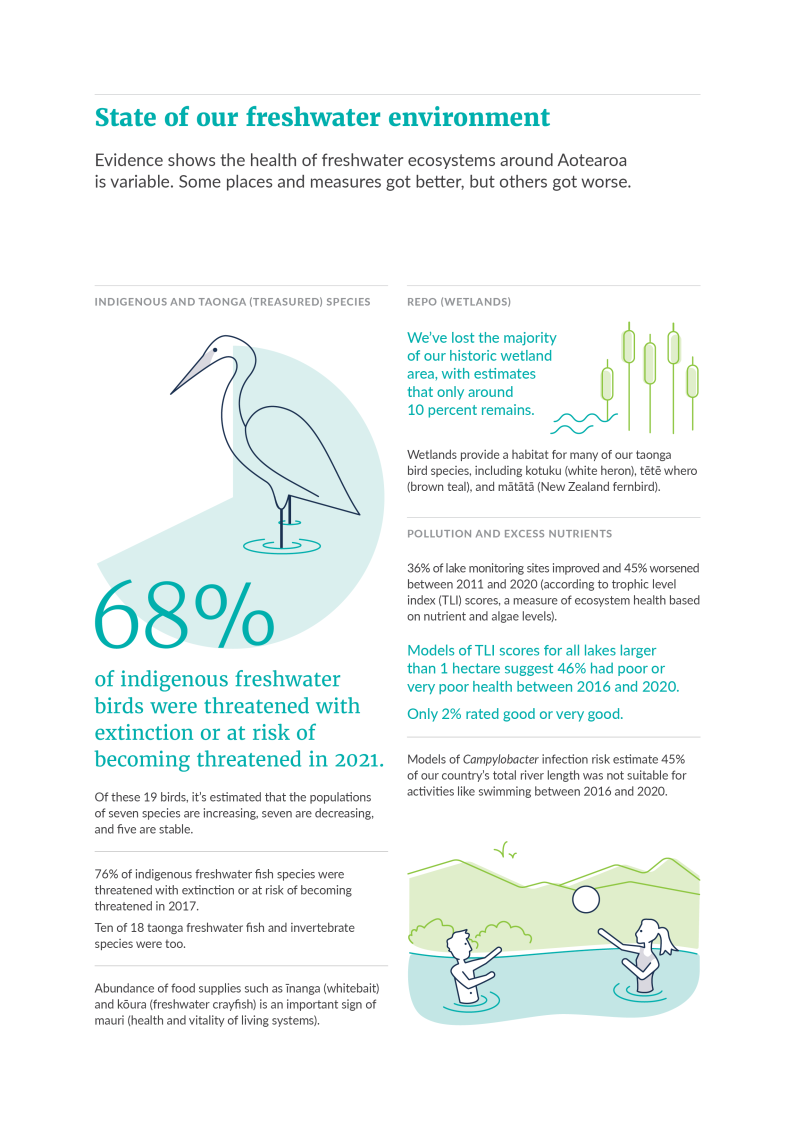
Evidence shows the health of freshwater ecosystems around Aotearoa is variable. Some places and measures got better, but others got worse.
Indigenous and taonga (treasured) species
68% of freshwater birds were threatened with extinction or at risk of becoming threatened in 2021.
Of these 19 birds, it’s estimated that the populations of seven species are increasing, seven are decreasing, and five are stable.
76% of indigenous freshwater fish species were threatened with extinction or at risk of becoming threatened in 2017.
Ten of 18 taonga freshwater fish and invertebrate species were too.
Abundance of food supplies such as īnanga (whitebait) and kōura (freshwater crayfish) is an important sign of mauri (health and vitality of living systems).
Repo (wetlands)
We’ve lost the majority of our historic wetland area, with estimates that only around 10 percent remains.
Wetlands provide a habitat for many of our taonga bird species, including kotuku (white heron), tētē whero (brown teal), and mātātā (New Zealand fernbird).
Pollution and excess nutrients
36% of lake monitoring sites improved and 45% worsened between 2011 and 2020 (according to trophic level index (TLI) scores, a measure of ecosystem health based on nutrient and algae levels).
Models of TLI scores for all lakes larger than 1 hectare suggest 46% had poor or very poor health between 2016 and 2020.
Only 2% rated good or very good.
Models of Campylobacter infection risk estimate 45% of our country’s total river length was not suitable for activities like swimming between 2016 and 2020.
1 The Groundwater quality indicator is scheduled to be updated pending the outcome of an independent methodological review, which is in progress.
Image: Fraser Tebbutt – truestock
The state of the freshwater environment has impacts on freshwater species, habitats, ecosystems, and people. The health of freshwater environments and ecosystems directly support tikanga (customs/protocols), mahinga kai (traditional food gathering practices), and the transmission of mātauranga Māori (Māori knowledge). Our wellbeing and economy are linked to a healthy freshwater environment.
Excess nutrients can cause algal blooms that reduce visibility and the availability of oxygen, having ecosystem-wide impacts. Excess sediment degrades freshwater habitats, and other contaminants contaminate filter feeding organisms.
The forecasted effects of human-induced climate change, such as changes in water temperature, are likely to change the range and life cycles of some species. Contamination of swimming and water recreation areas and drinking water sources with waterborne diseases and other contaminants can pose a risk to public health.
Our primary production, tourism, and hydroelectricity sectors rely on a plentiful supply of freshwater, but we do not have a complete national picture of how much freshwater we use. This makes it difficult to assess the sustainability of our water use.
This infographic states pressures on freshwater and changes to it are affecting the environment, our lives, and things that are important to us.
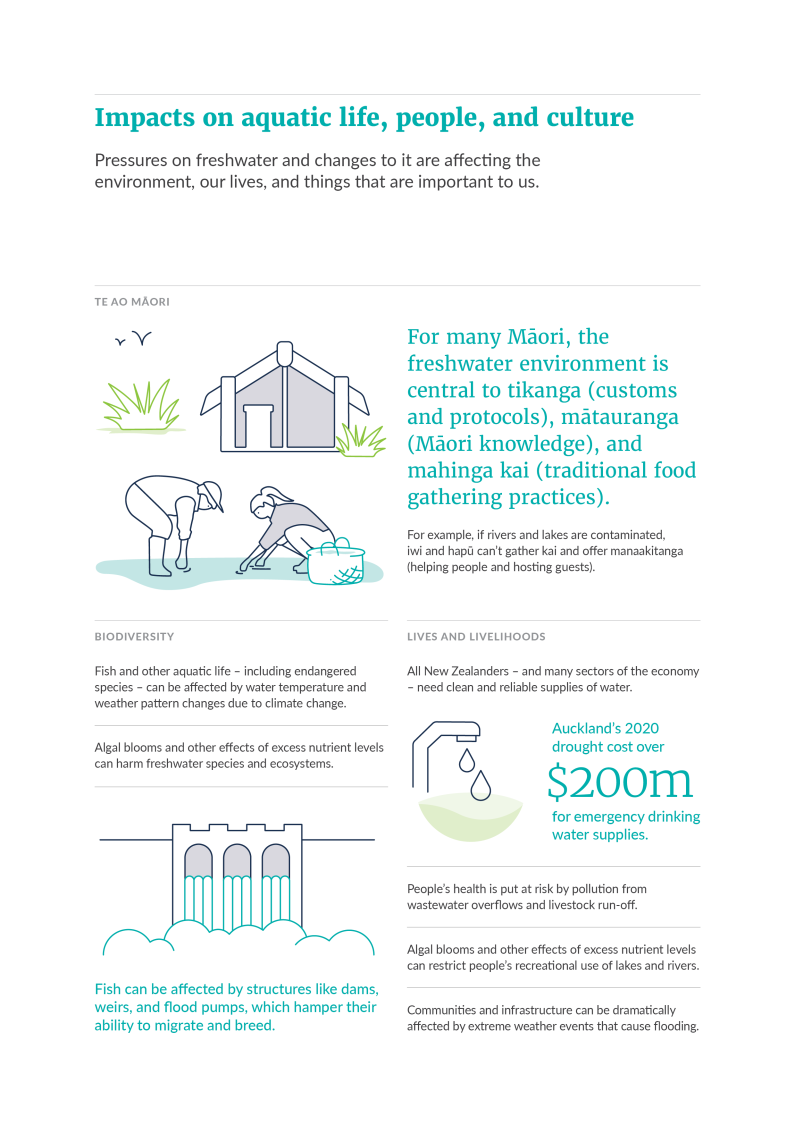
Te ao Māori
For many Māori, the freshwater environment is central to tikanga (customs and protocols), mātauranga (Māori knowledge), and mahinga kai (traditional food gathering and harvesting).
For example, if rivers and lakes are contaminated, iwi and hapū can’t gather kai and offer manaakitanga (helping people and hosting guests).
Biodiversity
Fish and other aquatic life – including endangered species – can be affected by water temperature and weather pattern changes due to climate change.
Algal blooms and other effects of excess nutrient levels can harm freshwater species and ecosystems.
Fish can be affected by structures like dams, weirs, and flood pumps, which hamper their ability to migrate and breed.
Lives and livelihoods
All New Zealanders – and many sectors of the economy – need clean and reliable supplies of water.
Auckland’s 2020 drought cost over $200m for emergency drinking water supplies.
People’s health is put at risk by pollution from wastewater overflows and livestock run-off.
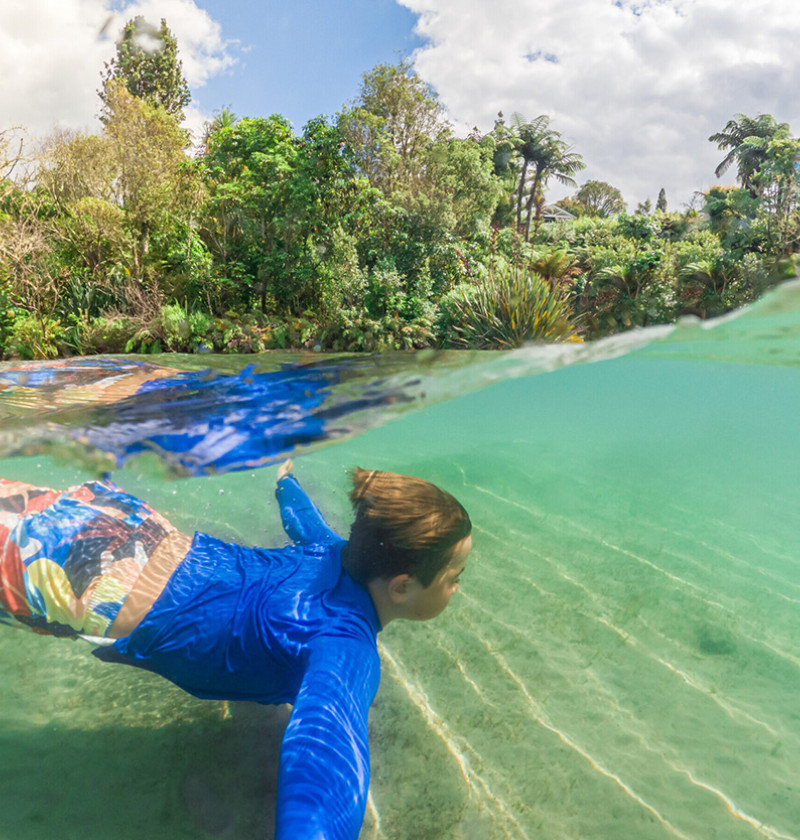
Algal blooms and other effects of excess nutrient levels can restrict people’s recreational use of lakes and rivers.
Communities and infrastructure can be dramatically affected by extreme weather events that cause flooding.

This infographic states pressures on freshwater and changes to it are affecting the environment, our lives, and things that are important to us.
Te ao Māori
For many Māori, the freshwater environment is central to tikanga (customs and protocols), mātauranga (Māori knowledge), and mahinga kai (traditional food gathering and harvesting).
For example, if rivers and lakes are contaminated, iwi and hapū can’t gather kai and offer manaakitanga (helping people and hosting guests).
Biodiversity
Fish and other aquatic life – including endangered species – can be affected by water temperature and weather pattern changes due to climate change.
Algal blooms and other effects of excess nutrient levels can harm freshwater species and ecosystems.
Fish can be affected by structures like dams, weirs, and flood pumps, which hamper their ability to migrate and breed.
Lives and livelihoods
All New Zealanders – and many sectors of the economy – need clean and reliable supplies of water.
Auckland’s 2020 drought cost over $200m for emergency drinking water supplies.
People’s health is put at risk by pollution from wastewater overflows and livestock run-off.
Algal blooms and other effects of excess nutrient levels can restrict people’s recreational use of lakes and rivers.
Communities and infrastructure can be dramatically affected by extreme weather events that cause flooding.
Our freshwater environment is expansive, diverse and part of a highly interconnected system. As a result, the issues facing the freshwater domain are often complex and strongly linked to pressures occurring on the land. The time it takes for pressures, especially those on land, to be felt in the environment adds another layer of complexity. Understanding these dynamics is necessary to ensure the decisions we make now give us the best possible chance for ensuring that future generations benefit from a thriving freshwater environment.
Aotearoa New Zealand’s environmental monitoring and reporting system plays a key role in protecting te taiao (the environment), but our ability to report on the state of the environment depends on how well we collect and analyse data about it, and that needs improving.
Many of the issues identified by the Parliamentary Commissioner of the Environment in his 2019 system review still challenge current reporting. These issues are evident in the content of Our freshwater 2023: there continues to be gaps in data, inconsistencies in methods and monitoring, lack of accessibility, and a gap in elevating mātauranga Māori (Māori knowledge). Work is underway to establish a fit-for-purpose environmental monitoring and reporting system that is adaptable to future challenges.
The Ministry for the Environment in conjunction with sector partners, are embarking on a significant programme of work to reform the foundations of the system. This will include developing core indicators for monitoring our environment, designing the analytical architecture required to assess and interpret the data, and the blueprint design of a national monitoring network. Alongside this, our work on the Environment and Climate Research Strategy will provide future direction for prioritising investment in science and research as part of Te Ara Paerangi – Future Pathways [Ministry of Business, Innovation & Employment].
While this report has highlighted new evidence and research into the state of our freshwater environments since Our freshwater 2020, there are still critical gaps in our knowledge that need to be filled. These include:
The data used in Our freshwater 2023 is drawn from Our freshwater 2020 and Environment Aotearoa 2022 and the Stats NZ indicators that have featured in them. Listed below are the indicators that have been incorporated in this report, including one updated indicator in bold:
This report was compiled by the Ministry for the Environment and Stats NZ’s Environmental Reporting team.
We would like to thank the following for providing data and advice in the development of indicators used in this report:
Auckland Council; Bay of Plenty Regional Council; Cawthron Institute; Climate Research Unit at the University of East Anglia; Department of Conservation; Environment Canterbury; Environment Southland; Fertiliser Association of New Zealand; Gisborne District Council; GNS Science; Greater Wellington Regional Council; Hawke’s Bay Regional Council; Horizons Regional Council; John Hannah (Vision NZ Ltd); Land Information New Zealand (New Zealand Hydrographic Authority); Land Water People; Land, Air, Water Aotearoa; Manaaki Whenua – Landcare Research; Marlborough District Council; National Aeronautics and Space Administration; National Oceanic and Atmospheric Administration; Nelson City Council; NIWA; Northland Regional Council; Otago Regional Council; Rob Bell (Adapt Ltd); Taranaki Regional Council; Tasman District Council, Waikato Regional Council; West Coast Regional Council.
Olivier Ausseil, Aquanet Consulting
Roger Young, Cawthron Institute
Jane Kitson, Kitson Consulting
Tim Chambers, University of Otago
Marc Schallenberg, University of Otago
Alderton I, Palmer BR, Heinemann JA, Pattis I, Weaver L, Gutiérrez-Ginés MJ, Horswell J, & Tremblay LA. (2021). The role of emerging organic contaminants in the development of antimicrobial resistance. Emerging Contaminants [Science Direct], 7, 160–171.
Ausseil A-G, Lindsay Chadderton W, Gerbeaux P, Theo Stephens RT, & Leathwick JR. (2011). Applying systematic conservation planning principles to palustrine and inland saline wetlands of New Zealand. Freshwater Biology [Wiley Online Library], 56(1), 142–161.
Awatere S, King DN, Reid J, Williams L, Masters-Awatere B, Harris P, Tassell-Matamua N, Jones R, Eastwood K, Pirker J, & Jackson A-M. (2021). He huringa āhuarangi, he huringa ao: a changing climate, a changing world [Manaaki Whenua - Landcare Research].
Awatere S, Robb M, Taura Y, Reihana K, Harmsworth G, Te Maru J, & Watene-Rawiri E. (2018). Wai Ora Wai Māori – a kaupapa Māori assessment tool [Manaaki Whenua -Landcare Research].
Basher LR. (2013). Erosion processes and their control in New Zealand. In JR Dymond (Ed), Ecosystem Services in New Zealand: Conditions and Trends (pp 363–374). Manaaki Whenua – Landcare Research.
Basher, LR, Hicks, DM, Clapp, B, & Hewitt, T. (2011). Sediment yield response to large storm events and forest harvesting, Motueka River, New Zealand. New Zealand Journal of Marine and Freshwater Research, 45(3), 333–356.
Belletti B, Garcia de Leaniz C, Jones J, Bizzi S, Borger L, Segura G, Castelletti A, van de Bund W, Aarestrup K, Barry J, Belka K, Berkhuyse A, Birnie- Gauvin K, Bussettini M, Carolli M, Consuegra S, Dopico E, Feierfeil T, Fernandez S, … Zalewski, M. (2020). More than one million barriers fragment Europe's rivers. Nature, 588, 436–441.
Best Practice Advocacy Centre New Zealand (BPAC). (2020). Consider blue-green algal blooms this summer: Identifying and managing suspected cyanotoxin poisoning in primary care [bpacnz].
Boddy NC, Fraley KM, Warburton HJ, Jellyman PG, Booker DJ, Kelly D, & McIntosh AR. (2020). Big impacts from small abstractions: The effects of surface water abstraction on freshwater fish assemblages. Aquatic Conservation: Marine and Freshwater Ecosystems [Wiley Online Library], 30(1), 159–172.
Bodeker G, Cullen N, Katurji M, McDonald A, Morgenstern O, Noone D, Renwick J, Revell L, & Tait A. (2022). Aotearoa New Zealand climate change projections guidance.
Boehler S, Strecker R, Heinrich P, Prochazka E, Northcott GL, Ataria JM, Leusch FDL, Braunbeck T, & Tremblay LA. (2017). Assessment of urban stream sediment pollutants entering estuaries using chemical analysis and multiple bioassays to characterise biological activities. Science of the Total Environment, 593–594 [Science Direct], 498–507.
Booker DJ, & Henderson RD. (2019). National water allocation statistics for environmental reporting; 2018.
Brierley G, Fuller I, Williams G, Hikuroa D, & Tilley A. (2022). Re-Imagining Wild Rivers in Aotearoa New Zealand. Land [MDPI], 11(8).
Burdon FJ, McIntosh AR, & Harding JS. (2013). Habitat loss drives threshold response of benthic invertebrate communities to deposited sediment in agricultural streams. Ecological Applications 23(5) [ESA Journals], 1036–1047.
Camargo JA, & Alonso Á. (2006). Ecological and toxicological effects of inorganic nitrogen pollution in aquatic ecosystems: a global assessment. Environment International, 32, 831–849.
Cañedo-Argüelles, M, Kefford, BJ, Piscart, C, Prat, N, Schäfer, RB, & Schulz, CJ. (2013). Salinisation of rivers: An urgent ecological issue. Environmental Pollution [Science Direct], 173, 157–167.
Champion, P, Dugdale, T, & Taumoepeau A. (2002). The aquatic vegetation of 33 Northland lakes. In NIWA, Client Report no. NRC01203. (Issue May 2001).
Chapman, RB (2010). A review of insecticide use on pastures and forage crops in New Zealand [AgPest]. AgResearch, Christchurch, New Zealand.
Clapcott JE, Young RG, Sinner J, Wilcox M, Storey R, Quinn J, Daughney CJ, & Canning A. (2018). Freshwater biophysical ecosystem health framework. Cawthron Report No. 3194, 3194, 104.
Clapcott, JE, Young, RG, Harding, JS, Matthaei, CD, Quinn, JM, Death, RG. (2011). Sediment Assessment Methods: Protocols and guidelines for assessing the effects of deposited fine sediment on in-stream values. Nelson, New Zealand, Cawthron Institute.
Clarkson B, Ausseil A-G, & Gerbeaux P. (2013). Wetland ecosystem services. In JR Dymond (Ed), Ecosystem services in New Zealand – conditions and trends (pp 192–202) [Research Gate]. Manaaki Whenua Press.
Clayton, J, & Champion, P. (2006). Risk assessment method for submerged weeds in New Zealand hydroelectric lakes [Springer Link]. Hydrobiology, 570, 183–188.
Close ME, Humphries B, & Northcott G. (2021). Outcomes of the first combined national survey of pesticides and emerging organic contaminants (EOCs) in groundwater in New Zealand 2018. Science of the Total Environment [Science Direct], 754, 142005.
Collier, KJ, & Grainger, NPJ. (2015). New Zealand invasive fish management handbook. Lake Ecosystem Restoration New Zealand. Hamilton, New Zealand: The University of Waikato and Department of Conservation.
Collier K, Clearwater S, Harmsworth G, Taura Y, & Reihana K. (2017). Physical and chemical attributes affecting survival and collection of freshwater mahinga kai species. In Environmental Research Institute report no. 106 [The University of Waikato].
Collins, D, Zammit, C, Willsman, A, & Henderson, R. (2015). Surface water components of New Zealand’s National Water Accounts, 1995–2014. NIWA, Client Report no. CHC2015-013-v2.
Cradock-Henry NA. (2021). Linking the social, economic, and agroecological: A resilience framework for dairy farming. Ecology and Society [Ecology and Society], 26(1).
Crow SK, Tipa GT, Booker DJ, & Nelson KD. (2018). Relationships between Maori values and streamflow: tools for incorporating cultural values into freshwater management decisions. New Zealand Journal of Marine and Freshwater Research [Taylor & Francis Online], 52(4), 626–642.
Davis S. (2021). Fish Passage Barrier Assessment in Wellington City [Trelissick Park Group].
De Bhowmick G, Sarmah AK, & Dubey B. (2021). Microplastics in the NZ environment: Current status and future directions. Case Studies in Chemical and Environmental Engineering [Science Direct], 3(June 2021), 100076.
Deep South National Science Challenge. (2018). Te Hiku O Te Ika Climate Change Project [Deep South Challenge].
Department of Conservation (DOC). (2020a). Biodiversity in Aotearoa [Department of Conservation].
Department of Conservation (DOC). (2020b). New Zealanders and the environment: Domestic customer segmentation research: New Zealanders engaging with the environment, biodiversity and conservation [Department of Conservation].
Department of Conservation (DOC). (nda). Wrybill/ngutu pare. Retrieved 21 February 2023, from https://www.doc.govt.nz/nature/native-animals/birds/birds-a-z/wrybill/
Department of Conservation (DOC). (ndb). Brown teal/pāteke. Retrieved 21 February 2023, from https://www.doc.govt.nz/nature/native-animals/birds/birds-a-z/brown-teal-pateke/
Department of Conservation (DOC). (ndc). White heron/kōtuku. Retrieved 21 February 2023, from https://www.doc.govt.nz/nature/native-animals/birds/birds-a-z/white-heron-kotuku/
Department of Conservation (DOC). (ndd). Australasian bittern/matuku. Retrieved 21 February 2023, from https://www.doc.govt.nz/nature/native-animals/birds/birds-a-z/australasian-bittern-matuku/
Department of Conservation (DOC). (nde). Black stilt/kakī. Retrieved 21 February 2023, from https://www.doc.govt.nz/nature/native-animals/birds/birds-a-z/black-stilt-kaki/
Department of Conservation (DOC). (ndf). Blue duck/whio. Retrieved 21 February 2023, from https://www.doc.govt.nz/nature/native-animals/birds/birds-a-z/blue-duck-whio/
Department of Conservation (DOC). (ndg). Australasian crested grebe/kāmana. Retrieved 21 February 2023, from https://www.doc.govt.nz/nature/native-animals/birds/birds-a-z/australasian-crested-grebe-kamana/
Department of Conservation (DOC). (ndh). Dabchick/weweia. Retrieved 21 February 2023, from https://www.doc.govt.nz/nature/native-animals/birds/birds-a-z/dabchick-weweia/
Department of Conservation (DOC). (ndi). Black billed gull/tarāpuka. Retrieved 21 February 2023, from https://www.doc.govt.nz/nature/native-animals/birds/birds-a-z/black-billed-gull/
Department of Conservation (DOC). (ndj). Marsh crake/koitareke. Retrieved 21 February 2023, from https://www.doc.govt.nz/nature/native-animals/birds/birds-a-z/marsh-crake-koitareke/
Department of Conservation (DOC). (ndk). Spotless crake/puweto. Retrieved 21 February 2023, from https://www.doc.govt.nz/nature/native-animals/birds/birds-a-z/spotless-crake-puweto/
Department of Conservation (DOC). (ndl). Why wetlands are important. Retrieved 6 March 2023, from http://www.doc.govt.nz/nature/habitats/wetlands/why-wetlands-are-important
Department of Conservation (DOC). (ndm). Freshwater pests. https://www.doc.govt.nz/nature/pests-and-threats/freshwater-pests/
Department of Internal Affairs (DIA). (2018). Three Water Review, Cost Estimates for upgrading Wastewater Treatment Plants to meet objectives of the NPS Freshwater [Department of Internal Affairs].
Devane ML, Weaver L, Singh SK, & Gilpin BJ. (2018). Fecal source tracking methods to elucidate critical sources of pathogens and contaminant microbial transport through New Zealand agricultural watersheds – A review. Journal of Environmental Management [Science Direct], 222, 293–303.
de Winton, MD, Champion, PD, Clayton, JS, & Wells, RDS. (2009). Spread and status of seven submerged pest plants in New Zealand lakes. New Zealand Journal of Marine and Freshwater Research [Taylor & Francis Online], 43 (2), 547–561.
Donovan M. (2022). Modelling soil loss from surface erosion at high-resolution to better understand sources and drivers across land uses and catchments; a national-scale assessment of Aotearoa, New Zealand. Environmental Modelling and Software [Science Direct], 147, 105228.
Drewry JJ, Carrick S, Penny V, Dando JL, & Koele N. (2022). Effect of irrigation on soil physical properties on temperate pastoral farms: A regional New Zealand study. Soil Research [CSIRO Publishing], 60(8) 760–771.
Dunn NR, Allibone RM, Closs GP, Crow SK, David BO, Goodman JM, Griffiths M, Jack DC, Ling N, Waters JM, & Rolfe JR. (2018). Conservation status of New Zealand freshwater fishes [Department of Conservation], 2017.
Durie M. (1998). Te mana, Te kawanatanga, The politics of Māori self-determination. Social Policy Journal of New Zealand Te Puna Whakaaro [Ministry of Social Development], 12.
Dymond JR, Sabetizade M, Newsome PF, Harmsworth GR, & Ausseil A-G. (2021). Revised extent of wetlands in New Zealand. New Zealand Journal of Ecology [JSTOR], 45(2), 1–8.
Egan E, Woolley JM, & Williams E. (2020). Assessing the vulnerability of taonga freshwater species to climate change [NIWA].
Elliot AH, Alexander RB, Schwarz GE, Shankar U, Sukias JPS, & McBride GB. (2005). Estimation of nutrient sources and transport for New Zealand using the hybrid mechanistic-statistical model SPARROW. Journal of Hydrology (New Zealand) [NIWA], 44(1), 1–27.
Engineering New Zealand. (2023). Manapouri Power Station [Engineering New Zealand].
ESR. (2019). Notifiable Diseases in New Zealand Annual Report 2017 [ESR].
Fell SC, Carrivick JL, & Brown LE. (2017). The Multitrophic Effects of Climate Change and Glacier Retreat in Mountain Rivers. BioScience [Oxford Academic], 67(10), 897–911.
Fenwick G, Greenwood M, Williams E, Milne J, & Watene-Rawiri E. (2018). Groundwater ecosystems: functions, values, impacts and management (Issue June) [Envirolink].
Foley MM, & Carbines M. (2019). Climate Change Risk Assessment for Auckland’s Marine and Freshwater Ecosystems. In Auckland Council technical report TR2019/015 (Issue March) [Knowledge Auckland].
Franklin P, Gee E, Baker C, & Bowie S. (2018). New Zealand Fish Passage Guidelines: For structures up to 4 metres [NIWA].
Franklin PA, Sykes J, Robbins J, Booker DJ, Bowie S, Gee E, & Baker CF. (2022). A national fish passage barrier inventory to support fish passage policy implementation and estimate river connectivity in New Zealand. Ecological Informatics [Science Direct], 71, 101831.
Franklin PA. (2014). Dissolved oxygen criteria for freshwater fish in New Zealand: A revised approach. New Zealand Journal of Marine and Freshwater Research [Taylor & Francis Online], 48(1), 112–126.
Fuller I, Richardson J, Basher L, Dykes R, & Vale S. (2011). Responses to River Management? Geomorphic Change over Decadal and Annual Timescales in Two Gravel-bed Rivers in New Zealand. In DA Molina (Ed), River Channels: Types, Dynamics and Changes (pp 137– 164). Nova Science Publishers.
Gascon M, Zijlema W, Vert C, White MP, & Nieuwenhuijsen MJ. (2017). Outdoor blue spaces, human health and well-being: A systematic review of quantitative studies. International Journal of Hygiene and Environmental Health [Science Direct], 220(8), 1207–1221.
Genesis Energy. (2023). Tongariro Power Scheme [Genesis Energy].
Gilpin BJ, Walker T, Paine S, Sherwood J, Mackereth G, Wood T, Hambling T, Hewison C, Brounts A, Wilson M, Scholes P, Robson B, Lin S, Cornelius A, Rivas L, Hayman DTS, French NP, Zhang J, Wilkinson DA, … Jones N. (2020). A large scale waterborne Campylobacteriosis outbreak, Havelock North, New Zealand. Journal of Infection, 81(3), [Science Direct] 390–395.
Gluckman P, Cooper B, Howard-Williams C, Larned S, Quinn J, Bardsley A, Hughey K, & Wratt D. (2017). New Zealand’s fresh waters: values, state, trends and human impacts. Report for Office of the Prime Minster’s Chief Science advisor [Department of the Prime Minister and Cabinet].
Goodman JM. (2018). Conservation, ecology, and management of migratory galaxiids and the whitebait fishery. A summary of current knowledge and information gaps [Department of Conservation].
Grainger N, Harding J, Drinan T, Collier K, Smith B, Death R, Makan T, & Rollinson EJ. (2018). Conservation status of New Zealand freshwater invertebrates, 2018 [Department of Conservation].
Graynoth E, Jellyman D, & Bonnett M. (2008). Spawning escapement of female longfin eels (Issue February) [NIWA].
Harding J, Clapcott J, Quinn J, Hayes J, Joy M, Storey R, Greig H, Hay J, James T, Beech M, Ozane R, Meredith A, & Boothroyd I. (2009). Stream Habitat Assessment Protocols for wadeable rivers and streams of New Zealand [Research Gate]. University of Canterbury.
Harmsworth G, Awatere S, & Robb M. (2016). Indigenous Māori values and perspectives to inform freshwater management in Aotearoa-New Zealand. Ecology and Society [Ecology and Society], 21(4).
Harmsworth G, & Awatere S. (2013). Indigenous Māori knowledge and perspectives of ecosystems. In JR Dymond (Ed), Ecosystem services in New Zealand – conditions and trends (pp 274–286) [Manaaki Whenua - Landcare Research]. Manaaki Whenua Press.
Hayes JW, Goodwin EO, Clapcott JE, & Shearer KA. (2019). The influence of natural flow and temperature and introduced brown trout on the temporal variation in native fish abundance in a “reference” stream. Canadian Journal of Fisheries and Aquatic Sciences [Canadian Science Publishing], 7(5), 705–722.
Hennessy K, Fitzharris B, Bates B, Harvey N, Howden S, Hughes L, Salinger J, & Warrick R. (2007). Australia And New Zealand. In ML Parry, OF Canziani, JP Palutikof, PJ van der Linden, & CE Hanson (Eds), Fourth Assessment Report of the Intergovernmental Panel on Climate Change (pp 507–540) [IPCC]. Cambridge University Press.
Henwood W, Brockbank T, Barnes HM, Moriarty E, Zammit C, & McCreanor T. (2019). Enhancing drinking water quality in remote Māori communities: Climate change, microbes and mātauranga Māori. MAI Journal [MAI Journal], 8(2).
Hikuroa D, Clark J, Olsen A, & Camp E. (2018). Severed at the head: towards revitalising the mauri of Te Awa o te Atua. New Zealand Journal of Marine and Freshwater Research [Taylor & Francis Online], 52(4), 643–656.
Hikuroa D, Slade A, & Gravley D. (2011). Implementing Māori indigenous knowledge (mātauranga) in a scientific paradigm: Restoring the mauri to Te Kete Poutama. MAI Review [MAI Review], 3.
Hopkins A. (2018). Classifying the mauri of wai in the Matahuru Awa in North Waikato. In New Zealand Journal of Marine and Freshwater Research [Taylor & Francis Online], 52(4), 657–665.
IPCC. (2022). Chapter 11: Australasia. Climate change 2022: Impacts, adaptation and vulnerability. Working Group II contribution to the sixth assessment report of the Intergovernmental Panel on Climate Change [IPCC].
Jefferies R, Warren T, Berke P, Chapman S, Crawford J, Ericksen N, & Mason G. (2011). Iwi interests and the RMA: An evaluation of the quality of first generation council plans (Vol. 2014, Issue October) [The University of Waikato].
Jellyman, PG, & Harding, JS. (2016). Disentangling the stream community impacts of Didymosphenia geminata: How are higher trophic levels affected? Biological Invasions [Springer Link], 18(12), 3419–3435
Jones, C, & Hickford, M. (2019). Indigenous peoples and the state: International perspectives on the Treaty of Waitangi [Routledge]. New York: Routledge.
Keane-Tuala K. (2015). Ngā manu – birds [Te Ara: The Encyclopedia of New Zealand].
Kennedy, P, & Sutherland, S. (2008). Urban Sources of Copper, Lead and Zinc [Te Kaunihera o Tāmaki Makaurau - Auckland Council]. Golder Associates (NZ), Technical Report no. 2008/023.
Kennedy, P, Allen, G, & Wilson, N. (2016). The management of hydrocarbons in stormwater runoff: a literature review [Te Kaunihera o Tāmaki Makaurau - Auckland Council]. Golder Associates (NZ), Technical Report no. 2016/010.
Kettles H, & Bell R. (2016). Estuarine ecosystems. In Robertson, H., Bowie, S., White, R., Death, R., Collins, D. (Eds), Freshwater conservation under a changing climate. Proceedings of a workshop hosted by the Department of Conservation [Department of Conservation], 10–11 December 2013, Wellington (pp 24-30). Department of Conservation, Christchurch, New Zealand.
Land Air Water Aotearoa (LAWA). (2021). Potentially toxic algae [LAWA].
Land Air Water Aotearoa (LAWA). (2022). Factsheet: Faecal indicators [LAWA].
Landman MJ, Van Den Heuvel MR, & Ling N. (2005). Relative sensitivities of common freshwater fish and invertebrates to acute hypoxia. New Zealand Journal of Marine and Freshwater Research [Taylor & Francis Online], 39(5), 1061–1067.
Larned ST, Moores J, Gadd J, Baillie B, & Schallenberg M. (2020). Evidence for the effects of land use on freshwater ecosystems in New Zealand. New Zealand Journal of Marine and Freshwater Research [Taylor & Francis Online], 54(3), 551–591.
Leonard M, & Eaton C. (2021). Recreational Water Quality Guidelines Update [ESR].
Litter Intelligence. (nd). Data, insights and action for a litter-free world [Litter Intelligence]
Lyver PO, Timoti P, Gormley AM, Jones CJ, Richardson SJ, Tahi BL, & Greenhalgh S. (2017a). Key Māori values strengthen the mapping of forest ecosystem services. Ecosystem Services [Science Direct], 27, 92–102.
Lyver PO, Timoti P, Jones CJ, Richardson SJ, Tahi BL, & Greenhalgh S. (2017b). An indigenous community-based monitoring system for assessing forest health in New Zealand. Biodiversity and Conservation [Springer Link], 26, 3183–3212.
Lyver POB, Timoti P, Richardson SJ, & Gormley AM. (2021). Alignment of ordinal and quantitative species abundance and size indices for the detection of shifting baseline syndrome. Ecological Applications [ESA], 31(4), 1–14.
Macinnis-Ng C, Mcintosh AR, Monks JM, Waipara N, White RSA, Boudjelas S, Clark CD, Clearwater MJ, Curran TJ, Dickinson KJM, Nelson N, Perry GLW, Richardson SJ, Stanley MC, & Peltzer DA. (2021). Climate-change impacts exacerbate conservation threats in island systems: New Zealand as a case study. Frontiers in Ecology and the Environment [ESA], 19(4), 216–224.
Maddock I. (1999). The importance of physical habitat assessment for evaluating river health. Freshwater Biology, 41(2), 373–391.
Manktelow, D, Stevens, P, Walker, J, Gurnsey, S, Park, N, Zabkiewicz, J, Teulon, D, & Rahman, A. (2005). Trends in Pesticide Use in New Zealand: 2004. HortResearch, Client Report no. 17962.
Mark G, Boulton A, Allport T, Kerridge D, & Potaka-Osborne G. (2022). “Ko Au te Whenua, Ko te Whenua Ko Au: I Am the Land, and the Land Is Me”: Healer/Patient Views on the Role of Rongoā Māori (Traditional Māori Healing) in Healing the Land. International Journal of Environmental Research and Public Health [MDPI], 19(14).
Mauri Compass. (2022). Mauri compass training programme: Tuna module [Mauri Compass].
McDowall RM. (2011). Ikawai: Freshwater fishes in Maori culture and economy [University of Canterbury]. Canterbury University Press.
McDowall, RM. (2000). The Reed Field Guide to New Zealand Freshwater Fishes. Dunedin, New Zealand: Reed Publishing (NZ) Ltd.
McGlone M, Walker S, Hay R, & Christie and J. (2010). Climate change, natural systems & their conservation in New Zealand. In RAC Nottage, DS Wratt, JF Bomman, & K Jones (Eds), Climate Change Adaptation in New Zealand (pp 82–100). New Zealand Climate Change Centre, Wellington.
McIntosh AR, McHugh PA, Dunn NR, Goodman JM, Howard SW, Jellyman PG, O’Brien LK, Nyström P, & Woodford DJ. (2010). The impact of trout on galaxiid fishes in New Zealand. New Zealand Journal of Ecology [Research Gate], 34(1), 195–206.
McMeeking S, Kururangi K, & Kahi H. (2019). He Ara Waiora: Background paper on the development and content of He Ara Waiora [University of Canterbury].
Mead HM. (2003). Tikanga Māori: Living by Māori values. Huia Publishers.
Mika JP. (2021). Māori perspectives on the environment and wellbeing [Research Gate].
Ministry for Primary Industries (MPI). (2020). Pest and disease search. Didymo. Retrieved 8 February 2023, from https://www.mpi.govt.nz/protection-and-response/finding-and-reporting-pests-and-diseases/pest-and-disease-search?article=1675
Ministry for Primary Industries (MPI). (nd). Freshwater pests and diseases [Ministry for Primary Industries].
Ministry for the Environment & Statistics New Zealand (MfE & Stats NZ). (2017). New Zealand’s Environmental Reporting Series: Our fresh water 2017.
Ministry for the Environment & Statistics New Zealand (MfE & Stats NZ). (2019). New Zealand’s Environmental Reporting Series: Environment Aotearoa 2019.
Ministry for the Environment & Statistics New Zealand (MfE & Stats NZ). (2020). New Zealand’s Environmental Reporting Series: Our freshwater 2020.
Ministry for the Environment (MfE). (2017). Coastal hazards and climate change: guidance for local government. Ministry for the Environment. Wellington, New Zealand.
Ministry for the Environment (MfE). (2020). Fish Index of Biotic Integrity in New Zealand Rivers.
Ministry for the Environment (MfE). (2021). Improving our understanding of the effects of water use on river flows: A case study for the Wellington and Manawatū-Whanganui regions for the period June 2015 to June 2018.
Ministry for the Environment (MfE). (2023). National Policy Statement for Freshwater Management 2020.
Ministry of Health. (2018). Drinking-Water Standards for New Zealand 2005 (revised 2018) [Ministry of Health].
Ministry of Health. (2022). Nitrate in drinking-water [Ministry of Health].
Monaghan R, Manderson A, Basher L, Spiekermann R, Dymond J, Smith C, Muirhead R, Burger D, & Mcdowell R. (2021). Quantifying contaminant losses to water from pastoral landuses in New Zealand II. The effects of some farm mitigation actions over the past two decades. New Zealand Journal of Agricultural Research, 64(3) [Taylor & Francis Online], 365–389.
Mora-Teddy AK, & Matthaei CD. (2020). Microplastic pollution in urban streams across New Zealand: concentrations, composition and implications. New Zealand Journal of Marine and Freshwater Research [Taylor & Francis Online], 54(2), 233–250.
Morgan TKKB. (2006). Decision-support tools and the indigenous paradigm. Engineering and Sustainability [ICE Virtual Library], 159(4), 167–177.
Mouton TL, Leprieur F, Floury M, Stephenson F, Verburg P, & Tonkin JD. (2022). Climate and land-use driven reorganisation of structure and function in river macroinvertebrate communities. Ecography [Wiley Online Library], e06148.
Neubauer SC, Franklin RB, & Berrier DJ. (2013). Saltwater intrusion into tidal freshwater marshes alters the biogeochemical processing of organic carbon. Biogeosciences [European Geosciences Union], 10(12), 8171–8183.
New Zealand Birds Online. (nda). Auckland Island teal/Tētē kākāriki. Retrieved 21 February 2023, from https://nzbirdsonline.org.nz/species/auckland-island-teal
New Zealand Birds Online. (ndb). Grey duck/Pārera. Retrieved 21 February 2023, from https://nzbirdsonline.org.nz/species/grey-duck
New Zealand Birds Online. (ndc). Banded dotterel/Pohowera. Retrieved 21 February 2023, from https://nzbirdsonline.org.nz/species/banded-dotterel
New Zealand Birds Online. (ndd). Black-fronted dotterel. Retrieved 21 February 2023, from https://nzbirdsonline.org.nz/species/black-fronted-dotterel
New Zealand Birds Online. (nde). Australian coot. Retrieved 21 February 2023, from https://nzbirdsonline.org.nz/species/australian-coot
New Zealand Birds Online. (ndf). Black shag. Retrieved 21 February 2023, from https://nzbirdsonline.org.nz/species/black-shag
New Zealand Birds Online. (ndg). Little shag. Retrieved 21 February 2023, from https://nzbirdsonline.org.nz/species/little-shag
New Zealand Birds Online. (ndh). Little black shag. Retrieved 21 February 2023, from https://nzbirdsonline.org.nz/species/little-black-shag
New Zealand Treasury – Te Tai Ōhanga. (2021). The living standards framework 2021 [New Zealand Treasury - Te Tai Ōhanga].
Ngata T. (2018). Wai Maori. In M. Joy (Ed.), Mountains to sea. Solving New Zealand's freshwater crisis. Wellington, New Zealand: Bridget Williams Books.
NIWA. (2007). Stocktake of diffuse pollution attenuation tools for New Zealand pastoral farming systems [NIWA].
NIWA. (2019). Koi carp, common carp Cyprinus carpio Linnaeus [NIWA].
NIWA. (2020). Freshwater Invasive Species of New Zealand [NIWA].
Noble M, Duncan P, Perry D, Prosper K, Rose D, Schnierer S, Tipa G, Williams E, Woods R, & Pittock J. (2016). Culturally significant fisheries Keystones for management of freshwater social-ecological systems. Ecology and Society [Ecology and Society], 21(2), 22.
NORMAN Network. (2016). Emerging substances: Why do we need to address emerging substances? [NORMAN]
Ockenden A, Northcott GL, Tremblay LA, & Simon KS. (2022). Disentangling the influence of microplastics and their chemical additives on a model detritivore system. Environmental Pollution [Science Direct], 307, 119558.
Ockenden A, Tremblay LA, Dikareva N, & Simon KS. (2021). Towards more ecologically relevant investigations of the impacts of microplastic pollution in freshwater ecosystems. Science of the Total Environment [Science Direct], 792, 148507.
OECD/Food and Agriculture Organization of the United Nations (OECD/FAO). (2015). OECD-FAO Agricultural Outlook 2015–2024. OECD/Food and Agriculture Organization of the United Nations, Paris, 148.
Office of the Prime Minister’s Chief Science Advisor (PMCSA). (2019). Rethinking plastics in Aotearoa New Zealand [Office of the Prime Minister's Chief Science Advisor] .
Orsman B. (2020). Auckland's drought crisis costed at $224m for extra water. NZ Herald, 7 July 2020.
Panelli R, & Tipa G. (2009). Beyond foodscapes: Considering geographies of Indigenous well-being. Health and Place [Science Direct], 15, 455–465.
Parliamentary Commissioner for the Environment (PCE). (2012). Hydroelectricity or wild rivers? Climate change versus natural heritage [Parliamentary Commissioner for the Environment].
Parliamentary Commissioner for the Environment (PCE). (2019). Focusing Aotearoa New Zealand’s environmental reporting system [Parliamentary Commissioner for the Environment].
Parliamentary Commissioner for the Environment (PCE). (2021). Wellbeing budgets and the environment: A promised land? [Parliamentary Commissioner for the Environment].
Parsons M, Fisher K, & Crease RP. (2021). Decolonising Blue Spaces in the Anthropocene (J. Taberham (Ed.)). Palgrave Studies in Natural Resource Management.
Pasanen TP, White MP, Wheeler BW, Garrett JK, & Elliott LR. (2019). Neighbourhood blue space, health and wellbeing: The mediating role of different types of physical activity. Environment International [Science Direct], 131(April), 105016.
Paulik R, Craig H, & Collins D. (2019). New Zealand Fluvial and Pluvial Flood Exposure [Deep South Challenge]. NIWA, Client Report no. 2019118WN.
Phillips N. (2007). Review of the potential for biomanipulation of phytoplankton abundance by freshwater mussels (kakahi) in the Te Arawa lakes [Bay of Plenty Regional Council].
Phiri BJ, Pita AB, Hayman DTS, Biggs PJ, Davis MT, Fayaz A, Canning AD, French NP, & Death RG. (2020). Does land use affect pathogen presence in New Zealand drinking water supplies? Water Research [Science Direct], 185, 116229.
Puddick J, Kelly L, & Wood S. (2022). Climate change and toxic freshwater cyanobacteria in Aotearoa New Zealand [ESR].
Rainforth H, & Harmsworth G. (2019). Kaupapa Māori Freshwater Assessments: A summary of iwi and hapū-based tools, frameworks and methods for assessing freshwater environments [Northland Regional Council].
Reed AW. (2021). He Atua He Tangata: The World of Māori Mythology (Third). Oratia Books.
Rey F. (2021). Harmonizing erosion control and flood prevention with restoration of biodiversity through ecological engineering used for co-benefits nature-based solutions. Sustainability [MDPI], 13(20), 11150.
Rodríguez JF, Saco PM, Sandi S, Saintilan N, & Riccardi G. (2017). Potential increase in coastal wetland vulnerability to sea-level rise suggested by considering hydrodynamic attenuation effects. Nature Communications [Nature Communications], 8.
Rolando C, Baillie B, Withers T, Bulman L, & Garrett L. (2016). Pesticide use in planted forests in New Zealand. NZ Journal of Forestry [New Zealand Institute of Forestry], 61(2), 3–10.
Rowe DK. (2007). Exotic fish introductions and the decline of water clarity in small North Island, New Zealand lakes: A multi-species problem. Hydrobiologia [Springer Link], 583(1), 345–358.
Ryan PA, & Ryan AP. (2006). Impacts of global warming on New Zealand freshwater organisms: a preview and a review. New Zealand Natural Sciences [University of Canterbury], 31(1896), 43–47.
Salmond A, Brierley G, & Hikuroa D. (2019). Let the Rivers Speak: thinking about waterways in Aotearoa New Zealand. Policy Quarterly [Policy Quarterly], 15(3).
Schallenberg M, De Winton MD, Verburg P, Kelly DJ, Hamill KD, & Hamilton DP. (2013). Ecosystem Services of Lakes. In Ecosystem services in New Zealand – Conditions and trends (pp 203–225).
Schallenberg M, Hall CJ, & Burns CW. (2003). Consequences of climate-induced salinity increases on zooplankton abundance and diversity in coastal lakes. Marine Ecology Progress Series [Inter-Research Science Publisher], 173, 157–167.
Snelder TH, Fraser C, Larned ST, Monaghan R, De Malmanche S, & Whitehead AL. (2021). Attribution of river water-quality trends to agricultural land use and climate variability in New Zealand. Marine and Freshwater Research [CSIRO Publishing], 73, 1–19.
Snelder TH, Whitehead AL, Fraser C, Larned ST, & Schallenberg M. (2020). Nitrogen loads to New Zealand aquatic receiving environments: comparison with regulatory criteria. New Zealand Journal of Marine and Freshwater Research [Taylor & Francis Online], 54(3), 527–550.
Stewart-Harawira MW. (2020). Troubled waters: Maori values and ethics for freshwater management and New Zealand’s fresh water crisis. Wiley Interdisciplinary Reviews: Water [WIREs], 7(5).
Tadaki M, Holmes R, Kitson J, & McFarlane K. (2022). Understanding divergent perspectives on introduced trout in Aotearoa: a relational values approach. Kotuitui [Taylor & Francis Online], 17(4), 461–478.
Taura Y, van Schravendijk-Goodman C, & Clarkson B. (2017). Te reo o te repo: The voice of the wetland [Manaaki Whenua - Landcare Research].
Taura Y, van Schravendijk-Goodman C, & Clarkson B. (2021). Te reo o te repo – kei konei tonu au | The Voice of the Wetland – I am still here [Manaaki Whenua - Landcare Research].
Taute N, Morgan K, Ingham J, Archer R, & Fa’aui T. (2022). Māori values in geothermal management and development. In AlterNative [SAGE Journals].
Te Manahuna Aoraki Project. (2022). Annual Report 2022 [Te Manahuna Aoraki Project].
Tiaki Tāmaki Makaurau – Conservation Auckland. (2023). Koi carp [Tiaki Tamaki Makaurau - Conservation Auckland].
Tipa G, & Teirney LD. (2006). A cultural health index for streams and waterways: a tool for nationwide use.
Tipa G. (2009). Exploring Indigenous Understandings of River Dynamics and River Flows: A Case from New Zealand. Environmental Communication [Taylor & Francis Online], 3(1), 95–120).
Usio N, & Townsend CR. (2000). Distribution of the New Zealand crayfish Paranephrops zealandicus in relation to stream physico- chemistry, predatory fish, and invertebrate prey. New Zealand Journal of Marine and Freshwater Research [Taylor & Francis Online], 34(3), 557–567.
Waitangi Tribunal. (2011). Ko Aotearoa Tēnei: a report into claims concerning New Zealand law and policy affecting Māori culture and identity (WAI 262 report) [Ministry of Justice].
Watene-Rawiri E. (2022). Restoring and enhancing tuna (Freshwater eels NZ). In Y Taura, C van Schravendijk-Goodman, & B Clarkson (Eds), Te Reo o te Repo Volume 2 (Issue January, p 101) [Research Gate]. Manaaki Whenua – Landcare Research.
Water New Zealand (Water NZ). (2021). National Performance Review [Water New Zealand].
Wells RDS, de Winton MD, & Clayton JS. (1997). Successive macrophyte invasions within the submerged flora of Lake Tarawera, Central North Island, New Zealand. New Zealand Journal of Marine and Freshwater Research [Taylor & Francis Online], 31(4), 449–459.
Whaanga H, & Roa T. (2021). Te reo o te repo: The language of the swamp. In Y Taura, C van Schravendijk-Goodman, & B Clarkson (Eds), Te reo o te repo: Kei konei tonu au | The voice of the wetland: I am still here [Manaaki Whenua - Landcare Research].
White MP, Elliott LR, Gascon M, Roberts B, & Fleming LE. (2020). Blue space, health and well-being: A narrative overview and synthesis of potential benefits. Environmental Research [Science Direct], 191, 110169.
Whitehead AL, Fraser C, Snelder TH, Walter K, Woodward S, & Zammit C. (2022). Water quality state and trends in New Zealand rivers: analyses of national data ending in 2020. NIWA Client Report 2021296CH prepared for Ministry for the Environment. NIWA, Christchurch.
Williams E, Crow S, Murchie A, Tipa G, Egan E, Kitson J, Clearwater S, & Fenwick M. (2017). Understanding Taonga: Freshwater Fish Populations in Aotearoa-New Zealand [Te Wai Māori].
World Health Organization (WHO). (2016). Nitrate and nitrite in drinking water: background document for development of WHO guidelines for drinking water quality [World Health Organization].
Wynyard MA. (2016). The price of milk: Primitive accumulation and the New Zealand dairy industry 1814-2014 [University of Auckland].
Young R, Smart G, & Harding J. (2004). Impacts of hydro-dams, irrigation schemes and river control works. In J S Harding (Ed), Freshwaters of New Zealand (pp 37.1–37.15) [CiteSeerX]. New Zealand Hydrological Society.
Zimmermann L, Gottlich S, Oehlmann J, Wagner M, & Carolin Volker. (2020). What are the drivers of microplastic toxicity? Comparing the toxicity of plastic chemicals and particles to Daphnia magna. Environmental Pollution [Science Direct], 267, 115392.
Our freshwater 2023
April 2023
© Ministry for the Environment