Theme 1: Our ecosystems and biodiversity

The biodiversity of Aotearoa New Zealand is essential to our culture, identity, and well-being. Our biodiversity – the whole variety of native plants, animals, microorganisms, the genes they contain, and the ecosystems they create – is unique to New Zealand and irreplaceable.

Image: iStock
Because of its evolution as a group of very isolated islands, New Zealand has a high proportion of native species that are found nowhere else in the world. Many lack defences or strategies for dealing with mammalian predators (like stoats or possums) and herbivores (such as deer), since they evolved almost completely without them. Our native species and ecosystems are therefore particularly vulnerable to introduced species and diseases, human activities, and changes to their habitat from climate, landscape changes, and pollution.
In this theme, the state of our biodiversity is reported, considering the loss and risk to species and ecosystems across land, freshwater, and marine environments. The main human activities that impact on ecosystems and species are also discussed, including what changes in biodiversity mean for our well-being.
Our native plants and animals, and the communities they form, are affected by all the issues identified in this report. When the pressure from these issues is combined with the effects of introduced species (a significant current pressure for terrestrial, freshwater, and marine environments) the compounding pressures intensify the impacts on animal and plant communities.
For other issues that impact biodiversity see:
Our unique native biodiversity is under significant pressure from introduced species, pollution, physical changes to our landscapes and coast, harvesting of wild species, and other factors. Almost 4,000 of our native species are currently threatened with or at risk of extinction.
All of New Zealand’s land, freshwater, and marine environments are affected.
There are major differences from what things were like before humans arrived.
Many aspects are irreversible – species extinction is forever. Many declines may be reversed with substantial effort.
It can potentially have significant impacts on our well-being, identity, and cultural values.
Large gaps in knowledge on the state of our biodiversity and the condition of many ecosystems may limit our ability to understand and reduce future declines.
The biodiversity of Aotearoa New Zealand is unique and vulnerable to changes we make to the environment. A high proportion of the species found here are found nowhere else in the world.
Some of these irreplaceable species include:
Biodiversity in all our land, freshwater, and marine environments has declined significantly since the arrival of humans. This downward slide includes the extinction of numerous native species, an increased risk of extinction for many surviving species, and a reduced range of ecosystems, both by type and area. These changes represent a major departure from what things were once like.
The changes have sometimes been dramatic, with species becoming extinct and the degradation of entire ecosystems. Other changes, though less dramatic, are very serious, like non-native species becoming established here or a decline in the health of ecosystems.
While most measures show a loss or increased risk to our biodiversity, some intensive conservation efforts provide a few brighter points.
An ecosystem describes the interrelationships between living organisms and the non-living environment. A healthy ecosystem contains a variety of native species, as would be found in that setting (eg river, forest, wetland, dunes) when it is in a pristine condition, unaffected by human disturbance.
Several components are assessed to describe ecosystem health. These include the abundance and diversity of species present (biodiversity), the availability and quality of habitats, and how completely the important ecological processes are sustained (eg decomposition, nutrient cycling, and connections between levels of the food chain).
Measuring these components is complicated and varies for different types of ecosystems. In freshwater ecosystems, for example, five components are recognised as important for assessing health (Clapcott et al, 2018):
At present, sufficient high-quality data is generally not available to describe all the aspects of a healthy ecosystem. This means it is only possible to assess some aspects of ecosystem health, and not its entirety.

Read the long description for Ecosystems
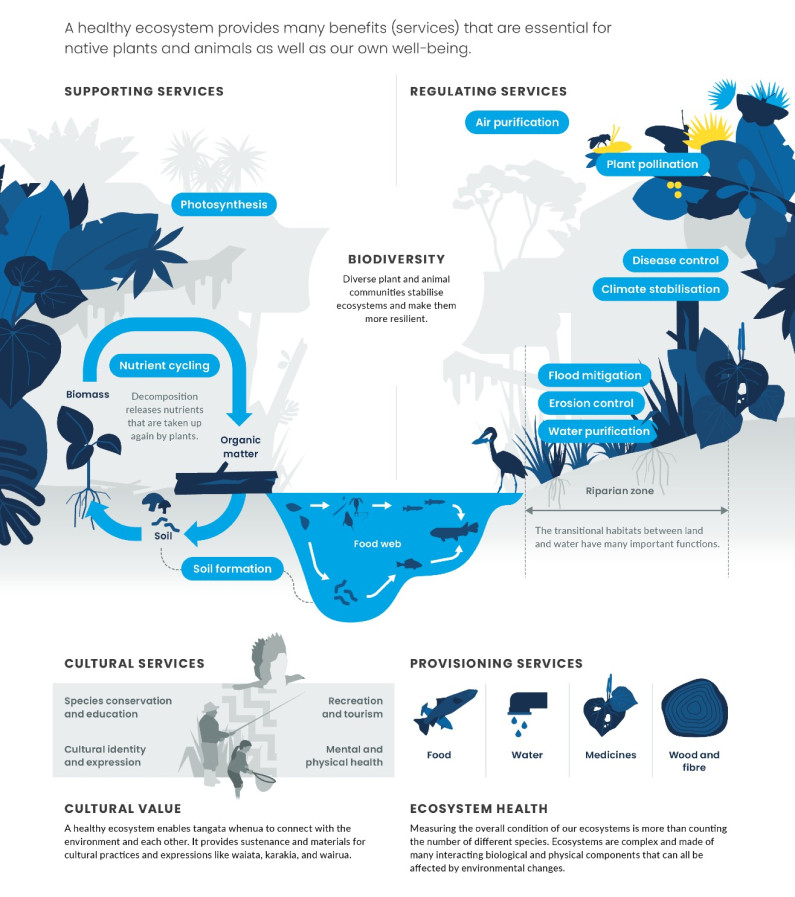
A healthy ecosystem provides many benefits (services) that are essential for native plants and animals as well as our own well-being.
Supporting services
Regulating services
Biodiversity
Riparian zone
Cultural services
Provisioning services
Cultural value
Ecosystem health
At least 75 animal and plant species have become extinct since humans arrived in New Zealand. This includes 59 bird species (Robertson et al, 2017), 3 frogs (Newman et al, 2013), 2 reptiles (Hitchmough et al, 2016), 4 insects (Leschen et al, 2012), and 7 plants (de Lange et al, 2018). All moa species are now extinct – an event recognised as the most rapid extinction of a large animal species caused by humans (Allentoft et al, 2014)
The New Zealand Threat Classification System (NZTCS) is used to assess the risk of extinction of New Zealand species (in this context, species is used to refer to plant and animal species, subspecies, and varieties). The conservation status of about 10,667 native species is known, which is only a fraction of the total number of species thought to exist in our land, freshwater, and marine environments. The NZTCS showed that 3,747 of New Zealand’s native species are either at risk or threatened with extinction (as reported between 2010 and 2018). (See indicators: Conservation status of indigenous freshwater species, Conservation status of indigenous land species and Conservation status of indigenous marine species.)
For our marine species, 90 percent of seabirds, 80 percent of shorebirds, and 26 percent of native marine mammals are either threatened with or at risk of extinction. The latest estimates (Baker et al, 2016) suggest that only 63 individuals of the endemic (found nowhere else in the world) Māui dolphin remain. In addition, 9 percent of sharks, rays, and chimaeras (ghost sharks) were also classified as threatened with or at risk of extinction extinction (see figure 1). (See indicator: Conservation status of indigenous marine species.)
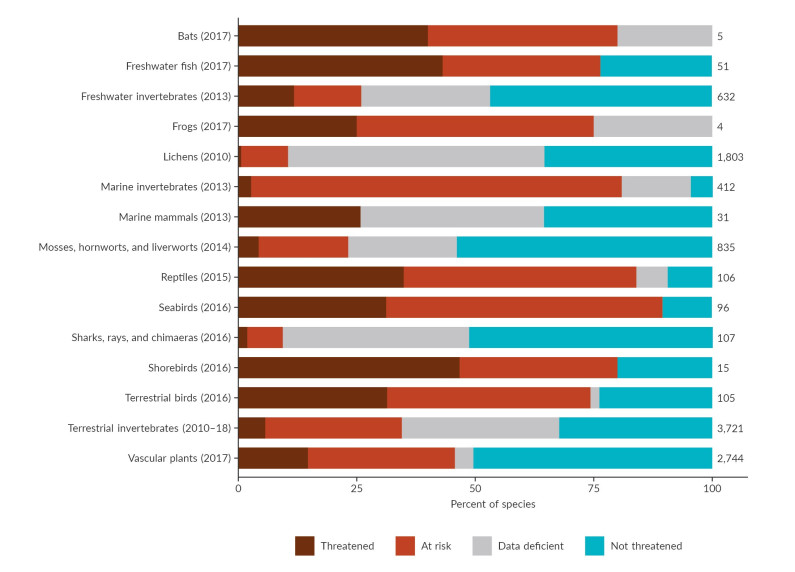
Image: Department of Conservation (Data source)

Image: Department of Conservation (Data source)
Freshwater species also face risks. In 2017, 76 percent of our native freshwater fish were either threatened with or at risk of extinction. More than 25 percent of native freshwater invertebrates had a threatened or at risk conservation status in 2013 (see figure 1). Almost 33 percent of the plant species that depend on fresh water are classified as threatened or at risk (Gerbeaux et al, 2016). Of these, almost 20 percent were in the highest risk category, ie nationally critical (Gerbeaux et al, 2016).
Many of our land species face extinction too. Eighty percent of bats, 84 percent of reptiles, 74 percent of terrestrial birds, and 75 percent of frogs are currently threatened with or at risk of extinction. This risk extends to land plants: 46 percent of vascular plants, 23 percent of mosses, hornworts, and liverworts, and 10 percent of lichens are threatened with or at risk of extinction (see figure 1).
Many of the habitats – land, freshwater, and marine – that our native species rely on have been reduced or damaged (see What has changed? and Issue 2: Changes to the vegetation on our land are degrading the soil and water). Such large-scale changes can make some species particularly vulnerable to extinction and lead to the degradation of entire ecosystems.
For a small country, we have a very diverse range of unique ecosystems. Some are naturally rare (there were only a few even before people arrived), while others are uncommon internationally. The braided rivers in Canterbury and Otago are one example (Grove et al, 2015; O’Donnell et al, 2016; Williams et al, 2007). Not only are these ecosystems rare, but they also contain unique plants and animals, many of which are threatened (eg O’Donnell & Hoare, 2011; O’Donnell & Moore, 1983).
Almost two-thirds of our rare ecosystems are threatened with collapse. The rate is higher for rare coastal ecosystems (like coastal turfs and shingle beaches), where more than three-quarters are threatened. (See indicator: Rare ecosystems.)
Assessing the health of an ecosystem is complicated and requires many different components to be evaluated. In most cases, the information that would allow an assessment of the overall health of all our ecosystems is lacking. However, some information that is useful for understanding the health of rivers and lakes, and the communities of plants and animals that live there, is available. The ecological health of rivers is partly informed by the macroinvertebrate community index (MCI), which is based on the presence or absence of different organisms (like mayflies and stoneflies) in a waterway.
More than three-quarters of New Zealand’s total river length had excellent or good MCI scores for 2013–17 (see figure 2). The MCI results show a relationship between the health of macroinvertebrate communities and the land use of the area. Compared with areas with native land cover, median MCI scores are 31 percent lower in urban areas and 15 percent lower in pastoral farming areas. (See indicator: River water quality: macroinvertebrate community index.) (See Issue 4: Our waterways are polluted in farming areas and Issue 5: Our environment is polluted in urban areas for further information that influences the ecological health of our rivers.)
The submerged plant index (SPI) is one measure of a lake’s ecological health and reports the diversity and extent of native and invasive plants. SPI data is only available for 210 lakes – a small percentage of the total number in New Zealand (there are 3,820 lakes greater than 1 hectare in size in New Zealand (Schallenberg et al, 2013).
Between 2007 and 2016, 33 percent of monitored lakes were in excellent or high ecological condition, 31 percent were in moderate condition, and 36 percent were in poor ecological condition or were entirely without submerged plants. Nearly all (90 percent) of the monitored lakes with vegetation had some non-native plant species present. (See indicator: Lake submerged plant index.)
Macroinvertebrates (animals without a backbone that are visible with the naked eye, like insects or snails) spend much of their lifecycle in a relatively small portion of a stream. They respond differently to changes in conditions (like pollutants, water flows, and habitat), so the presence or absence of particular species can provide an indication of the health of the living species in a waterway.
Different species are assigned specific scores that relate to their level of tolerance to changes in the environment. A final MCI score for a site is based on the average score of the various macroinvertebrates found there.
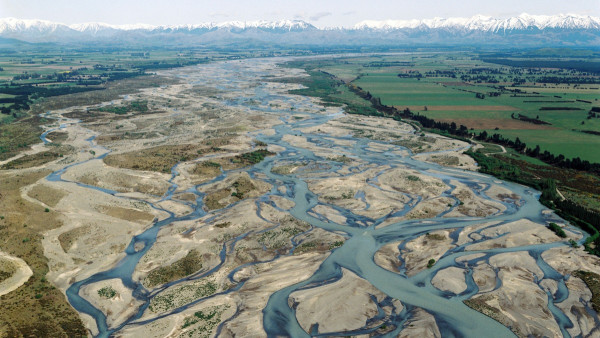
Lower reaches of the Waimakariri River. Photo credit: Lloyd Homer, GNS Science
Like ribbons draped across the Canterbury Plains, braided rivers carry water eastwards from the Southern Alps to the sea. Traversing alpine, forest, farm, and coastal landscapes, these rare ecosystems are forever changing, with floods lifting gravel from temporary islands and depositing it further downstream. A completely different pattern of water channels and islands can be created by a large flood.
Braided rivers are rare internationally and 60 percent of New Zealand’s braided rivers are found in Canterbury (Gray et al, 2018; Gray & Harding, 2007). More than 80 bird species feed and breed in braided rivers, including more than 20 wetland birds (O’Donnell & Hoare, 2011; O’Donnell & Moore, 1983). Some nest on the gravel islands – just a few speckled eggs protected only by their camouflage and watchful parents.
With almost no vegetation, braided river islands allow nesting birds to keep watch for predatory birds like southern black-backed gulls and swamp harriers. Being surrounded by water, islands also offer some defence from predators like rats and stoats, and a supply of food including mayflies, stoneflies, and small fish.
A number of these bird species are rare and also threatened: black stilt, wrybill, black-billed gull, and black-fronted tern all have nationally critical, vulnerable, or endangered threat classifications. Many of the fish, insects, spiders, and plants adapted to living in braided rivers are also rare and threatened (O’Donnell et al, 2016).
Relatively few braided rivers are in a natural condition today. Taking water from a river for other uses, including irrigation, alters the flow and causes significant changes to the river habitat. Dams also have an effect by making the flow more uniform and reducing floods.
Lower river flows stabilise the gravel islands and make it easier for invasive plants like broom and gorse to take hold. These plants encroach on bird feeding and breeding habitats and give predators a place to hide. A 2011 study found that rivers where the number of black-fronted terns had declined had relatively low flows, and further reductions in flow were predicted to accelerate the population decline (O’Donnell & Hoare, 2011).
River margins are important for native species like geckos and skinks but this habitat is lost when land beside braided rivers is used for other purposes. From 1990–2012 more than 11,000 hectares of this type of land in Canterbury was converted to intensive agriculture (Grove et al, 2015).
Because of their importance, braided rivers are the only type of ecosystem to have their own set of targets in the Canterbury water management strategy (Environment Canterbury, 2009). These targets are to:

Image: NIWA (Data source)
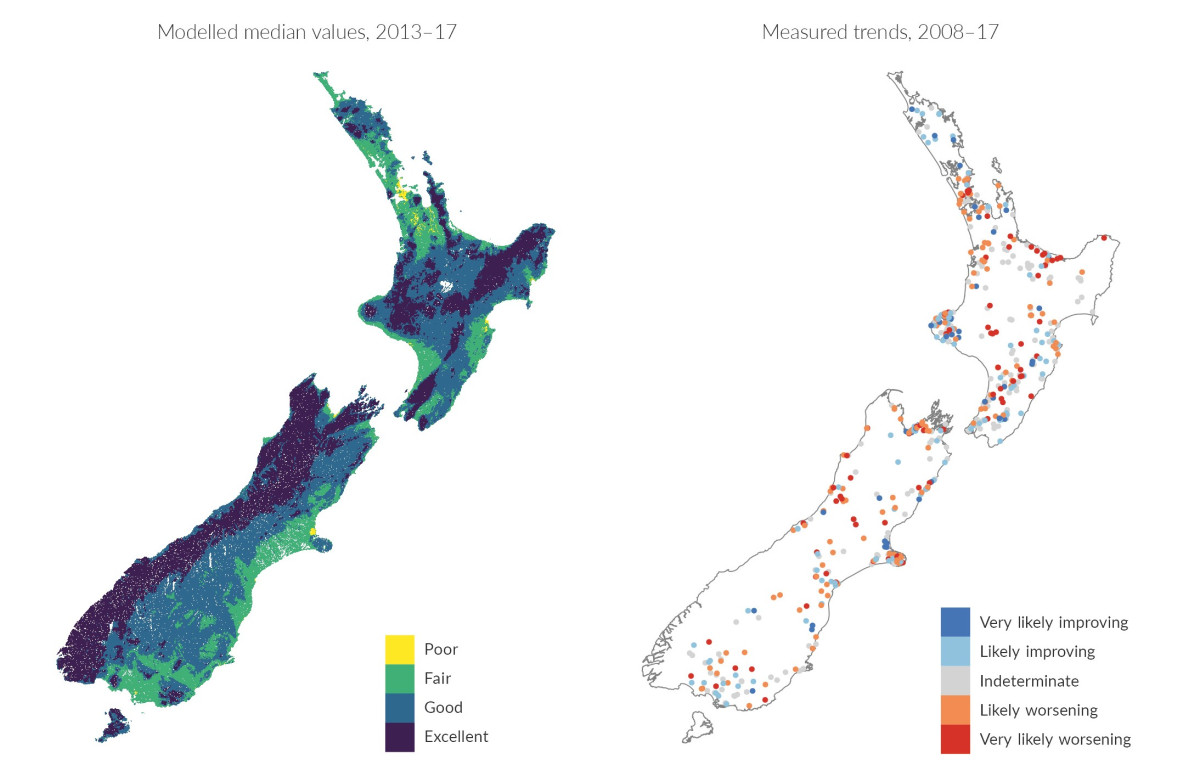
Image: NIWA (Data source)
Chlorophyll-a, a measure of phytoplankton biomass, is another measure of lake health. Between 2013 and 2017, 35 percent of 63 monitored lakes had worse scores for chlorophyll-a than the National Objectives Framework (NOF) bottom line for ecosystem health. (For more about NOF pollution in our waterways, see Issue 4: Our waterways are polluted in farming areas.)
The ecological health of lakes is also assessed using the lake trophic level index (TLI), which is based on the total concentrations of nitrogen, phosphorus, and chlorophyll-a. Lakes with good or very good TLI ratings have clear water (unless they have natural colour or cloudiness) and low concentrations of nutrients and algae (eg Lake Pukaki in Canterbury). Lakes with poor or very poor TLI tend to be murky and have high concentrations of nutrients and frequent algal blooms. These lakes have habitats that are not suitable for some native freshwater species and may not be useable for recreation (eg Lake Horowhenua in Manawatu-Wanganui).
Only 58 lake monitoring sites had enough data to assess the TLI for 2013–17. The median TLI rating was very good or good at 16 percent, average at 28 percent, and poor or very poor at 57 percent of these sites. The small number of sites, the restriction to only a few regions, and the bias towards monitoring lakes with known water quality issues mean the data available do not represent New Zealand lakes in general. (See indicator: Lake water quality.)
The cultural health index (CHI) uses factors of cultural importance to Māori to assess the health of freshwater ecosystems. CHI scores consist of three components: site status, mahinga kai (food gathering area) status, and the cultural stream health. Of 41 sites assessed between 2005 and 2016, 11 sites had good or very good CHI ratings, 21 had moderate scores, and 9 had poor or very poor ratings. (See indicator: Cultural health index for freshwater bodies and Issue 4: Our waterways are polluted in farming areas.)
There is not enough data to directly assess the ecological health of all New Zealand’s terrestrial and marine ecosystems, particularly at a national scale (see Where are the gaps in our knowledge about this issue?). Our ecosystems are, however, being affected by many of the issues discussed in this report (eg pollution in our rivers, expanding urban areas, changes to the land).
Before humans arrived in New Zealand, forests covered about 80 percent of the land (Nicholls, 1980), but it has been transformed in only 800 years (Wilmshurst et al, 2008). The first wave of settlers from Polynesia cleared many forest areas with fire, reducing the original forest by half. Next, European colonisers cut down and burned forest to make way for farming and settlements (McGlone, 1989).
Today, about one-third of the original native forest remains, mainly in mountainous and hilly areas. In 2012, native forest covered 26 percent of the land, native tussock grasslands 9 percent, and native scrub 7 percent (Our land 2018). (See indicators: Predicted pre-human vegetation and Indigenous land cover.)
Wetland areas have been reduced to only 10 percent of their estimated pre-human area and are continuing to decline in many regions. (See indicator: Wetland extent.) Active sand dunes, which were once widespread in New Zealand, declined by 80 percent between the 1950s and 2008. (See indicator: Active sand dune extent.)
Changes in biodiversity can be reported using Māori indicators of biodiversity and biophysical change (eg mauri – life force or essence). There are a number of examples where iwi have compiled narratives and interviews with kaumātua to inform the development of plans and strategies alongside councils and other organisations. One example includes estimates of change in the size of kererū flocks by Tūhoe Tuawhenua kaumātua in the past 100 years (Lyver et al, 2009).
No sooner had I finished my prayers I heard this thundering coming up the valley like a jet and I thought, “Oh! I’m in trouble here.” Then I heard this sound, ‘Whoooooosh!!!’ By crikey, the trees are moving and they [kererū] were quite a distance away when they turned around and it was white everywhere. There was a constant cooing all over the place. I was in awe and shivering with fear. I was so afraid I could feel my hairs standing. Some time went by and my excitement finally settled.
Recent assessments in the New Zealand Threat Classification System across all native, resident, and living species from land, freshwater, and marine environments showed that the extinction risk worsened for 86 species in the past 15 years. This included 61 plants, 10 land invertebrates, 5 land birds, 2 seabirds, 3 reptiles, 1 marine invertebrate, 3 freshwater invertebrates, and 1 freshwater fish (see figure 3). (Note: Change in conservation status is measured at the conservation status subcategory. For example, if a taxa (species) moved from threatened – nationally critical to threatened – nationally endangered, this is an improvement in conservation status.)
The conservation status of 26 species improved within the past 10 years. This included 2 plants, 1 bat, 1 freshwater fish, 2 shorebirds, 7 seabirds, 12 land birds, and 1 whale. The improvement was conservation-dependent for more than half (57.7 percent) of the species – meaning that if the management stopped, the species would be expected to decline to a worse conservation status over three of their generations. (See indicators: Conservation status of indigenous freshwater species, Conservation status of indigenous land species and Conservation status of indigenous marine species.)
Between 1996 and 2012, the total area of native forest was reduced by 16,108 hectares. Native scrub and shrubland declined by 24,187 hectares, and native tussock grasslands reduced by 30,928 hectares. (See indicator: Indigenous land cover.)
Wetland areas also continued to shrink, with at least 1,247 hectares lost between 2001 and 2016. (See indicator: Wetland extent.) The rate of decline in these precious ecosystems can be substantial – 157 hectares of wetland were lost per year in Southland between 1990 and 2012 (Robertson et al, 2018).
The volume of water in many of our rivers and lakes has been reduced by using water for activities such as irrigation and hydropower – including braided river systems. This can change the number of channels in a river and increase the spread of invasive plants (Caruso et al, 2013; O’Donnell et al, 2016). Changes in lake water levels also lead to the loss of native freshwater habitat near the shore (Thompson & Ryder, 2008). (See Issue 6: Taking water changes flows which affects our freshwater ecosystems.)
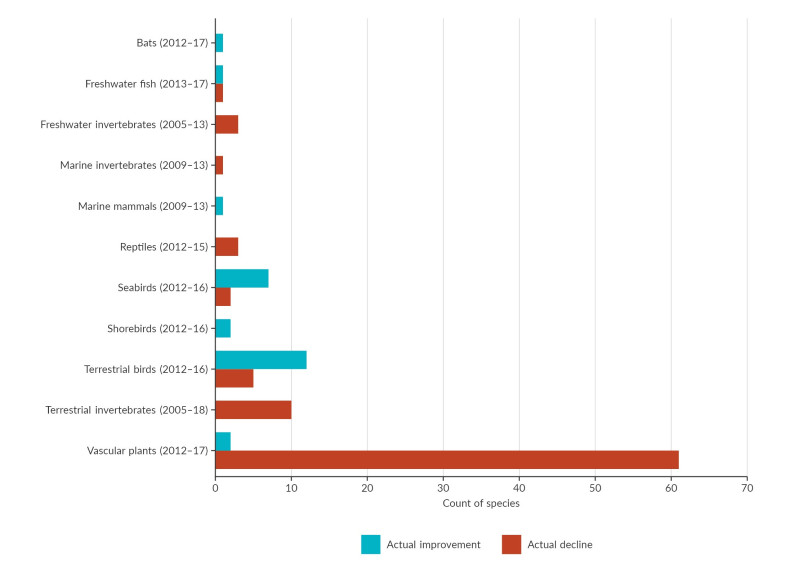
Image: Department of Conservation (Data source)
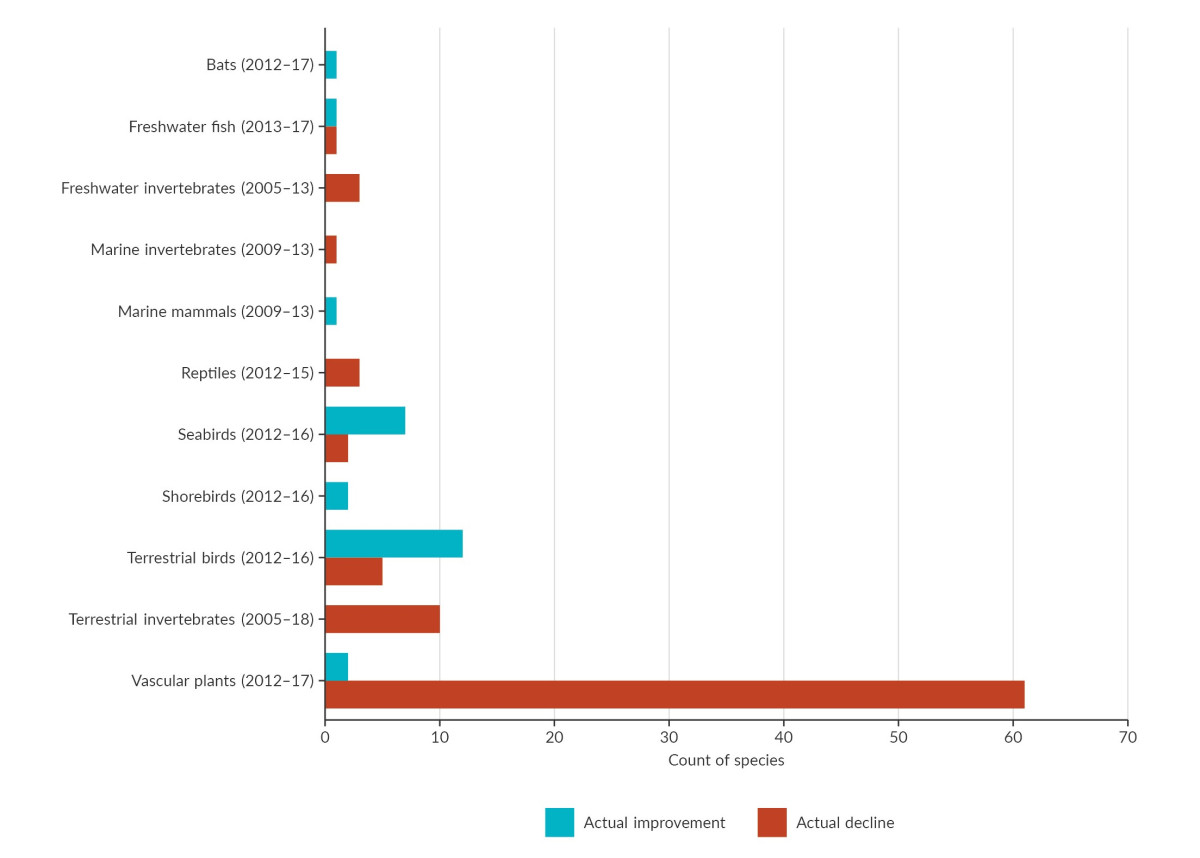
Image: Department of Conservation (Data source)
More river monitoring sites had declining MCI scores than improving scores from 2008 to 2017 – 59 percent had worsening trends and 41 percent had improving trends (see figure 2). For all these sites, trends were rated as likely (67–89 percent certainty in the trend) or very likely (90–100 percent certainty in the trend). This method of trend assessment differs from that used in previous environmental reports. The number of monitoring sites has also increased. These trend results are therefore not directly comparable to those in previous reports. (See Issue 4: Our waterways are polluted in farming areas.)
Nationwide, 62 lakes or fewer had sufficient data for trend testing. Of those that had sufficient data, more sites had improving than worsening trends for TLI, chlorophyll-a, ammoniacal nitrogen, and total phosphorus over the period 2008–17. Roughly the same proportion of lake monitoring sites had improving and worsening trends for total nitrogen and for water clarity in the same period.
Farming and urban expansion have driven the clearing of forest and the draining of wetlands, with associated losses of habitat and decline in species. (See Issue 2: Changes to the vegetation on our land are degrading the soil and water.) Māori have seen large areas of their land degraded by such changes, which has greatly impacted species and habitats of particular significance to Māori customary values and resources.
Compounding this issue is that land clearance was accompanied by a change in ownership and management arrangements, which led to radical changes in the nature of the relationship Māori had with their whenua. In 1840, Māori had exclusive rights and ownership over 27 million hectares of land, but there are only about 1.4 million hectares of Māori freehold land today (plus small amounts of land returned through Treaty of Waitangi claims and agreements since 1975). (Asher & Naulls, 1987; Durie, 1998; Kingi, 2008; Ministry for Culture and Heritage, 2017; Ministry of Justice, 2017; Orange, 2004.)
On average, native vegetation makes up less than 2 percent of urban land and about 10 percent on the urban-rural boundary (Clarkson et al, 2007). Ecological studies show that dropping below 10 percent native vegetation cover can trigger a decline in many species (Drinnan, 2005; McIntyre & Hobbs, 1999), so urban expansion and the further loss of native vegetation could cause disproportionately large changes in the biodiversity that remains on city fringes. (See Issue 3: Urban growth is reducing versatile land and native biodiversity.)
On coastal edges, reclaiming land (by infilling swamps/wetlands and harbours) and building marinas and seawalls have resulted in the loss and degradation of coastal habitats, particularly in sheltered harbours (MacDiarmid et al, 2009). Many of these areas were critically important areas for iwi and hapū as sources of sustenance and mana. Seagrass meadows, for example, have declined significantly since the late 19th century. These meadows are important nursery areas for fish and often hotspots of coastal biodiversity (Morrison et al, 2014). (See Issue 3: Urban growth is reducing versatile land and native biodiversity.)
The growth of urban centres can also increase pollution. Heavy metals entering waterways are of particular concern as they can be toxic to fish and invertebrates in both freshwater and coastal-marine environments. (See Issue 3: Urban growth is reducing versatile land and native biodiversity.)
Farming increases contaminants in our freshwater and coastal areas, posing threats to biodiversity because of their toxicity and associated habitat degradation. Soil washed from pastures and from forests after felling moves along waterways and settles as sediment on streambeds. It fills in the spaces used by fish and invertebrates for hiding and breeding, and makes their food harder to find or to eat. (See Issue 4: Our waterways are polluted in farming areas.)
The animals and organisms that humans have brought to New Zealand islands (intentionally and unintentionally) pose significant threats to native biodiversity in land, freshwater, and marine environments. The threats are from competition, predation, and diseases.
New Zealand is considered one of the most invaded countries in the world (Kelly & Sullivan, 2010). Nonnative plant species outnumber natives (Wilton & Breitwieser, 2000).
Stoats, possums, and rats were present on more than 94 percent of New Zealand land in 2014. (See indicator: Land pests.) Along with the impact that possums have on our native trees, these species pose significant threats to our native birds, lizards, and invertebrates. This is also an issue in populated areas due to predation by household pets (cats and dogs) and non-native animals that exploit urban environments (eg rats and mice). Exotic plants from gardens can be problematic, including the fastgrowing pest plants tradescantia (wandering willie) and climbing asparagus.
New Zealand has many introduced freshwater fish, with 21 species now present in our freshwater ecosystems (Collier & Grainger, 2015). Nine of these (eg the bullhead catfish, goldfish, and koi carp), along with 11 introduced invertebrate species and 41 non-native algae and plant species, were identified as being pests of greatest concern in our freshwater environments. (See indicator: Freshwater pests.) These pests compete with native species for food and space, and damage existing habitats. The river algal species Didymo (Didymosphenia geminata) for example, is now in more than 200 waterways in the South Island, where it can form thick, dense mats over an entire streambed (Jellyman & Harding, 2016).
More than half of the 351 non-native species (plants, algae and animals) found in our coastal waters have established breeding populations. The number of known non-native species also increased by 10 percent between 2010 and 2015. (See indicator: Marine non-indigenous species.)
In Tuawhenua forests in Te Urewera, introduced species have contributed to the change in the language of the forest of Te Urewera (Lyver et al, 2017a, b). Tuawhenua kaumātua have observed declining populations of blowflies (Calliporidae), and insects that pollinate a wide range of New Zealand plants (Heath, 1982; Heine, 1937; Howlett, 2012). Blowflies are attacked and eaten by introduced European wasps (Vespula germanica) (Doherty & Tumarae- Teka, 2015; Fordham, 1961).
In the past, harvesting for food or commercial purposes contributed to the extinction of some species (such as moa and huia). Other harvests caused drastic population changes, leaving species close to extinction. (See Issue 7: The way we fish is affecting the health of our ocean environment for information about the impact of harvesting on whales, seals, and sea lions.)
Contemporary harvesting is also impacting our biodiversity. Commercial sea fishing impacts our marine ecology. The information we have does not show the whole picture but we do have data about the effects of fishing on protected marine species (from accidental catch) and on seabed habitats from trawling. (See Issue 7: The way we fish is affecting the health of our ocean environment.)
Mining, industrial processing, and manufacturing have had major effects on local ecology. In some places, activities from many decades ago have an enduring effect on the soil and water (Our land 2018).
Taking water for irrigation, industry, and household use can reduce river flows and impact stream habitats and freshwater biodiversity (eg Caruso et al, 2013; O’Donnell et al, 2016). It can also damage our unique and rare ecosystems including braided rivers. (See Issue 6: Taking water changes flows which affects our freshwater ecosystems.)
Virulent pathogens (disease-causing organisms) that are new to the country often pose serious threats to our biodiversity. Because our understanding of new diseases and pathogens is often limited, it may be difficult to put effective control measures in place.
Myrtle rust is a threat to plants in the Myrtaceae family including mānuka, pōhutukawa, and rātā. It is an aerially borne fungal disease that can kill plants and its microscopic spores are dispersed by the wind, making it very difficult to control. Myrtle rust was first detected in May 2017 and is now present throughout large parts of the North Island and in the north of the South Island. This distribution is related to climatic conditions and the presence of suitable host species (Beresford et al, 2018).
Our unique kauri forests are also seriously threatened by kauri dieback (Phytophthora agathidicida) – a disease for which there are treatments, but no cures.
Evidence suggests that climate change is already starting to impact our native species. Increasing temperatures have shifted the distribution of some species and increased the numbers of invasive pests in some areas. (See Issue 9: Climate change is already affecting Aotearoa New Zealand.) More research is needed to fully understand the potential impacts of climate change on our biodiversity (see What are the gaps in our knowledge about this issue?).
Our unique native species and the environments theyinhabit are irreplaceable. They have immense intrinsic value and wide-ranging values to people. Damage to our biodiversity affects us now and all future generations of New Zealanders.
A loss of biodiversity can be felt in cultural connections (like a sense of identity and belonging), in the resources available to us (like wild food sources), and in functions (such as pollination of plants or filtering of air pollution). Underneath these benefits are background supporting processes, including soil formation and nutrient cycling by soil organisms. The degradation or loss of biodiversity can affect these services, many of which are essential for our well-being (Dymond, 2013).
The ties between us and our biodiversity run deep – we call ourselves ‘Kiwis’ and proudly use the silver fern (ponga) for our national identity. Access to nature is an important component of the lifestyle we enjoy. In te ao Māori, people’s well-being depends on the health of the environment. The reverse is just as true – the health of the environment is dependent on people’s well-being.
Our identity as a people suffers when we experience damaged or lost native species and ecosystems, and recreational opportunities and the connections we have to nature are also degraded. Bird song is recognised by tangata whenua as significant in the language of the forest. Around Ruatāhuna 40–50 years ago, it was difficult to hear someone speak metres away from you because of the volume of noise from the bird chorus (Lyver et al, 2017a, 2017b).
People have a special relationship with the environment. This relationship can be described in a number of ways including through a te ao Māori perspective. Another framework to describe our relationship with the environment is through the benefits that ecosystems provide to us and our society. This is referred to as an ‘ecosystem services’ approach. Benefits are categorised as provisioning (eg food and fibre), regulating (eg flood or climate regulation), supporting (eg photosynthesis and nutrient cycling), and cultural (eg wairua/spiritual, recreational) services.
New Zealand’s native forests regulate the climate by storing carbon, prevent erosion, provide nursery habitats, and create nectar for honey production. They are also the backbone of our recreation and tourism activities (Dymond et al, 2015).
Natural wetlands also provide important ecosystem services. Wetlands are often called ‘nature’s kidneys’ because they purify water by filtering out nutrients and sediments. Wetlands regulate water flow during storms and store carbon as peat. In New Zealand, they have a particular significance to Māori as taonga and for mahinga kai (Clarkson et al, 2013).
A reduction in biodiversity and ecosystem health reduces the ability to provide benefits and services (Cardinale et al, 2012). A loss of biodiversity can reduce the capacity of an ecosystem to produce biomass, decompose and recycle essential nutrients, and make it less stable and therefore more vulnerable to climate change.
Native biodiversity provides mahinga kai and other culturally important materials like raranga (weaving), and rongoā (medicinal uses) for Māori communities. In addition they represent important indicators for kaitiaki in their management of the environment, as well as being key to the maintenance and transmission of intergenerational knowledge. A loss of biodiversity – and the quantity of food and material available – limits the opportunities for tangata whenua to connect with and use the environment.
Customary practices that surround the use of biodiversity and natural materials can be vital in maintaining and reinforcing values like mana (authority and prestige), identity (ahikāroa), family ties and linkages (whanaungatanga), and knowledge systems (mātauranga), as well as the inter-generational transfer of knowledge (whakaheke kōrero) (Harmsworth & Awatere, 2013; Lyver et al, 2017a, 2017b).
Biodiversity also makes significant contributions to cultural expressions like prayer (karakia), songs (waiata, mōteatea, pao), instrumental music (taonga puoro), performances (kapa haka), products (tā moko, whakairo), and representations of traditional thought (wairua) (Harmsworth & Awatere, 2013; Timoti et al, 2017).
These expressions were often crafted to express whakapapa, relationships between the natural and human realms, and the responsibilities and reciprocity people have with the environment (Timoti et al, 2017; Walsh et al, 2013). The use of materials and engagement with the environment is critical for tangata whenua to compose, protect, maintain, regenerate, and apply knowledge and expressions of culture.
High levels of biodiversity increase ecosystem resilience to moderate to extreme climate events (Isbell et al, 2015). Declines in biodiversity, however, can have an opposite effect (Oliver et al, 2015). Species loss and habitat degradation can make ecosystems less resilient to environmental change (Isbell et al, 2015) leading to further declines in biodiversity.
It is difficult to measure the overall condition of our ecosystems (Andreasen et al, 2001) because the systems themselves are complex, and climate and landscape variations are overlaid. Information is particularly limited for rare and naturally uncommon ecosystems.
Despite recent efforts to improve freshwater quality, we still have incomplete knowledge about the condition of our freshwater ecosystems, habitats, and their fish and invertebrate communities. For example, although the area of wetlands has declined, little is known about the condition of the wetlands that remain. Our knowledge about large rivers and the biology of groundwater ecosystems is also poor (Sirisena et al, 2013) and only around 150 of the nation’s more than 3,000 lakes are regularly monitored by regional authorities (Larned et al, 2019).
There are major gaps in our knowledge of the marine environment. We have one of the largest exclusive economic zones (EEZ) in the world and most of it has never been surveyed. While scientists have identified more than 17,000 species, many thousands more are yet to be discovered and identified.
Information is also missing at a species level – the conservation status of 2,805 species cannot be assessed because of a lack of data. Some groups of species are not well studied and many species are yet to be described. This is particularly true for invertebrates. For marine invertebrates, the number of species assessed for their conservation status (412) may only be 5 percent of the total number of species.
Introduced species are one of the greatest negative influences on our terrestrial biodiversity. We do not have accurate data about the location or number of introduced species or how they are changing.
Research and monitoring are needed to better understand the consequences of climate change on our native species and our biodiversity. It is likely to have significant impacts on our biodiversity like changing where species live and their reproductive behaviour as well as increasing their risk from invasive species. Climate change could also create mismatches in timing between species and their sources of food.

Theme 1: Our ecosystems and biodiversity
April 2019
© Ministry for the Environment