Theme 5: Our changing climate

Greenhouse gas emissions are causing significant changes to Earth’s oceans, atmosphere, and climate. We expect these changes to be very long-lasting – some will be irreversible.

Image: Alan Blacklock, NIWA
We are already seeing changes in our climate and marine environment, and these are expected to become more severe. These changes reach across the length and breadth of Aotearoa New Zealand, with some regional differences. As an island nation with a large marine zone, long coastline, and an economy based mainly on primary production and international tourism, we are vulnerable to the impacts of climate change.
This theme looks at two climate change issues:
This theme does not contain an assessment of our current knowledge about climate change. That information is provided by the Intergovernmental Panel on Climate Change (IPCC), whose reports the New Zealand Government has accepted. (See Our atmosphere and climate 2017.)
Some other aspects of climate change are discussed in other issues and themes:
Our per-person rate of greenhouse gas emissions is one of the highest for an industrialised country. Most of our emissions in 2016 came from livestock and road transport.
Sources of emissions that contribute to our high per capita rate exist nationwide.
Since 2000, greenhouse gases in Earth’s atmosphere have increased 10 times faster than at any other time in the past 800,000 years (IPCC, 2018a).
Greenhouse gas emissions from human activities are mostly under our control. Once in the atmosphere they can affect our climate for thousands of years.
Climate change is projected to affect many of the things we value.
Levels of future global emissions are uncertain, as is how New Zealand will be affected.
For 2017, the average concentration of carbon dioxide (CO2) in the atmosphere was 405 parts per million (ppm), about 46 percent higher than the pre-industrial level of 280 ppm (IPCC, 2014b; NOAA, n.d.). Globally, in 2013 agriculture contributed 11 percent of all greenhouse gas emissions, 78 percent came from energy production, of which 43 percent was from electricity or heat generation. (See indicator: Global greenhouse gas emissions.)
The global mix of the main greenhouse gas emissions in 2013 was carbon dioxide (produced from fossil fuels, cement, land-use change, and forest harvesting) 76 percent, methane 16 percent, and nitrous oxide 6 percent.
The top 12 emitting countries emitted nearly twice as much as all other countries combined. The five countries with the largest percentages of total global emissions were China (26 percent), United States (14 percent), European Union (28 countries; 9 percent), India (6 percent), and the Russian Federation (5 percent). New Zealand contributed 0.17 percent (Our atmosphere and climate 2017).
Global warming potential (GWP) is a term used to describe how much global warming a greenhouse gas may cause over a given time period (usually 100 years) compared with carbon dioxide. It takes into account how long the gas stays in the atmosphere and how strong a warming effect it has.
Carbon dioxide equivalent (CO2-e) uses GWP to convert a given amount of a greenhouse gas like methane into an equivalent amount of carbon dioxide so they can be compared and reported consistently.
For example, emitting 1 kilogram of methane (GWP of 25) is equivalent to emitting 25 kilograms of carbon dioxide (25 kilograms carbon dioxide equivalent). One kilogram of nitrous oxide (GWP of 298) is equivalent to 298 kilograms of carbon dioxide.
While we make a small contribution to global emissions, our country has one of the highest rates of emissions per person. In 2015, New Zealand emitted 17.5 tonnes of carbon dioxide equivalent greenhouse gases per person. This was 33 percent higher than the Annex I (industrialised countries) average of 13.2 tonnes, and higher than all but five of the 43 Annex I countries (UNPD, n.d.).
In 2016, New Zealand emitted 78,727 kilotonnes of carbon dioxide equivalent greenhouse gases, mainly carbon dioxide (44 percent), methane (43 percent), and nitrous oxide (12 percent). (See indicator: New Zealand’s greenhouse gas emissions.)
Our emissions profile is unusual for a developed country. In most developed countries emissions are dominated by fossil fuel combustion, especially burning coal to produce electricity, and burning petrol for transport. By contrast, we produced 85 percent of our electricity from renewable sources in 2016, primarily in hydroelectric schemes (MBIE, 2017). (See Theme 2: How we use our land for information about physical changes to land related to hydro-generation and Theme 4: How we use our freshwater and marine resources.)
Nearly half of our gross emissions in 2016 (mainly methane and nitrous oxide) came from agriculture, which reflects the important role of this industry in our economy. In 2016, livestock digestion was responsible for 82 percent of all methane emissions. Ninety-four percent of all nitrous oxide emissions were from agricultural soils, mainly from the urine and dung of grazing animals.
Our carbon dioxide emissions in 2016 were mainly from using fossil fuels in road transport and manufacturing. Road vehicle emissions made up 39 percent of all carbon dioxide emissions, while manufacturing and construction contributed 20 percent, energy industries 12 percent, and industrial production and product use 9 percent.
As well as greenhouse gases, our larger cities tend to have high levels of black carbon. This is the sooty black material produced during combustion. In New Zealand it mainly comes from burning wood and coal for home heating, and from diesel engines. Although black carbon concentrations have decreased in some places (including Whangarei, Auckland, and Nelson), they remain high in others, compared with cities in Europe and the United States (Davy & Trompetter, 2018). (See indicator: Black carbon concentrations.)
Black carbon is estimated to be one of the most important contributors to global warming behind carbon dioxide (IPCC, 2014c). When it lands on ice and snow, like mountain glaciers, it speeds up melting because its dark colour absorbs heat. The tiny particles that make up black carbon also have serious health effects when they are inhaled. (See Issue 5: Our environment is polluted in urban areas.)
Global emissions have increased dramatically: half of all human-generated carbon dioxide emissions since 1750 have occurred since 1970. From 2000 to 2010, global greenhouse gas emissions increased by about 2.2 percent per year, compared with 1.3 percent per year from 1970 to 2000 (IPCC, 2014b).
Global carbon dioxide concentrations have risen by about 20 ppm per decade since 2000. This rise is up to 10 times faster than any sustained rise during the past 800,000 years. Global temperatures have already increased by about 1 degree Celsius above pre-industrial levels due to human activities. If temperatures continue to increase at the current rate, it is projected that global warming is likely to reach 1.5 degrees Celsius above pre-industrial temperatures between 2030 and 2052 (IPCC, 2018b).
These global-scale rates of human-driven change far exceed the rates of change driven by other forces that have altered Earth in the past. Even sudden events, like volcanic eruptions, do not approach the current rates of change (IPCC, 2018a).
Gross greenhouse gas emissions are the total emissions from agriculture, energy, industrial processes and product use, and waste. This total includes all greenhouse gases.
Some types of land use, especially forestry, remove carbon dioxide from the atmosphere. Net emissions are gross emissions combined with removals and emissions from land use, land-use change and forestry.
Our net emissions are strongly influenced by forest planting and harvesting cycles. Land use, land-use change and forestry removed 23 percent less carbon dioxide from the atmosphere in 2016 than in 1990, because the harvest rate of planted forest increased during this time.
New Zealand’s gross greenhouse gas emissions increased by 20 percent since 1990, but have been relatively steady in the last decade (see figure 20), despite increases in population and gross domestic product (GDP).
Per-person carbon dioxide equivalent greenhouse gas emissions were 12 percent lower in 2015 than 2006 (a decrease from 19.9 to 17.5 tonnes per person) because our population increased while emissions remained steady. Per-person emissions in 2015 (17.5 tonnes per person) were also 10 percent lower than in 1990 (19.4 tonnes per person) (UNPD, n.d.).
New Zealand’s greenhouse gas emissions per unit of GDP were 43 percent lower in 2016 than in 1990, but still high internationally – the fourth highest in the OECD in 2016 (OECD, n.d.).
From 1990 to 2016, road transport emissions increased by 82 percent, and manufacturing and construction emissions by 45 percent. Gross emissions from agriculture increased by 12 percent during this time. Methane emissions from livestock increased by 6 percent, mainly due to a doubling in the total number of dairy cows, which produce more methane per animal than non-dairy cattle and sheep (MfE, 2018).
In the decade from 2007 to 2016, livestock emissions were relatively stable, but this stability masks a shift in emissions sources. Methane emissions from sheep decreased 23 percent but this was offset by an increase in methane emissions from dairy cattle.

Image: Ministry for the Environment; United Nations Population Division (Data source)
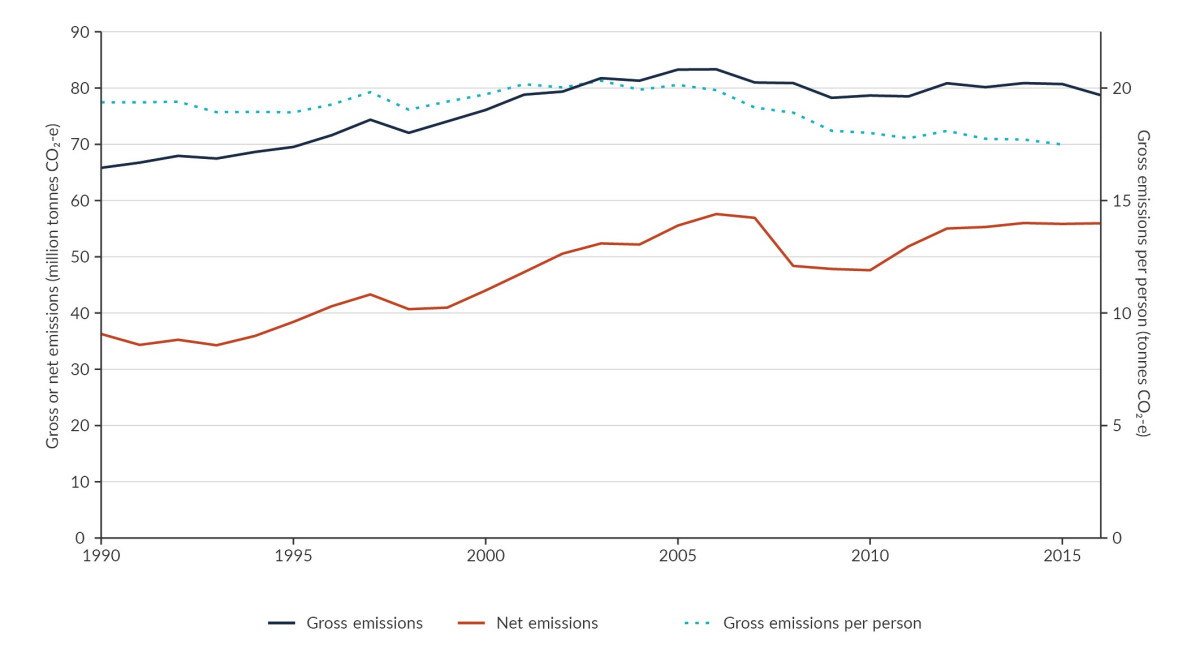
Image: Ministry for the Environment; United Nations Population Division (Data source)
Our high per-person emissions are reversible if we adopt policies, technologies, or other means that reduce our production of greenhouse gases. The benefits of doing this must be evaluated alongside the impacts these reductions would have on our society and economy.
According to the IPCC (2018a), global warming is driven by emissions from human activities – this means the world can choose to limit future global warming and climate change by reducing greenhouse gas emissions. Even small reductions in greenhouse gas concentrations will reduce the changes that our grandchildren and their descendants will experience.
Although it is possible to reduce or offset our emissions of greenhouse gases, how that affects the concentrations of greenhouse gases in the atmosphere depends on the gas. Some gases only remain in the atmosphere for a relatively short time (about a week for black carbon particles and a decade for methane). Because these gases and particles tend to have a greater warming effect than carbon dioxide, reducing or eliminating short-lived emissions will have a more immediate effect on the climate.
Nitrous oxide remains in the atmosphere for more than 120 years; carbon dioxide for centuries or longer. Even if emissions stopped today, the impacts of the carbon dioxide that has already been emitted will continue for many centuries. We are set to experience the effects of today’s emissions for many years to come.
Our high per-person emissions are partly due to the large proportion of methane and nitrous oxide we emit. Because these gases warm our atmosphere more strongly than an equivalent amount of carbon dioxide, they increase our per-person carbon dioxide equivalent greenhouse gas emissions significantly.
The high per-person emissions also reflect our high rate of car ownership – the highest in the OECD (OECD, 2017). The carbon dioxide emissions per kilometre of the vehicles entering our fleet decreased from 2005 to 2012, but have been steady since then. Although the number of vehicles entering the fleet in 2017 was a record high, the number exiting it was low. This is a continuation of a pattern that makes our light vehicle fleet relatively old by OECD standards – 14 years on average for a petrol-powered vehicle. The high rate of ownership and relatively high CO2 emissions per kilometre of newly registered vehicles contributes to New Zealand being among the highest OECD countries for emissions of CO2 per capita from on-road transport (OECD, 2017; Ministry of Transport, 2017).
Our ageing vehicle fleet also contributes to black carbon emissions (as older vehicles emit more per unit of fuel burned) (Davy & Trompetter, 2018). The contribution that burning wood and coal for home heating makes to urban pollution, including black carbon, is discussed in Issue 5: Our environment is polluted in urban areas.
Although our global contribution is small, New Zealand’s emissions, and the cumulative emissions of other small countries, contribute to the warming of our atmosphere and oceans. The rate of warming is also unprecedented, and may be faster than some organisms and ecosystems can adapt to.
The impacts of these changes are already being felt globally:
Impacts already being experienced in New Zealand are detailed in Issue 9: Climate change is already affecting Aotearoa New Zealand.
Our high rate of per-person emissions compared with other industrialised countries also carries a reputational risk for a country where international trade and tourism are strongly linked to our environmental credentials.
Knowing how global emissions will increase or decrease in the future, and what actions would be implemented to curtail emissions, is the biggest gap. Some countries such as the UK and Germany have emissions that are now lower than they were in 1990, but globally, greenhouse gas emissions continue to increase (IPCC, 2014b; OECD, n.d.).
Other uncertainties concern the relative strengths of various sources and sinks for greenhouse gas emissions. Trees remove carbon dioxide from the air and store it as biomass, which offsets some of our emissions. It is possible for example that the native forests on the west coast of the South Island may be a bigger carbon sink than previously recognised, but more work is needed to confirm this (Steinkamp et al, 2017).
There are significant gaps in our knowledge around global tipping points, particularly in situations where levels of carbon dioxide above a threshold precipitate feedback with even faster rates of emissions and warming (Steffen et al, 2018).
Changes to our climate are already being felt in our land, freshwater, and marine environments. We can expect further wide-ranging consequences for our culture, economy, infrastructure, coasts, and native species.
Climate change is affecting all parts of New Zealand. Impacts vary by region and sector.
Some changes are not yet detectable (extreme rainfall), others are already significantly different from preindustrial conditions (temperature, sea-level rise).
Many impacts are permanent or irreversible on a human timescale. Others are reversible but depend on the level of greenhouse gases (which may stay high for thousands of years).
Environmental, cultural, and economic systems are already impacted and impacts are expected to increase.
Uncertainty about future global emissions makes it hard to plan for impacts. The cumulative effects of different impacts are not known.
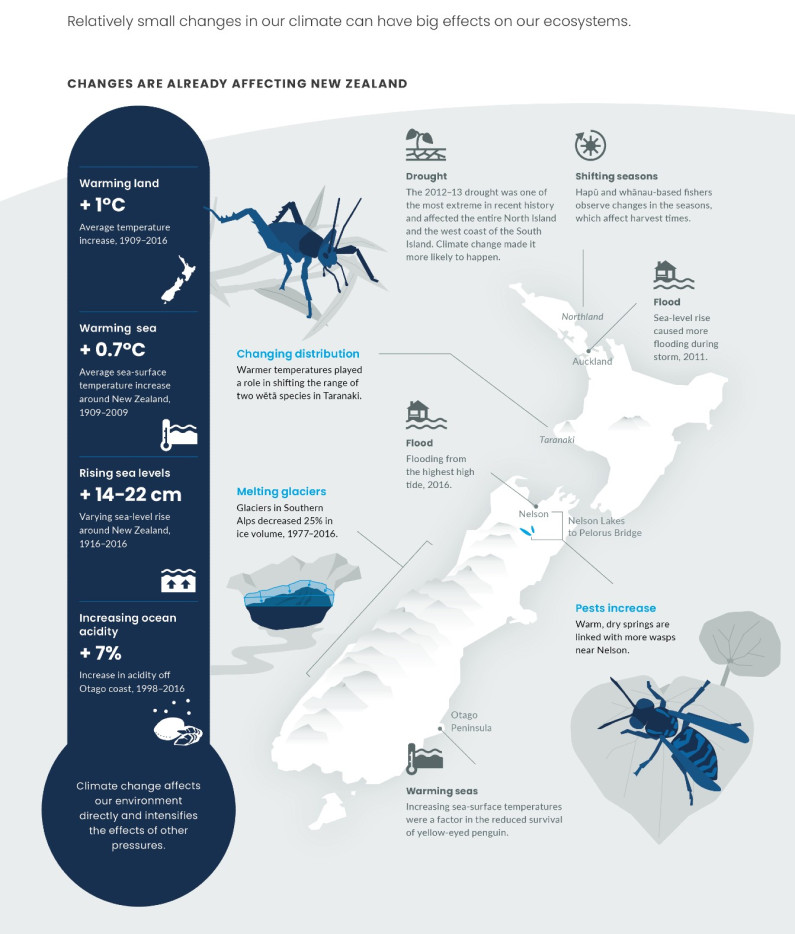
Many significant changes in New Zealand’s climate have already been observed across the country, but regional variations can also be seen, particularly for rain and snow fall. Changes include alterations to temperature, precipitation patterns, sea-level rise, and ocean acidification, wind, and sunshine.
Annual average land-surface temperature in New Zealand for 2018 tied for the second highest average since records began in 1909. Four of the past six years were among the warmest on record (NIWA, 2018). The average annual temperature has not been this warm in the past 10,000 years, which is likely to be near or already outside the range that humans and current ecosystems have experienced here (MfE, 1997).
Climate change is already impacting New Zealand, and the effects will intensify with time. For some impacts, such as changes in extreme rainfall events, changes to the baseline have not yet been detected. Other impacts, such as rising sea level, are already significantly different from pre-industrial conditions.
The following points illustrate the wide-ranging changes that have already been observed (for details see Our atmosphere and climate 2017):
New Zealand’s annual average temperature has increased by 1 degree Celsius between 1909 and 2016. (See indicator: Temperature.)
The number of frost days (below 0 degrees Celsius) decreased and the number of warm days (over 25 degrees Celsius) increased at about one-third of measured sites from 1972 to 2016. No statistically significant change was detected at about two-thirds of the sites. Where change was identified, it was skewed toward what would be expected in a warming climate – the number of warm days increased at eight sites and decreased at one, while the number of frost days decreased at 10 sites and increased at one. (See indicator: Frost and warm days.)
Since 1972/73, soils at around one-quarter of the monitoring sites around New Zealand have become drier. No change was detected at about three-quarters of sites, but where change was detected, it was skewed toward what would be expected in a warming climate – soil moisture decreased at seven sites and increased at one. (See indicator: Drought.)
From 1977 to 2016, our glaciers are estimated to have lost almost 25 percent (13.3 cubic kilometres) of their ice. The maximum volume of ice was recorded in 1997 and from then until 2016, 15.5 cubic kilometres of ice was lost, enough to fill Wellington Harbour 12 times. (See indicator: Annual glacier ice volumes.)
Coastal sea levels measured at New Zealand ports have risen 14–22 centimetres from 1916 to 2016, which is consistent with global trends. (See indicator: Coastal sea-level rise.) The rate of sea-level rise has increased in recent decades and some places like Nelson have experienced flooding during the highest high tides even in calm weather (MfE, 2017a).
The average sea-surface temperature around New Zealand increased 0.7 degrees Celsius from 1909 to 2009 (Mullan et al, 2010). (See indicator: Oceanic sea-surface temperature.) The greatest warming was off the Wairarapa Coast and off the northwest coast of the North Island. Slight cooling was found in the Southern Ocean off the Otago coast (Sutton & Bowen, 2019).
The subantarctic ocean off the Otago coast has become more acidic since 1998 (oceans acidify as they absorb carbon dioxide from the atmosphere). This site has the longest monitoring record in New Zealand. (See indicator: Ocean acidification.)
Between 1972 and 2016, extreme wind decreased at about one-third of sites across New Zealand (in frequency and magnitude). No change was detected at about two-thirds of sites. (See indicator: Extreme wind.)
From 1972 to 2016, sunshine hours increased at 27 out of 30 locations around New Zealand. (See indicator: Sunshine hours.)
From 1960 to 2016, most locations did not show changes in extreme rainfall. As at 2016, the proportion of annual rainfall occurring in intense events (in the 95th percentile) decreased at four of 30 locations (Auckland, New Plymouth, Rotorua, and Taupō) but increased at Napier and Timaru. (See indicator: Rainfall.) The inability to detect trends may be partly due to the short time period there is data for. This makes it difficult to detect changes in infrequent events, like extreme rainfall. Studies have identified that climate change played a role in recent flooding events in Golden Bay in 2011 (Dean et al, 2013) and Northland in 2014 (Rosier et al, 2015), and contributed to the cost of floods in the last decade (Frame et al, 2018).
Stopping further emissions will not return us to a normal climate. As discussed in Issue 8: New Zealand has high greenhouse gas emissions per person, carbon dioxide remains in the atmosphere for centuries to millennia and will affect our climate for generations to come. The risk of impacts generally increases as global temperatures increase, so as long as greenhouse gas concentrations remain elevated, the risk from extreme events like heat waves, droughts, and storms will be elevated. Other impacts can be considered permanent – erosion from extreme rainfall or species extinctions for example cannot be reversed.
There is also a lag of up to several decades between when greenhouse gases are added to the atmosphere and when impacts occur. This means that the climate will continue to warm and impacts will intensify for many years after global emissions are reduced.
Carbon dioxide and other greenhouse gases are building up in the atmosphere and causing changes to global climate. (See Issue 8: New Zealand has high greenhouse gas emissions per person.)
New Zealand’s position in the South Pacific does not isolate us from the risks posed by a warming climate. Many impacts, like rising seas and melting glaciers are already being experienced here. Others are expected to become important, including increased risk of extreme fires and storms. A warmed climate will impact us directly, from larger and more frequent floods and droughts for example, and indirectly through impacts to our economic, social, and cultural systems (New Zealand Climate Change Centre, 2014).
The changing climate will exacerbate the issues discussed in this report, placing additional stresses on already stressed systems. Projections for our future climate under different emissions scenarios are available from NIWA (Climate change scenarios for New Zealand).
Our long coastline and large areas of coastal land will be more affected by flooding and erosion in the future, affecting homes, habitats, and cultural heritage sites. Extreme coastal flooding, usually due to storm surges coinciding with very high tides, already contributes to disruption and damage in some low-lying places like South Dunedin (Our atmosphere and climate 2017).
With rising seas we can expect tides, waves, and storm surges to reach further inland more regularly, resulting in more frequent and serious flooding (PCE, 2015). Even a modest sea-level rise of 0.3–0.4 metres (which we may see by 2050–60) will mean that a previously rare 1-in-100-year storm-tide inundation would occur on average once a year (MfE, 2017a).
Sea-level rise will make coastal erosion worse. It will also make drainage for low-lying or coastal farms and urban areas more challenging. New risks, such as liquefaction during earthquakes, could also arise, as well as increased exposure to tsunami inundation. Salt water intrusion and erosion may cause ecosystems such as sand dunes, wetlands, mangroves, and estuaries (and their diverse habitats) to be reduced or lost (MfE, 2017a).
Warmer temperatures and reduced rainfall are projected to make water flows more variable, and to increase the demand for irrigation in some places (Rutledge et al, 2017). These changes may increase the time when there are low water flows or warmer water temperatures, which could affect our biodiversity and the native species that are not adapted to the new conditions.
The frequency and intensity of drought in drought-prone regions is expected to increase further, with potentially serious implications for our primary industries. This is expected to increase the demand for water by agriculture, resulting in competition for freshwater resources as well as pressure to develop water storage options, which again can affect river water quality and flows (Royal Society of New Zealand, 2016). (See Issue 6: Taking water changes flows which affects our freshwater ecosystems.)
Extreme rainfall events are likely to increase in most areas and could cause increased erosion and flooding. Computer models for Horizons Regional Council show that even with mild climate change, sedimentation in fresh water from erosion is likely to increase by at least 10 percent (Manderson et al, 2015). Increased sediment from increased erosion due to flooding and land-use change would also stress aquatic species. (See Issue 2: Changes to the vegetation on our land are degrading the soil and water.)
About two-thirds of New Zealand’s population live in areas prone to flooding (Waugh et al, 1997). Flooding can impact on housing, transport, energy, stormwater, and wastewater systems. Often, these areas also have long-lived infrastructure that is difficult to retrofit (Royal Society of New Zealand, 2016).
Many urupā (burial sites) are on river flood plains or coastal areas that could be subject to increased flooding.
A warmed climate will increase the risk of extreme fire weather. Most of New Zealand’s native forests have evolved without regular fires. Their recovery from a fire may take several centuries because of slow seed dispersal and the fact that the first vegetation to grow after a fire (eg shrubs) is more likely to burn again (Tepley et al, 2018). Loss of ecosystems and habitat from more frequent or intense fires could affect vulnerable species and biodiversity. Fires also increase our emissions because greenhouse gases are released and the carbon sink effect of the forest is affected.
Since plantation forests are a long-term investment and require about 30 years to grow to maturity, increased fire risk is an especially important issue facing the forestry industry. It is also significant because one important pathway to reducing greenhouse gas emissions is planting new forests.
Vulnerable native flora and fauna are already being affected. For example, warming temperatures were found to have played a role in shifting the distribution of two wētā species studied (Bulgarella et al, 2014). In another study, the number of invasive wasps in the Nelson area increased when springs were warm and dry (Lester et al, 2017).
Climate change is likely to have major impacts on many habitats and shift where some native species are found. Some species may survive by moving south or to higher altitudes, but others are expected to be lost from some places. We also expect large-scale changes in ecological communities and species interactions, as well as changes in seasonal activities such as flowering, breeding, and migration, but the extent of these is unknown (McGlone & Walker, 2011).
There is growing community recognition of these effects with kaitiaki, hapū, and whānau fishers noting seasonal shifts that are affecting local kaitiakitanga practices and harvest times, as well as in the indicators that signal them (Deep South National Science Challenge: vision mātauranga, 2018).
Stresses from climate change could also make ecosystems and organisms more susceptible to other disturbances like pollution and fire.
Increases in temperature could allow new exotic pests, weeds, and diseases to establish here. Subtropical and ‘sleeping’ pests (species that are already in New Zealand but could flourish with a change in climate) could spread and have significant impacts (Pearce et al, 2017).
We rely on international shipping for trade and are vulnerable to pests and diseases from America, Australia, and Asia carried in the ballast water and on the hulls of vessels from these more tropical waters (Gordon et al, 2010).
Risks from other unwanted pests could increase, including an increase in the abundance of a root-feeding nematode and a rise in the severity of Swiss needle cast disease (IPCC, 2014a). Human health could also be threatened by diseases new to this country (IPCC, 2014b).
Concerns are increasing about the impacts of coastal erosion and sea-level rise on cultural sites, including early settlement sites and burial grounds (McFadgen, 2007). As sites are lost to erosion or to the encroaching sea, we lose the knowledge they offer about early Māori and European settlement, and their impact on New Zealand’s ecosystems. We also lose our intergenerational connection to these spaces, along with the knowledge and understanding of those connections. Many coastal iwi and hapū have marae and other sites (eg urupā), important to the identity and well-being of their people, located in vulnerable areas.
A 2013 study of the impact of climate change on the archaeology of the Whangarei coastline suggested that detrimental impacts on archaeological sites were likely to increase in likelihood and severity. One-third of such sites were already threatened by other pressures. Middens containing pre-historic or historic domestic rubbish like discarded shells or animal bones, and smaller early Māori occupation sites, are particularly at risk (Bickler et al, 2013).
Increased storminess, changes in ocean currents, sedimentation, algal blooms, and marine pests may have compounding effects on New Zealand’s marine environment. Ocean acidification may cause widespread harm to our ecosystems, particularly to organisms with carbonate shells like pāua, mussels, and oysters. Ocean warming may affect ocean currents and modify habitats by expanding, reducing, or shifting the areas where certain species live. (See Issue 7: The way we fish is affecting the health of our ocean environment.)
These changes will bring challenges (and potentially opportunities) for industries like aquaculture and fishing, and affect recreational fishing. This is a significant issue for Māori who have substantial customary and commercial interests in our marine environment that are vital to supporting the health and well-being of iwi, hapū, and whānau. Any impact from invasive species or change in the quantity or distribution of any marine species will be economically important (MacDiarmid et al, 2013). Aquaculture and growers and harvesters of shellfish will be especially vulnerable to ocean acidification, reduced oxygen levels, increased water temperature, and increased run-off from flooding and erosion (MacDiarmid et al, 2013).
Sea-level rise has substantial implications for urban areas and infrastructure. Stronger and more frequent heat waves, coupled with the urban heat island effect will increase the incidence of heat stress, especially among vulnerable people (IPCC, 2014b).
More extreme weather events mean more cost to repair and upgrade infrastructure such as transport and communications networks, water supply, and waste systems. A recent report estimated that more than $2.7 billion worth of local government infrastructure is at risk from a sea-level rise of 0.5 metres, a level that could be reached as soon as 40–90 years (LGNZ, 2019; MfE, 2017a).
Our energy system and its infrastructure will also be impacted. Warmer temperatures and changes in rainfall patterns are likely to affect the supply and demand of electricity. More precipitation in the Southern Alps would increase hydro-generation, especially in winter, but more rain and less snow could create water shortfalls in summer and autumn when the need for irrigation is also greatest (Royal Society of New Zealand, 2016).
The insurance industry is also likely to be affected. Some places that flood repeatedly or are subject to other climate-related natural hazards may eventually become uninsurable. This is a particular issue for areas at risk from rising sea levels.
Agriculture and primary industries are likely to be strongly affected by climate change through an increase in climate variability, changed average rainfall and temperatures, and more extreme events (Climate Change Adaptation Technical Working Group, 2017).
There are likely to be more droughts and flood events. Droughts reduce the growth and yield of crops, and long dry spells can make plants wilt permanently. The timing of a drought makes a big difference to its effect. In late summer when plants have mostly finished growing for the season, a drought does not have the same devastating effect as a dry time in late winter or early spring, which cuts a plant’s productivity (Pearce et al, 2017). Floods can also affect the growth and yield of crops, as well as affecting the distribution networks needed to move goods to market.
The decreasing volumes of ice in our glaciers are affecting not only the environment around them but also related tourism. The West Coast’s Fox and Franz Josef glaciers have each retreated about 3 kilometres since 1940, despite a period of advance between 1980 and 2005 (Macintosh et al, 2017). In 2012 Fox Glacier and in 2014 Franz Josef became too dangerous for tourists, marking an end of almost a century of glacier guiding from the valley floor (Our atmosphere and climate 2017).
On the plus side, increasing temperatures will likely extend the growing season in parts of the country. Changes in temperature and precipitation patterns would also change the soil and the conditions for plant growth, potentially increasing the yields of pasture and forestry, and shifting the viable areas for crops like kiwifruit and maize (Rutledge et al, 2017; Tait et al, 2017).
This change could benefit some areas in the short term if sheep, beef, and dairy farms are managed to take advantage of a predicted increase in grass growth (Climate Change Adaptation Technical Working Group, 2017). Higher concentrations of carbon dioxide are also likely to increase pasture production on average by up to 4–10 percent for much of the country by 2050.
Warmer winter temperatures are also likely to result in less wood burning for home heating, which would improve air quality.
Read the description for Impacts of climate change
Relatively small changes in our climate can have big effects on our ecosystems
Changes are already affecting New Zealand
Warming land
Warming sea
Rising sea levels
Increasing ocean acidity
Climate change affects our environment directly and intensifies the effects of other pressures.
Drought
Shifting seasons – Northland
Flood – Auckland
Changing distribution – Taranaki
Flood – Nelson
Pests increase
Melting glaciers
Warming seas
The science underpinning projections of the impacts from a warmed climate is increasing every day but there are some areas where better knowledge is crucial to understand what we can expect.
The biggest gap in our knowledge relates to the total global emissions we can expect. The amount that the climate and oceans warm, and the impacts on New Zealand from these changes, is totally dependent on the concentrations of greenhouse gases in our atmosphere. The uncertainty of the global emissions trajectory makes quantifying and planning for projected impacts difficult.
Better information about cumulative and cascading impacts of climate change is also needed. For example, studies have assessed the effects of carbon dioxide on fertilisation for individual species and crops, but better knowledge about the interaction of all the factors that will affect their growth in a warmer climate is crucial. Increased carbon dioxide may increase plant growth, but less rainfall or fewer nutrients may partially or totally offset the increase.
There is a need for better information about the cascading effects brought about by climate change. An example is how flooding affects transport and distribution networks, which affect local businesses and government, and which in turn affect communities, whānau, and individuals (Lawrence et al, 2018). These issues have begun to be addressed, but a more thorough understanding of the complex impacts will improve our ability to plan for and adapt to projected changes in our climate.

Theme 5: Our changing climate
April 2019
© Ministry for the Environment