Theme 2: How we use our land

The way we use our land and the physical changes we have made to it affect our environment. Those effects continue to the waterways that drain the land, and include loss of ecosystems and habitat as well as reduction in the quality of our soil and fresh water. There are also consequences on our well-being, including the benefits (ecosystem services) we receive from nature, like flood control, water filtering, and soil retention.

Image: Photonewzeland
This theme focuses on two major changes that have been made to the land:
Building structures and changing the way we use land enable us to move around the country and generate electricity, as well as support industries like farming and aquaculture. Local changes, however, can have significant impacts when they are considered as a whole. One example is the collective impact of barriers, like culverts and dams in waterways, on our native fish (Franklin et al, 2018; Gluckman et al, 2017). (See Issue 1: Our native plants, animals, and ecosystems are under threat.) Another is the effect on our coasts of infilling harbours and estuaries to reclaim land (Our marine environment 2016).
Other parts of this report present different issues related to changes to our land:
Logging native forests, draining wetlands, and clearing land have degraded a range of benefits provided by native vegetation, accelerated our naturally high rates of soil loss, and affected our waterways.
About 40 percent of our land is now exotic grassland and is prone to erosion in susceptible areas.
About 65 percent of our native forest has been removed and 90 percent of our wetlands have been drained.
It is difficult to reverse as vegetation was removed to support the way we live and sustain our economy.
Loss of native forests and wetlands, and increased erosion are significant threats to our ecosystems, soil productivity, and the health of our freshwater, estuarine, and marine environments. This also impacts cultural practices and knowledge.
We lack monitoring data for erosion and information about the benefits of native vegetation and how well any interventions are working.
Land cover describes the types of vegetation and features that cover the land’s surface, like native and non-native (exotic) vegetation, water bodies, built environments, and bare natural surfaces (eg gravel and rock). National surveys of Aotearoa New Zealand’s land cover were carried out in 1996, 2002, 2008, and most recently in 2012. 2012. (See indicators: Exotic land cover, Indigenous land cover, and Urban land cover.)
As of 2012, just under half of our land area (49 percent) was covered by natural land-cover types (see figure 4). Native forest covered 26 percent of our land area, mostly in mountainous and hilly areas. Other native vegetation (like tussock grassland, scrub, and shrubland), water bodies, and naturally bare ground together accounted for the other 23 percent.
By contrast, 51 percent of our land area had modified land cover, like urban areas and exotic vegetation. Exotic grassland (pasture) was the largest single type of land cover in New Zealand and accounted for about 40 percent of our total land area. Exotic (plantation) forest covered about 8 percent of our land area, concentrated in the central North Island.
Note: All gross domestic product (GDP) figures are from the National accounts (Industry production and investment): year ended March 2017. These figures exclude manufacturing or processing of primary products. They are in current prices, ie not adjusted for the effect of changing prices over time. The people employed information is from linked employer-employee data (LEED). The measure is main earning source, by industry using New Zealand standard industry output categories.

Image: Manaaki Whenua – Landcare Research (Data source)
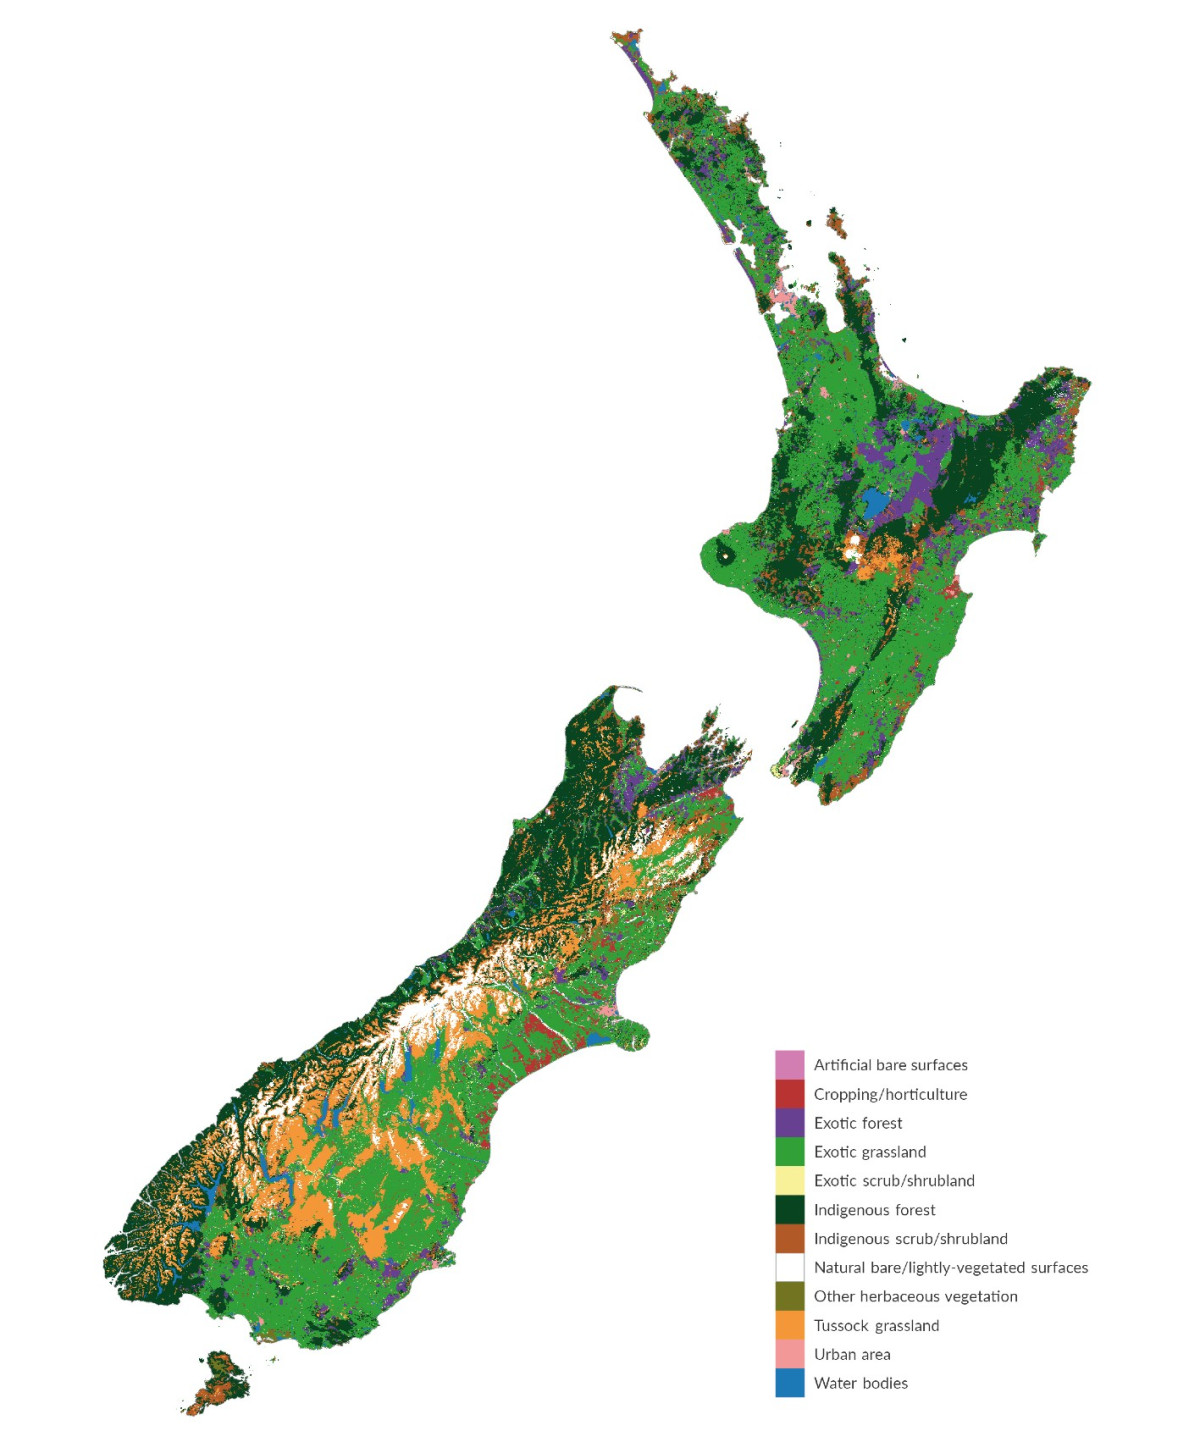
Image: Manaaki Whenua – Landcare Research (Data source)
Erosion risk varies from place to place, reflecting things we influence (land cover) and naturally variable factors like soil types, geology, topography (shape of the land), and rainfall.
As of 2012, approximately 5 percent of our land area was classified as highly prone to erosion, and 60 percent of highly erodible land was in the North Island. (See indicator: Highly erodible land.)
Seven regions (Gisborne, Manawatu-Wanganui, Canterbury, Hawke’s Bay, Southland, Northland, and Otago) had more than 1,000 square kilometres of highly erodible land in 2012 (see figure 5).
Erosion can happen in various ways. Landslide erosion occurs when a soil slope is destabilised during storm rainfall. Gully erosion begins at a gully head and expands up hillsides over decades. Earthflow erosion is the slow downward movement (approximately 1 metre per year) of wet soil slopes towards waterways. As at 2012, landslide risk applied to 77 percent of the highly erodible land in New Zealand.
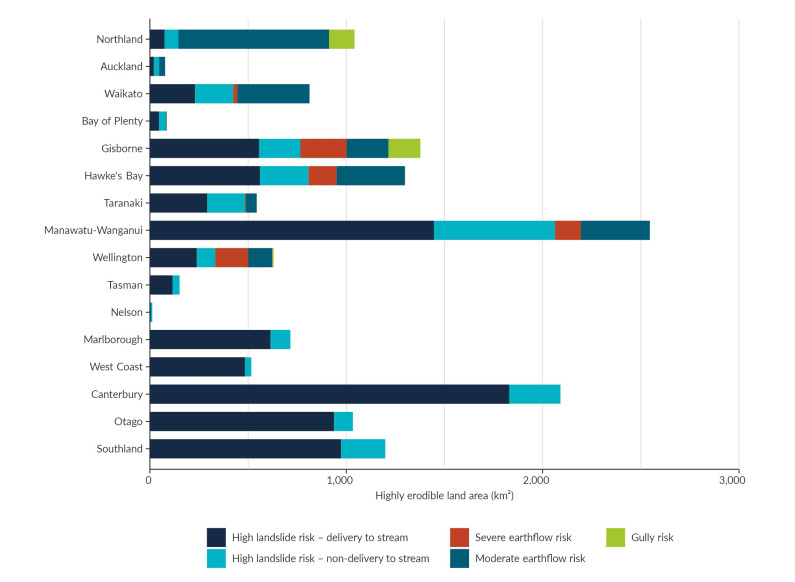
Image: Manaaki Whenua – Landcare Research (Data source)

Image: Manaaki Whenua – Landcare Research (Data source)
The vegetation on more than half our country has changed significantly since human settlement. (See Issue 1: Our native plants, animals, and ecosystems are under threat.) Native forests once covered about 80 percent of New Zealand’s land area – all but the tops of mountains and the wettest lowlands (Nicholls, 1980). About 65 percent of our original native forest has been removed.
Wetlands once covered about 10 percent of New Zealand’s land area, especially in coastal areas and lowlands. About 90 percent of these original wetlands have been drained. (See indicator: Wetland extent.)
The native vegetation cover has continued to decline, even in recent years – being converted to land cover like exotic grassland (pasture), plantation forestry, and urban areas. Between 1996 and 2012 there was a 1.3 percent loss of tussock grassland (reduced by 31,000 hectares), a 1.3 percent loss of indigenous shrubland (reduced by 24,000 hectares), and a 0.2 percent loss of native forests (reduced by 16,000 hectares). (See indicator: Indigenous land cover.)
Wetland loss has also continued (Belliss et al, 2017). Between 2001 and 2016, 214 wetlands covering nearly 1,250 hectares were lost, with a further 746 wetlands declining in size. The regions with the greatest number of wetlands lost or declining were Canterbury, West Coast, Southland, and Auckland. Most of our large remaining wetlands are in public ownership, but the vast majority of smaller wetlands are surrounded by farmland in private ownership (Myers et al, 2013).
Shifts between types of exotic land cover also occurred between 1996 and 2012. The main changes were from exotic grassland and shrubland to exotic forest (some exotic forest conversion to grassland and shrubland) and a 10 percent expansion in urban land cover.
These shifts have occurred at different rates between the national surveys in 1996, 2001, 2008, and 2012. For example, cropland expanded between 1996 and 2001, but more so between 2001 and 2008. Between 1996 and 2001, the area covered by exotic forest increased by more than 10 percent (expanded by 194,000 hectares). In recent years deforestation and conversion to other land uses have exceeded new tree planting, so between 2008 and 2012 the area of exotic forest decreased by about 1 percent (declined 24,000 hectares) (see figure 6).

Image: Manaaki Whenua – Landcare Research (Data source)
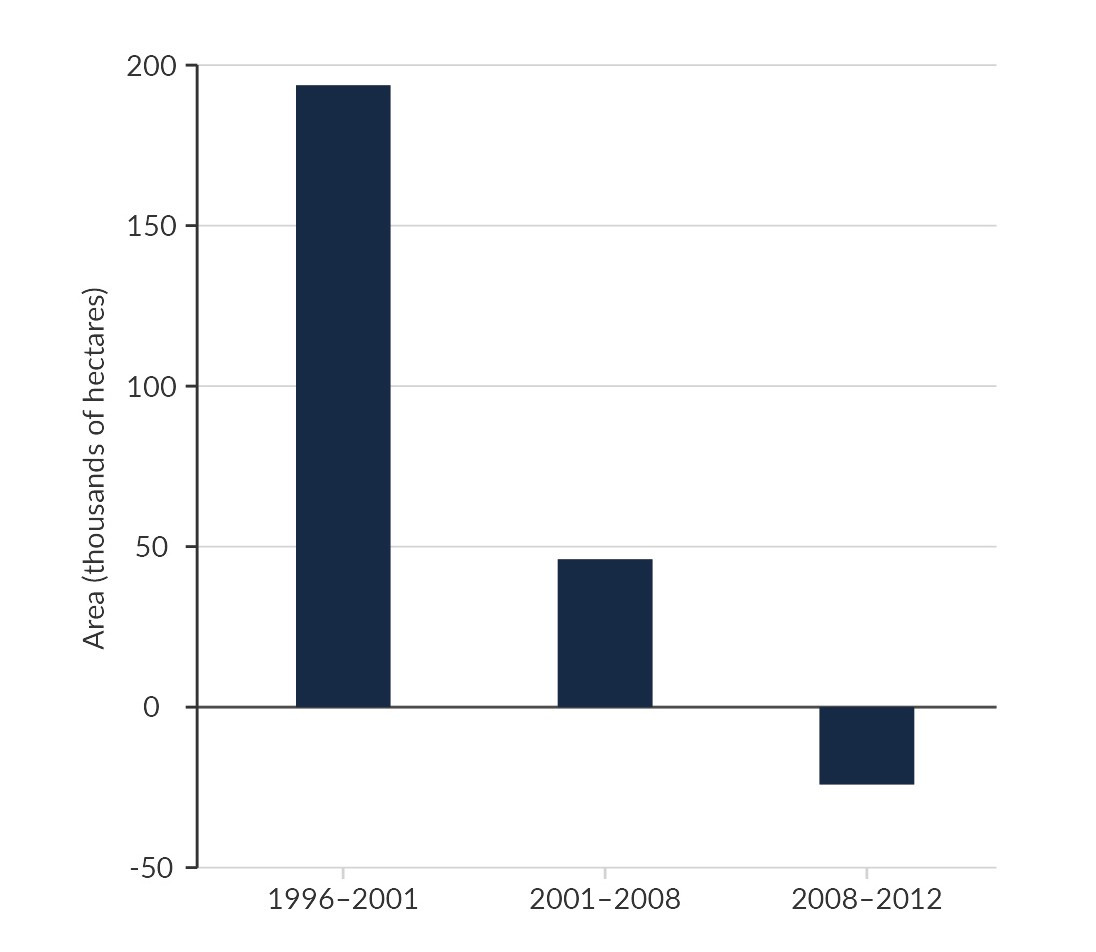
Image: Manaaki Whenua – Landcare Research (Data source)
To support the way we live and grow our economy, we have increased the cover of exotic forestry. Once planted, these forests have some similar characteristics to the native forests they replace. But it is during harvesting that this change in land use can have consequences, particularly on the state of highly erodible land.
Clear-felling (the method used to harvest forests in New Zealand) exposes and disturbs soil, including from the construction of roads used for vehicle access during harvesting. This soil exposure and disturbance can increase erosion and the amount of sediment entering our waterways. Hilly land that is prone to erosion is particularly vulnerable for up to six years after harvest, until newly planted trees have grown enough to provide a canopy over the replanted area (Marden & Rowan, 1993).
Agriculture is one of the largest industries in the tradable economy. To support grazing, land has been converted, wetland areas have been drained, and grass and legumes planted.
Exotic grasslands are markedly different to native forests in the ecosystem services they provide, as well their susceptibility to erosion. Streams in farmed areas typically receive higher run-off (loss of water from the land that may transport eroded soil), particularly where riparian vegetation has been removed. This is because pasture intercepts less rain than forest vegetation and grazing livestock can compact the soil. Livestock can also cause damage to stream banks, channels, and riparian areas (McDowell & Wilcock, 2008).
The New Zealand empirical erosion model (NZEEM) has been developed to estimate New Zealand’s annual soil erosion, taking account of land cover, the location of highly erodible land, and average annual rainfall (Dymond et al, 2010). In the absence of measured data, NZEEM provides estimates of soil erosion. The modelled rate of soil erosion is 720 tonnes per square kilometre per year, with similar rates in the North and South islands. (See indicator: Estimated long-term soil erosion.)
The modelled soil erosion is especially high in two parts of Aotearoa New Zealand, but for different reasons (see figure 7). In Gisborne, the lack of woody vegetation (shrubs and trees), combined with the area’s geology (steep slopes and loose soils), result in high soil erosion rates. On the west coast of the South Island, despite the high proportion of native forest cover, the region’s naturally high rainfall and mountainous terrain account for high rates of soil loss.
Expanding areas of exotic grassland since humans arrived in New Zealand have accelerated our natural high rates of erosion and soil loss. NZEEM estimates that of the 192 million tonnes of soil lost annually into waterways, 44 percent of the sediment comes from land covered in pasture (Our land 2018).
Soil productivity may be affected when the topsoil is lost. Topsoil lost in landslides can result in degraded soil and lost pasture productivity that may not be regained in our lifetimes (Lambert et al, 1984; Rosser & Ross, 2011). Reduced soil productivity can lead to a greater demand for nutrients (typically through fertiliser), which brings an added financial and environmental burden. The economic losses associated with soil erosion and landslides are estimated to be at least $250–300 million a year (Page, 2015).
Increased erosion and soil loss can also increase the concentration of sediment in our rivers, lakes, and coastal environments. (See Issue 4: Our waterways are polluted in farming areas.) Excess sediment can inhibit growth of aquatic and marine plants, and algae, damage the structures that marine animals use to respire (like fish gills) (Lowe et al, 2015), smother seabed habitats (Clapcott et al, 2011), degrade aesthetic values and recreational use, and increase the risk of flooding in towns and cities (Davies & McSaveney, 2011).

Image: Manaaki Whenua – Landcare Research (Data source)
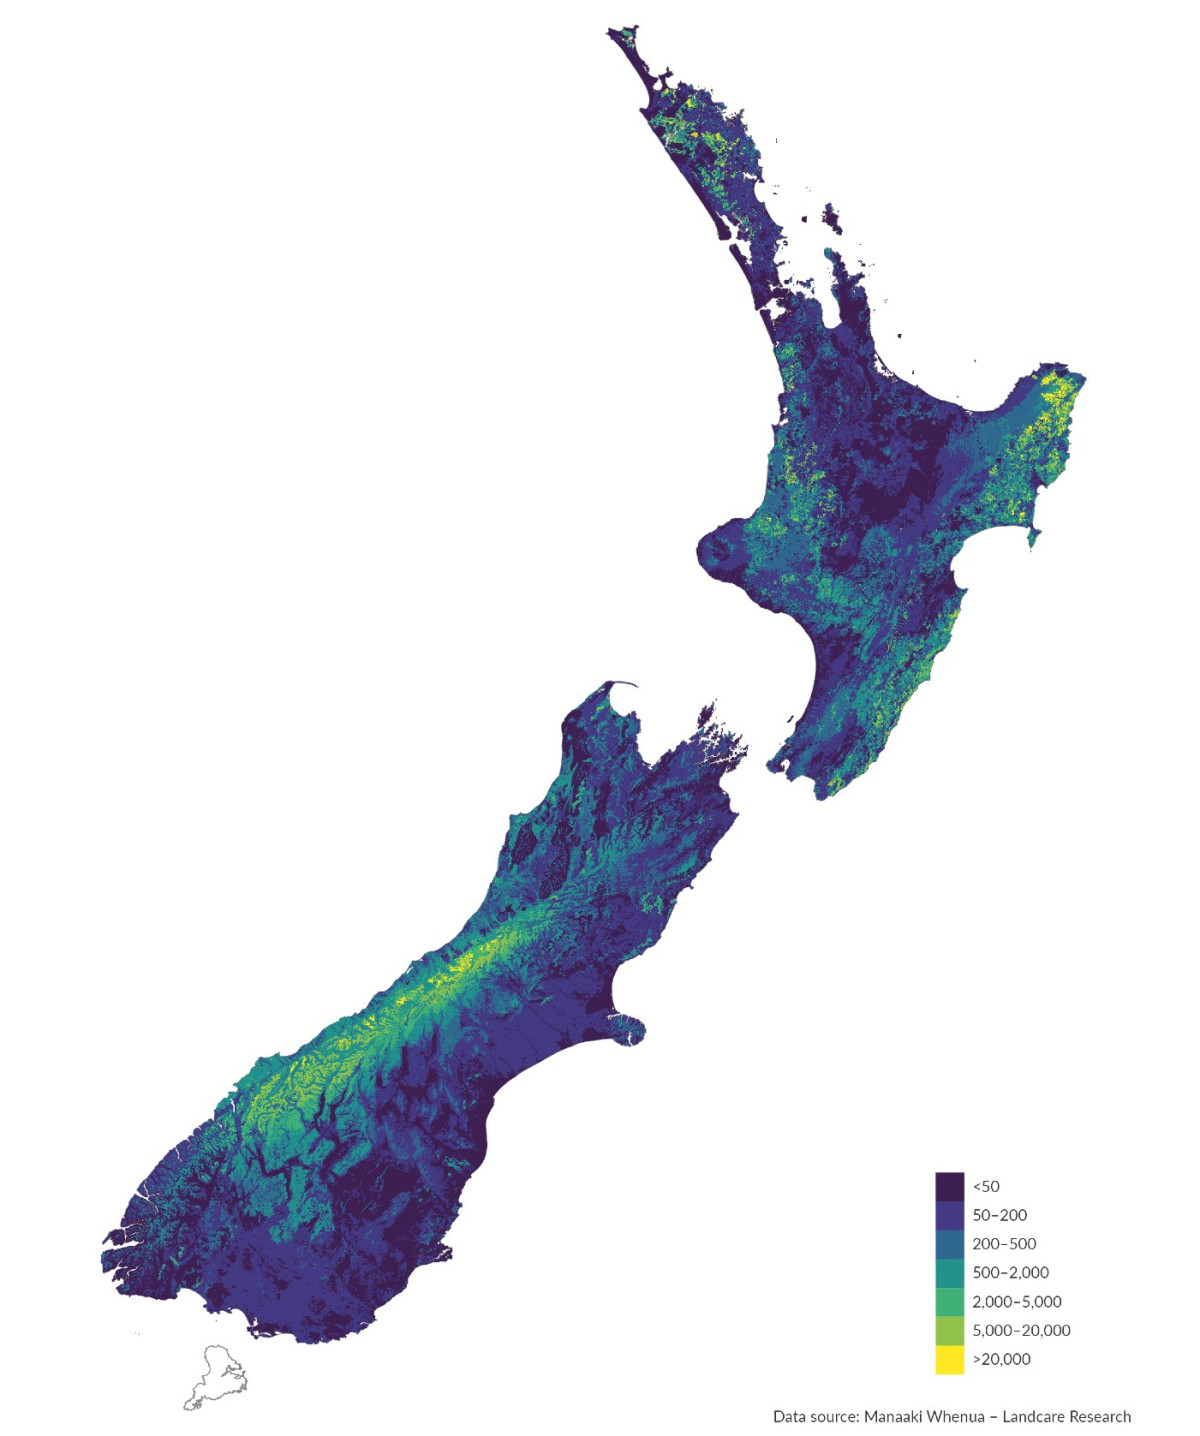
Image: Manaaki Whenua – Landcare Research (Data source)
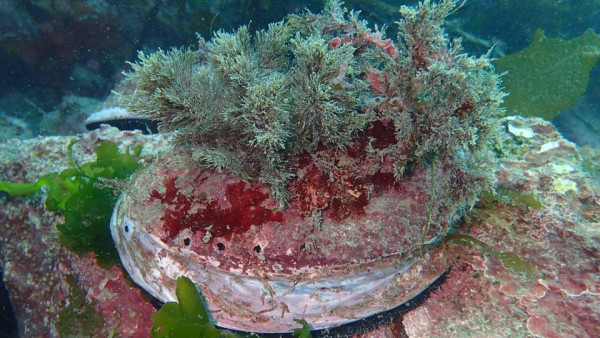
Pāua are found on our rocky shores. Photo credit: Claire Murphy
Pāua are deserving of their place in New Zealand culture as a Kiwi icon. They are valued as a taonga (treasure) and a source of mahinga kai by Māori and other fishers. Lining the rough exterior of their shell is the iridescent blue and purple material beloved of jewellers and Māori carvers.
Commercial fishers harvest the larger black-foot pāua (Haliotis iris). Pāua is exported to China, Malaysia, Singapore, and Hong Kong, with a growing interest in live exports. Also, since abalone is a delicacy in China, tourists often enjoy our pāua in Chinese restaurants when they visit New Zealand.
As large sea snails, pāua live on rocks near the shore and use a radula (tongue) to scrape algae off the rocks and cut pieces of kelp (especially the giant kelp Macrocystis pyrifera) down to an edible size. Kelp beds create calmer areas for larvae and young pāua, and provide habitat for other species like kina, rock lobster, and blue cod. Pāua thrive in clean, clear water – the most productive pāua fisheries are on exposed coasts beside land covered in native forest.
In the Marlborough Sounds, large areas of native vegetation have been replaced with plantation forests – more than 17,000 hectares in 2017 (Ulrich, 2017). When these trees mature and are harvested, the bare soil is exposed to wind and rain for several years until new trees have grown. This increases erosion (particularly on steep sloping sites) and the risk of sediment being carried down streams into the sea.
Once in the water, sediment has a number of negative effects – settling on kelp and reducing its health, smothering young pāua, hindering the growth of adult pāua, and making it difficult for larvae to settle. Sedimentation can also make pāua easier to dislodge from rocks and therefore more vulnerable to predators. The impacts of sedimentation also have an economic cost and are thought to be a factor in an estimated loss of quota value of about $20 million for the pāua fishing industry nationwide for 2001–14 (Larned et al, 2018a).
Pāua and kelp are also affected by fishing and climate change (warmer temperatures and acidification). In response to these compounding pressures, Moana New Zealand (New Zealand’s largest Māori-owned fishing company) piloted an ecosystem service review to identify threats to the pāua ecosystem (Aotearoa Fisheries Limited, 2014). This was aligned with Moana’s strong belief in their role as kaitiaki (guardians) of the sea for future generations, and a world first for a commercial fishery.
The review identified sedimentation from human activities as a significant risk for pāua fisheries. It also raised the importance of understanding the compounding pressures on the ecosystem; managing customary, recreational, and commercial pāua fishing; collaborating on complex resource management challenges; and calculating the monetary loss of ecosystem services.
Awareness of the impacts of logging on marine ecosystems has since grown, and recommendations for better forestry practices were proposed in a Scion report to Marlborough District Council’s Environment Committee in December 2015 (Ulrich, 2017). These recommendations included not logging to the water line, using different harvest methods, and retiring the steepest and most erosion-prone land. The draft Marlborough Environmental Plan proposes prohibiting harvesting within 200 metres of the coast.
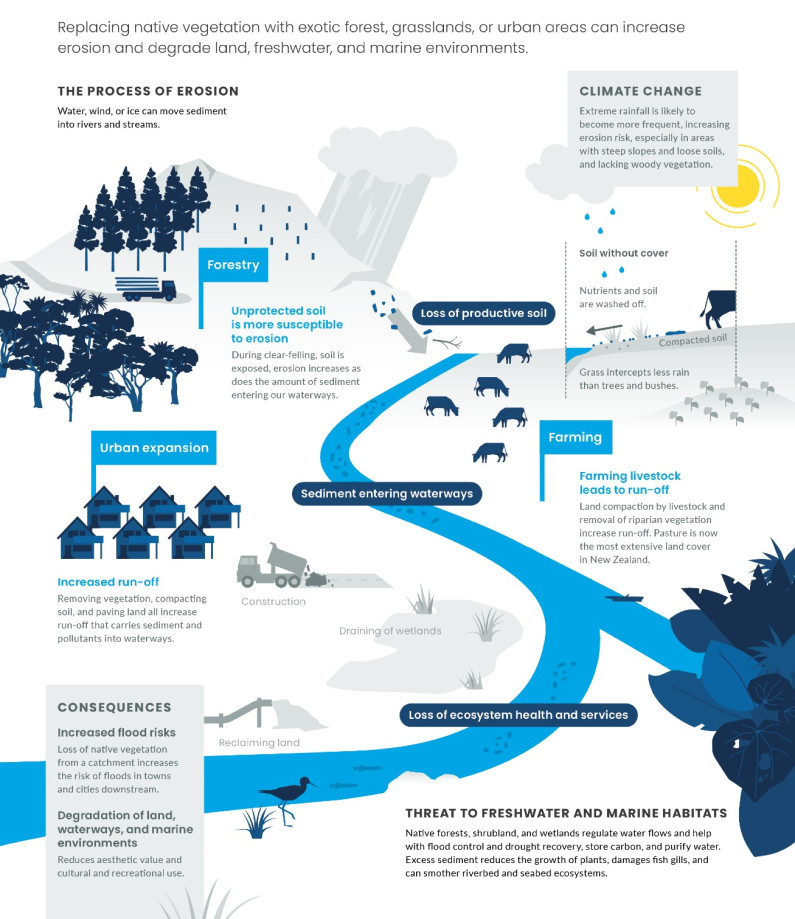

Read the long description for The changing way we use our land
Replacing native vegetation with exotic forest, grasslands, or urban areas can increase erosion and degrade land, freshwater, and marine environments.
The process of erosion
Climate change
Forestry
Farming
Urban expansion
Consequences
Threat to freshwater and marine habitats
Native forests, shrubland, and wetlands provide us with a wide range of ecosystem services. These benefits include regulating the flow of water in rivers and streams, storing carbon, purifying water, and providing habitats for native species (Patterson & Cole, 2013). Both historic and recent changes in land cover have serious impacts on our biodiversity and ecosystems as native habitats are lost and degraded. (See Issue 1: Our native plants, animals, and ecosystems are under threat.)
Wetlands are one example. Our remaining freshwater wetlands were estimated to provide benefits with an estimated value of more than $5 billion per year in 2012 (Patterson & Cole, 2013). Those with the highest estimated value included flood control, drought recovery, aesthetic and scientific value, and water purification (Clarkson et al, 2013). A compounding issue is that draining one wetland often affects the integrity of any remaining neighbouring wetlands.
Transformation of the land continues to have a significant effect on Māori culture. Māori communities see land and all it produces as a source of cultural identity and mana (Smith et al, 2017) and integral to the spiritual well-being of people (Harmsworth & Awatere, 2013).
A te ao Māori view expressed through ki uta ki tai (from the mountains to the sea) highlights that effects are felt (and accumulate) from the mountains to estuaries, coasts, and marine environments. When ecosystems and biodiversity have been degraded, there is a corresponding effect on the extent, quality, and access to customary resources.
Māori see a need for improved provisions for tangata whenua to restore connections between iwi and hapū and their environments, and enable Māori participation in decision-making at all levels (Ruru et al, 2017).
While there are national models that estimate erosion risks and rates, there are very few sites where erosion is actually measured. Without data collected at a sufficiently fine scale and over time (such as long-term trials and field sites), there is limited understanding of what is happening, where, and to what extent. The extent of human-induced erosion as opposed to that resulting from natural processes, like strong earthquakes or intense rainfall events, is also not well understood.
Without measured data on erosion rates, there is also limited quantitative understanding of how effectively mitigation strategies, like riparian planting and soil conservation planting, are working.
More research is also needed to account for other factors that affect erosion rates to anticipate changes that may occur in the future. For example, the more frequent and intense rainfall projected for parts of the country from climate change is expected to increase erosion, predominantly in our steep hill country.
We know that ecosystems provide benefits that contribute to our well-being. While we have some high-level understanding of which ecosystem services are provided by native vegetation (eg erosion control, carbon sequestration, recreation) we cannot easily quantify them. This is due to the variety of ecosystems and dependencies. For forest cover, it is even harder to separate the level of services provided from indigenous versus exotic species.
There are also some ecosystem services that we know little about. For example, the benefits provided by native species are likely to underpin many recreational and (eco) tourism opportunities, but these benefits have not been measured or quantified.
The effects of this issue on te ao Māori are recognised but have not been assessed or reported with enough detail. We also have limited information about the impacts of sedimentation on the special and significant interests Māori have in coastal ecosystems, particulary at important customary and commercial fishery sites.
Growth of urban centres has led to land fragmentation and threatens the limited supply of versatile land near Auckland and other regional centres.
It affects all our urban areas and surrounding environments.
The modifications to land cover and loss of biodiversity are significantly different to natural conditions.
Changes to the landscape and loss of natural vegetation may be irreversible.
It can affect our well-being, future food production, and native biodiversity on the urban edges.
Lack of up-to-date information on the size of urban areas, where they are growing, and how fast, limits our ability to manage the impacts of growth.
Most New Zealanders live in cities – according to 2018 population estimates, 86 percent of us live in urban areas (Stats NZ, 2018a). This proportion has remained relatively constant since 1991.
Our urban areas make up a small proportion of our total land area. In 2012, 0.85 percent (approximately 228,000 hectares) of the country was classified as having urban land cover. (See indicator: Urban land cover.)
Land that has been developed for urban use is very different from its natural condition. Not only is native forest removed, but wetlands are often drained – natural land cover is usually reduced to less than 2 percent in urban centres (Clarkson et al, 2007).
Most urban centres have developed on our best land. They are often located on fertile floodplains near the coast, which were historically chosen for their strategic location in good harbours, giving access for overseas trade, productive land, and local markets.
Our most productive land can be called versatile land, high-class land, and land with elite or high-class soils. These terms can all mean different things.
The New Zealand Land Resource Inventory (Manaaki Whenua – Landcare Research, 2010) classifies land into eight classes of land-use capability based on a range of factors that include soil type, terrain, and climate (Lynn et al, 2009).
Class 1 land is generally considered to be the most versatile with no limitations on use. Class 2 land is very good land with slight physical limitations to arable use, and class 3 land has moderate limitations for arable use. In this report ‘versatile’ is used to mean classes 1 and 2 land.
The area of urban land increased by 10 percent between 1996 and 2012 to approximately 228,000 hectares. The largest expansion was in Auckland (up 4,211 hectares), followed by Waikato (up 3,900 hectares) and Canterbury (up 3,829 hectares). (See indicator: Urban land cover.)
Between 1990 and 2008, 29 percent of new urban areas were on ‘versatile’ land (see Versatile land below). This type of land has many potential agricultural uses and is highly productive (Our land 2018). The largest areas of versatile land converted from agricultural to urban use were in Canterbury (4,800 hectares) and Auckland (2,600 hectares) (Andrew & Dymond, 2013).
Between 1990 and 2008, 0.5 percent of New Zealand’s total versatile land area was converted to urban land (Andrew & Dymond, 2013). Although this figure does not seem large, land with a favourable climate that has easy access to markets for perishable produce, is our most valuable versatile land. This is the land that is being converted to urban use.
The fringes of urban areas are increasingly being broken into smaller land parcels, or fragmented and sold as lifestyle blocks.
The number of lifestyle blocks has increased sharply in recent decades. A 2013 study showed that 175,000 lifestyle blocks occupied 873,000 hectares of land in 2011. Of these, more than 40 percent had been established since 1998 – an average of 5,800 new blocks a year (Andrew & Dymond, 2013). Seventeen percent (148,000 hectares) of these lifestyle blocks were located on versatile land, which represents a loss of 10 percent of all versatile land in New Zealand.
Land fragmentation has been identified as an issue in Northland, Auckland, Waikato, Bay of Plenty, Gisborne, and Tasman regions (Rutledge et al, 2015).
Urban expansion is mostly driven by population growth. Between 2008 and 2018 our population increased by 14.7 percent (Stats NZ, 2018a). Growth is expected to continue – projections estimate New Zealand’s population may reach 5 million in the next five years (Stats NZ, 2016). Population growth is projected to be higher in Tauranga, Auckland, and Hamilton, and lower in Wellington and Dunedin (NZPC, 2017).
The population of our urban centres has been growing faster than our rural areas. Between 1996 and 2006, the total population growth rate in our main urban centres was higher than the overall population growth rate (Stats NZ, n.d.-b).
Our growing population, coupled with the Kiwi dream of a ‘quarter-acre section’ (rather than an inner-city apartment), has created pressure on the boundaries of our urban areas. Some city dwellers have also decided that the urban environment does not meet their needs and have embraced country living on a lifestyle block.
A 2013 study found that 35 percent of Auckland’s versatile land was used as lifestyle blocks (Andrew & Dymond, 2013). Although the fragmentation of land is legally reversible, it is not often practical to do so because the value of a property increases when land is converted from agricultural use to a lifestyle block (Andrew & Dymond, 2013; Curran-Cournane et al, 2018).
Land fragmentation does not necessarily lead to a complete loss of productivity – some food production often occurs on small pieces of land. In this context, however, the issue is concerned with the fragmentation of land to lifestyle blocks where the use of the land is considered ‘non-economic’ and “revenues from production are likely to be insufficient to cover the costs of the property” (Andrew & Dymond, 2013).
Historically, vegetables have been grown on productive soils close to major urban centres. There are provisions in the Resource Management Act 1991 to protect the life-supporting capacity of soil (noted in Part 2 of the Act). However, urban growth has resulted in the loss of some of our most versatile land, making it unavailable for growing food. Versatile land represents just over 5 percent of our total land area (Rutledge et al, 2010) and, so, is a scarce resource.
The loss of versatile land is happening at the same time as our food production system is under pressure to increase production without increasing its effect on the environment (Curran-Cournane et al, 2016). Food production is recognised as the largest cause of global environmental change and significant modifications to food production are needed to meet increasing demand (as populations grow) while also being sustainable (Willett et al, 2019).
A further consequence of losing versatile land out of production is that it can force growers onto more marginal land that is naturally less productive and requires more inputs (like fertiliser) or changes in methods for the same production (Andrew & Dymond, 2013). Shifting production further from urban centres or onto lower-quality soils also has economic and environmental consequences by increasing transport costs.
Urban growth causes a dramatic change in land cover and is often responsible for reduction in habitat. In New Zealand, native land cover accounts for less than 2 percent of land in urban centres and only 10 percent on the urban-rural boundary (Clarkson et al, 2007). This loss of native vegetation often results in the loss of native species and an increase in non-native species (Grimm et al, 2008; McKinney, 2006).
Many of the plants and animals people bring with them to cities can also increase the pressure on native biodiversity. For example, cats can hunt native animals (Flux, 2007; Baker et al, 2005) and while gardens and urban planting can be a place for native flora, they are also a source of non-native plants that can become problematic weeds if they spread to native areas (Sullivan et al, 2005). Some pest mammals, like rats and mice, are particularly well adapted to life in urban environments. This can increase predation and other issues for native plants and animals that live in and around urban areas.
Urban areas are also a source of pollutants that can have a negative impact on the condition of some ecosystems. (See Issue 5: Our environment is polluted in urban areas.)
The reduction of vegetation and biodiversity in our urban areas (and their fringes) can have negative impacts on our well-being. Having access to green spaces is known to improve the physical and mental well-being of people living in cities (Fuller et al, 2007; Taylor & Hochuli, 2015).
Converting horticultural and agricultural land at the urban-rural boundary to urban use reduces job opportunities and ready access to fresh fruit and vegetables. Because of the irreversibility of this conversion, it also has the potential to limit the options for future generations (Curran-Cournane et al, 2016).
Another consequence of the proliferation of lifestyle blocks is ‘reverse sensitivity’ where new rural land owners discover that rural life includes dealing with noise, animal odour, and crop spraying on neighbouring properties. Restrictions placed on agricultural and horticultural operations as a result can affect their productivity (Andrew & Dymond, 2013).
Monitoring actual changes as opposed to planned urban extent is challenging and is usually based on satellite imagery or aerial photography. The information we currently have on the area of urban land in New Zealand is based on the Land Cover Database – its most recent update (version 4.1) only provides data up until 2012 (Manaaki Whenua – Landcare Research, 2015). This limits our understanding of the extent of urban areas, how much they are expanding, and where they are expanding. It also limits our understanding of the impacts urban expansion is having on our access to the most productive soils.
The impacts of land fragmentation are difficult to quantify. While we have some information that details the development of lifestyle blocks, we do not have information on the productivity of lifestyle blocks or the impacts on food production on the environment.

Theme 2: How we use our land
April 2019
© Ministry for the Environment