Theme 4: How we use our freshwater and marine resources

Natural resources are essential for our modern way of life and we use them in an astounding number of ways. Some resources regenerate naturally but others, like fossil fuels, are not easily replaced. If we take too much from the environment, the use of a resource becomes unsustainable. This can affect natural systems and deny future generations the same opportunities and benefits from nature that we enjoy today.

Image: Nature’s Pic Images
This theme examines two activities where our use of a natural resource is affecting how the environment functions, and changing our relationship with it:
Other natural resources we use or have previously harvested include trees and wildlife from native forests, whitebait (the juveniles of five species of native fish), and fish that live in both ocean and freshwater environments like tuna (eels). These flora and fauna are all taonga for Māori and contribute significantly to people’s livelihoods and well-being. The extraction of oil, gas, and other minerals from land and marine areas, and extracting gravel from riverbeds, are not mentioned in this report.
For other issues connected to our use of natural resources see:
Using freshwater for hydroelectric generation, irrigation, domestic, and other purposes changes the water flows in rivers and aquifers. This affects freshwater ecosystems and the ways we relate to and use our waterways.
Taking water for irrigation happens nationwide but mainly in Canterbury and Otago at a large scale; hydro dams are nationwide.
The total consented water extraction from some catchments can exceed the mean annual river flow expected under natural conditions.
Difficult, because farming is important for the economy and requires irrigation. Dams reduce our need to use fossil fuels for electricity generation and hence reduce carbon dioxide emissions.
Taking or diverting water at unsustainable levels affects ecosystems and can affect cultural values, identity, and the maintenance and transmission of traditional knowledge.
There is a lack of information on how much water we take relative to how much is available, and how changes in flow caused by over-extraction will lead to wider impacts on the things we value.
New Zealand has plenty of fresh water. Lakes contain approximately 320 billion cubic metres and aquifers 711 billion cubic metres, and about 440 billion cubic metres flow in rivers and streams each year (Our fresh water 2017). About 70 percent of our groundwater – 519 billion cubic metres in 2014 – is located in Canterbury. (See indicator: Groundwater physical stocks.)
We are also heavy users of fresh water. In 2014, New Zealand’s consented water allocation per person was 2,162 cubic metres (OECD, 2018). This can lead to situations where there is not enough to meet all our demands.
Consents (permits) to take water are managed by regional authorities that allocate water for hydroelectric generation, irrigation, drinking water, industrial, and other uses (see figure 16).
The quality and completeness of data on actual water use (as opposed to consented volumes) is inconsistent across the regions, so it is not possible to evaluate the actual metered water takes at a national scale in this report (see Where are the gaps in our knowledge about this issue?).
Hydroelectric generation is an important consented use of fresh water. Electricity is generated at about 100 sites nationwide but is dominated by large power stations like Manapouri (MBIE, 2018). Some of our major river systems like the Clutha, Waikato, and Waitaki have multiple dams.
Aside from hydroelectricity uses, there were 10,900 consents to take groundwater and 5,100 consents to take surface water in the 2013/14 water reporting year. Surface water allocation was 74 percent of the total water allocated nationally, with the remainder from groundwater. (See indicator: Consented freshwater takes.)
Nationally, aside from hydroelectricity, most of the allocated water use was for irrigation (51 percent). Household consumption made up 14 percent, and industrial use made up 13 percent (see figure 17). Household consumption includes the water we use for drinking and sanitation. There is no national data for consents to take water for bottling and sale but, as at 2017, water bottling consents made up less than 0.1% of all active consents to take water in Canterbury (Environment Canterbury, 2018).
Regional councils set limits or restrictions on consents to take water to manage allocation. Individual consents to take water have specified conditions, such as how much water can be taken, from where, at what rate, and at what times. Regional councils also limit the total consented allocation within catchments or water management zones. In 2010 for example, 10 of the 29 allocation zones in Canterbury were fully allocated and 6 were above 80 percent of the allocation limit (Kaye-Blake et al, 2014).

Image: NIWA (Data source)
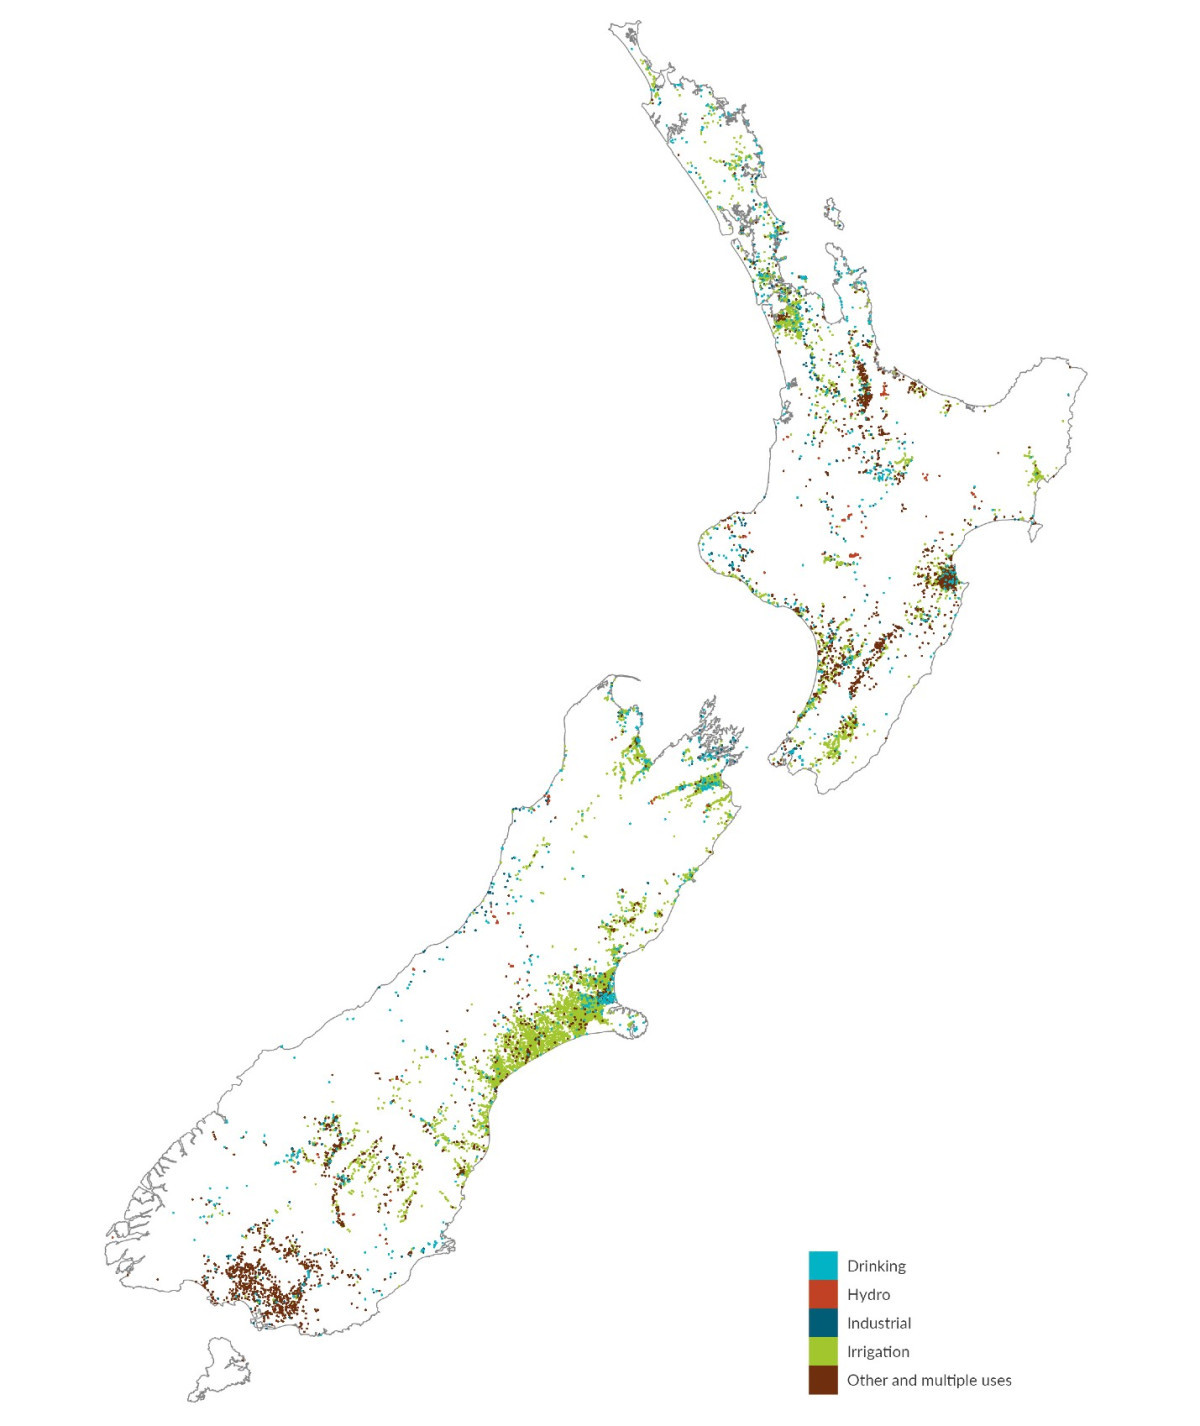
Image: NIWA (Data source)

Image: NIWA (Data source)
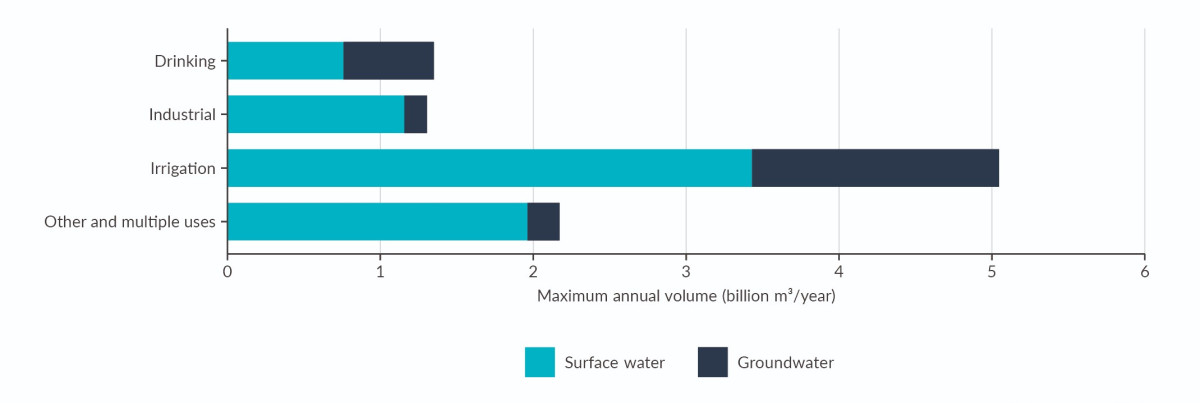
Image: NIWA (Data source)
Recent data on changes in consented water takes over time is not presently available.
Data on actual water use is not available nationally, so changes in the volume of water extracted cannot be assessed.
Large-scale irrigation began in the 1930s, supported by government schemes that included building storage dams. Central government investment continued until the 1970s but from the 1980s the demand for more irrigation was mostly driven by farmers (Heiler, 2008).
The area of irrigated agricultural land almost doubled between 2002 and 2017 from 384,000 hectares to 747,000 hectares – a 94 percent increase. Irrigated land area rose in every region during this time but the total increase was largely due to the almost doubling of irrigated land in Canterbury (241,000 to 478,000 hectares). In 2017, 64 percent of New Zealand’s irrigated agricultural land was in Canterbury. (See indicator: Irrigated land.)
Hydroelectricity generation now provides 55–60 percent of our electricity (MBIE, 2018). This renewable energy lessens our reliance on fossil fuels and contributes to reductions in our greenhouse gas emissions.
The first hydroelectricity schemes were built in the early 1880s. New schemes continued in the 20th century, including after World World II in response to a shortage of energy. The 1950s, ’60s and ’70s saw dams built on the Waikato, Waitaki, and Rangitāiki rivers. In 1990, a dam was built at Clyde on the Clutha River. No new large hydroelectric dams have been built since the 1990s (Martin, 2010).
A shift from sheep and beef farming to dairy farming and an increase in the number of animals per hectare (see Issue 4: Our waterways are polluted in farming areas) have increased the demand for water. These changes in livestock type have been especially marked in the South Island, most notably Canterbury and Southland.
In 2017, dairy farming accounted for 59 percent of the irrigated agricultural land area in New Zealand. (See indicator: Irrigated land.) Other types of livestock farming accounted for 17 percent of irrigated agricultural land, with 24 percent used for grain, vegetables, fruit, and other horticulture.
If you are on a mobile device, you can view the graph better on the StatsNZ website.
Between 1995 and 2014, the average annual volume of precipitation (rain, hail, sleet, and snow) that fell in New Zealand was 549,392 million cubic metres. Nationally, the annual precipitation was less than this average in nine of the years between 2000 and 2014 (with regional variations), likely as a result of natural periodic climate patterns (Stats NZ, 2018b, see System of Environmental-Economic Accounting (SEEA) water physical stock account).
In dry years, more irrigation may be needed to sustain farming operations. Taking more water during years with low rainfall could lead to issues relating to low river flows or less groundwater availability. However, the data available suggests that New Zealand’s total freshwater balance remained relatively constant between 1994 and 2014 (see SEEA water physical stock account). For example, the estimated volume of groundwater varied by less than 2 percent across all regions during this time period. (See indicator: Groundwater physical stocks.)
The balance of water extraction and input from rain and snowmelt may change as our climate changes. Projections indicate that precipitation will change and may alter river flows in some locations. In places where there is a decline in precipitation, taking water may increase the negative effects of water extraction. One study suggested that by late in this century, seasonal and annual mean flows would decline in several North Island rivers and increase in some South Island rivers (Collins et al, 2018).
The consequences of this issue are mainly related to the changes in river flows caused by taking water – average flows are reduced, and the size and frequency of high and low flows can be altered. Greater impacts on flow occur when larger volumes of water are taken from multiple locations, particularly in dry periods. Altered river flows can also change the flows in connected water bodies. Groundwater and surface water are part of the same hydrological system, so taking water from aquifers can reduce river flows and vice versa (Rosen & White, 2001). Wetlands are also connected to lakes, rivers, and aquifers, so taking water from rivers can reduce the water level in these ecosystems too (Rosen & White, 2001).
Computer modelling for 2013/14 predicted a potential reduction in the flow of water in our streams in some parts of the country as a result of consented water extraction. In some parts of Canterbury and Hawke’s Bay, the modelled total volume of upstream consented takes exceeded the natural median river flow (see figure 18).
At a national scale, taking water for irrigation has the greatest potential to cause widespread reductions in river flows compared with other water uses (Booker et al, 2016).
Dams also alter river flows and can affect the ecology of river systems (Nilsson & Berggren, 2000). The impacts of larger dams may extend hundreds of kilometres downstream (Schmidt & Wilcock, 2008). Dams on the Waitaki River, for example, have reduced the variability of river flows and reduced the frequency of floods, which has caused more vegetation to grow in the river channel, altered the movement of sediment, and reduced the quality of habitat for sensitive aquatic species (Tal et al, 2003).

Image: NIWA (Data source)
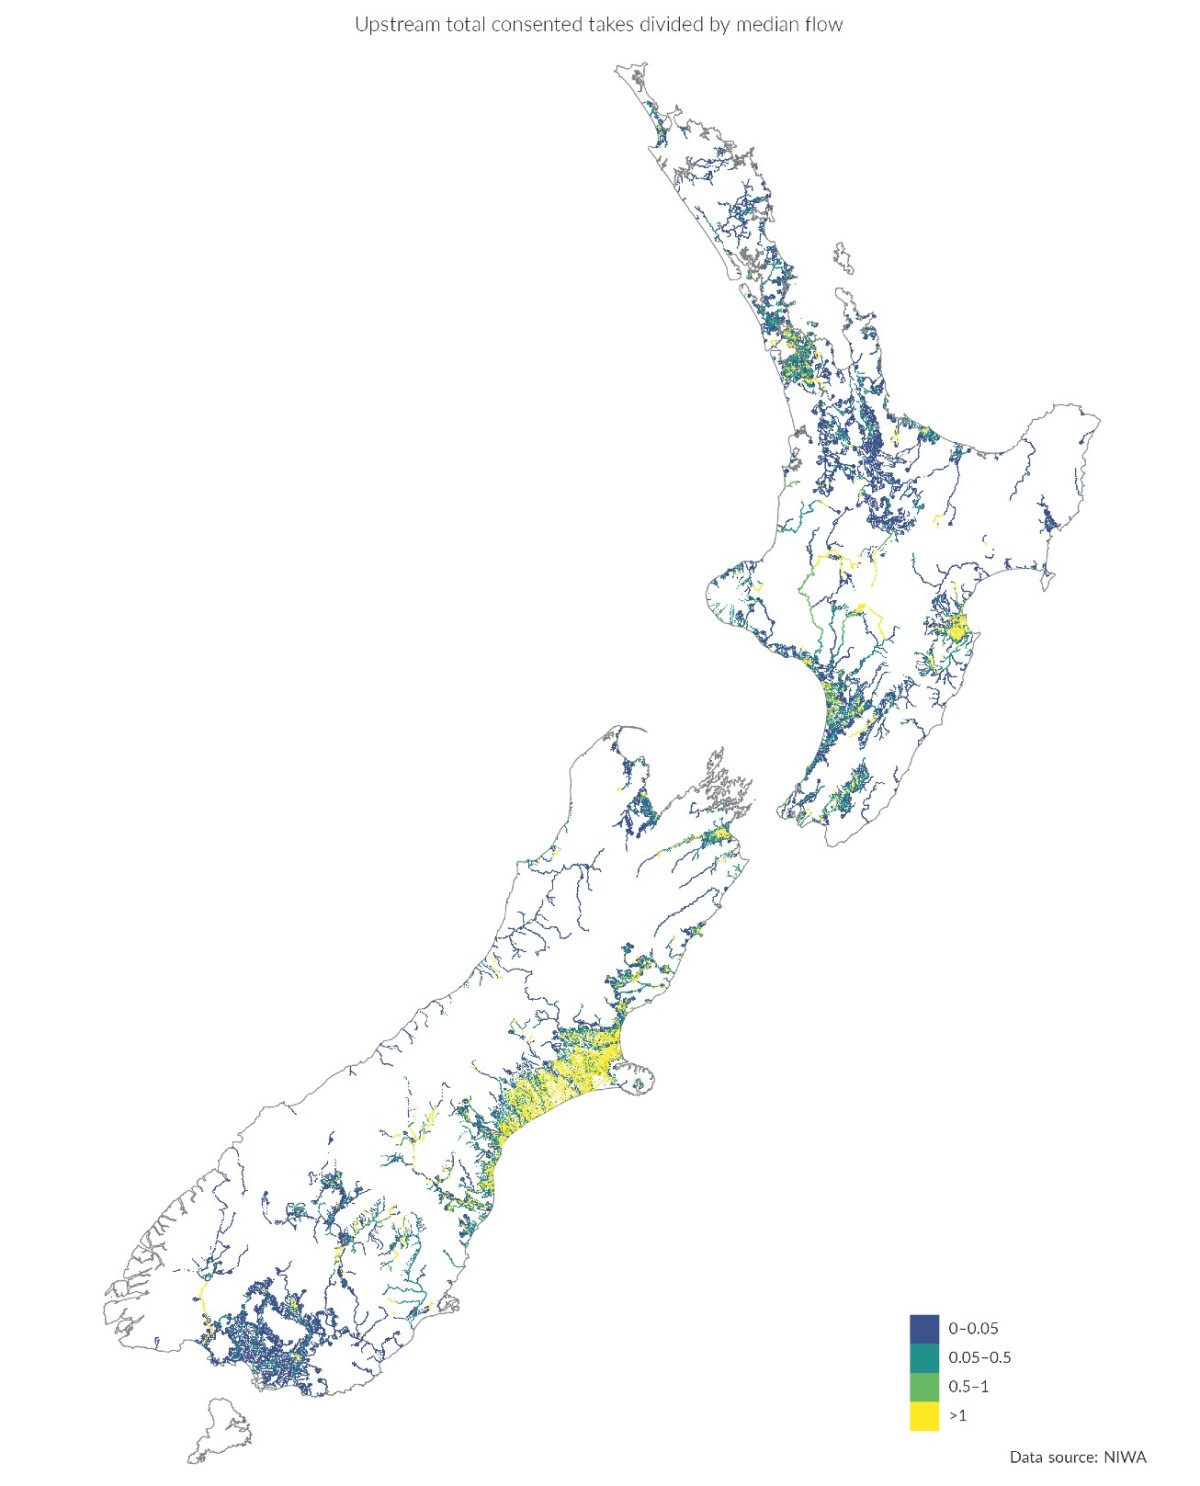
Image: NIWA (Data source)
Low river flows reduce the quantity of habitat for freshwater fish, invertebrates, and other species, which provide food for other species and for people (Our fresh water 2017; Booker et al, 2014; Dewson et al, 2007; Nilsson & Berggren, 2000; Storey, 2015).
Cultural effects include a reduced harvest of tuna and other freshwater species. There is also a risk that traditional knowledge relating to tuna and the rituals surrounding that harvest could be lost.
More than half of our native fish species move between the sea and freshwater habitats during their lifecycle. These include the taonga whitebait species inanga, shortjaw kōkopu, giant kōkopu, kōaro, and kanakana/piharau (lamprey), and both species of tuna (longfin eel and shortfin eel) (McDowall, 2010). Changes to river flows and structures in waterways (like overhanging culverts and hydro dams) can disrupt or block these journeys and are a significant and ongoing threat to our native fish (Our fresh water 2017; Franklin et al, 2018; Goodman, 2018). (See indicator: Selected barriers to freshwater fish in Hawke’s Bay.)
Reduced flows can increase the temperature and the concentration of nutrients and pathogens in a waterway (Nilsson & Malm-Renöfält, 2008). These factors combined with fewer floods can increase the likelihood of algal blooms. (See Issue 4: Our waterways are polluted in farming areas.)
Low river flows can also affect estuaries and their biodiversity. Effects include changes in the salinity that allow more marine species to colonise and altering the rate of sedimentation and the shape and extent of the estuary (Gillanders & Kingsford, 2002).
Decreased flows can limit our ability to use rivers, lakes, and estuaries for swimming and other recreation. Decreased flows may also affect cultural values like mahinga kai status and the navigability of waterways. (See indicator: Cultural health index for freshwater bodies.)
In braided rivers, both damming and taking water have negative consequences by changing the natural cycles of flooding and sediment supply (Gray & Harding, 2007). Braided rivers are important habitats for threatened birds like wrybill (Anarhynchus frontalis) and kakī (Himantopus novaezelandiae) (O’Donnell et al, 2016; Robertson et al, 2017). Lower water flows can reduce the number of channels and make the rivers less dynamic (Gray et al, 2018) which reduces the amount of habitat these birds depend on. Of our braided rivers, 64 percent are in Canterbury (O’Donnell et al, 2016), the region where the demand for irrigation is highest.
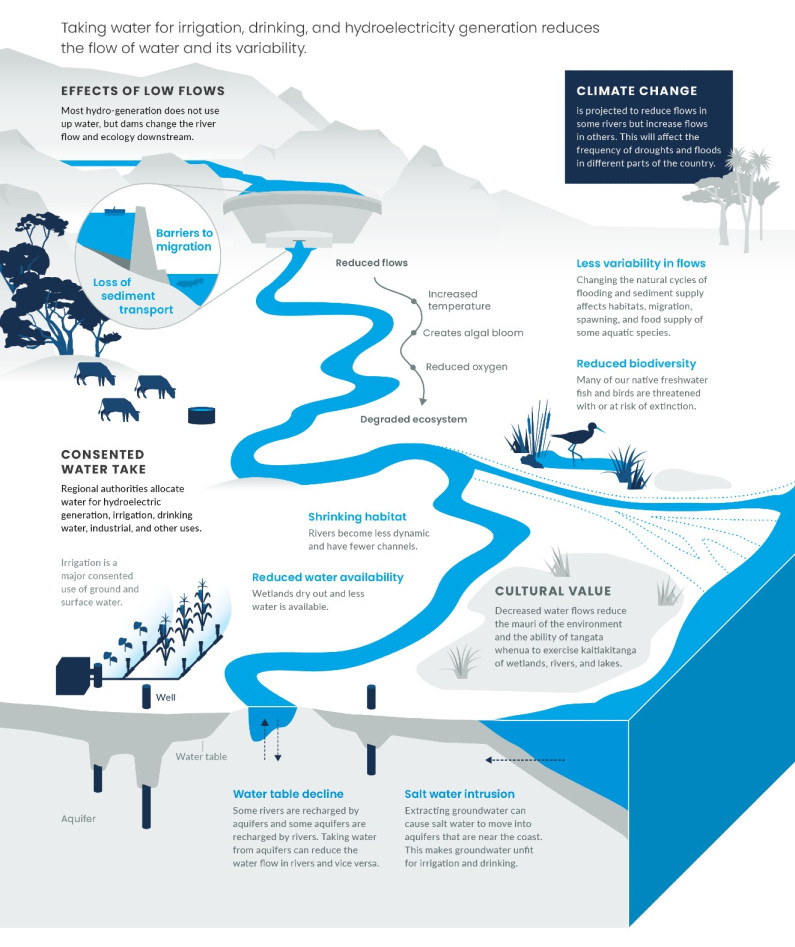

Read the long description for Effects of taking water
Taking water for irrigation, drinking, and hydroelectricity generation reduces the flow of water and its variability.
Effects of low flows
Less variability in flows
Reduced biodiversity
Shrinking habitat
Reduced water availability
Water table decline
Salt water intrusion
Consented water take
Cultural value
The actual quantity of water taken from all our rivers, lakes, and groundwater is not known.
Regional councils collect data on actual water use. The Resource Management (Measurement and Reporting of Water Takes) Regulations 2010 require water meters to be installed (when consented water take is more than 5 litres per second) to provide a continuous record of use. Case studies of actual water-use data, however, show that some users took less water than the volume they were consented to take, while others consistently took more water than their consented volume, and other users did not supply records of their water use (Booker et al, 2017).
The total amount of water that is potentially available for use is not well understood. Detailed maps of the locations, volumes, and properties of New Zealand’s aquifers are not available, so the volume, quality, and availability of water stored in aquifers is not known. The effects of projected climate change on the flow of water in rivers and aquifers is also poorly understood.
These limitations around our actual water use compared with its availability make it difficult to know if our freshwater resources are over-exploited and how long they will continue to meet our needs. This is a significant management issue given our economic reliance on agriculture, especially dairy farming.
We know that changing water flows can have significant effects on habitats, but information about the extent and scale of these impacts on our ecosystems is lacking. Other water issues like pollution also have an effect, but the cumulative impact of these changes on our social and economic values is difficult to determine.
Understanding the impact of this issue on kaitiakitanga and mātauranga Māori is currently dominated by western science-based techniques (Tipa, 2010). This inhibits data collection and analysis that could be more consistent and appropriate from a Māori cultural perspective. Cultural health indicators and mauri measures from mātauranga Māori for example could provide a better understanding of cultural impacts for decision-making.
Substantial sources of information about the cultural impacts of water takes have been recorded as evidence for water take or diversion consents, regional plans, Waitangi Tribunal claims, and Treaty of Waitangi settlements. All these could help provide a more comprehensive understanding of the impacts of this issue.
Harvesting marine species affects the health of the marine environment and its social, cultural, and economic value to us. Fishing could change the relationship that future generations have with the sea and how they use its resources.
Commercial fishing takes place in all our coastal waters, the Chatham Rise, and the Challenger and Campbell plateaus. Seabed trawling is limited to waters less than 1,600 metres deep (Baird & Wood, 2018). Recreational fishing is widespread but most common from Northland to Bay of Plenty (Fisheries New Zealand, 2019).
Marine biodiversity is reduced and parts of the seabed are profoundly modified.
Long-lived species may recover slowly from fishing pressure, as may the structure of the seabed after trawling.
It poses significant threats to protected species and ecosystems, affects social and economic values, and impacts iwi relationship with rohe moana (a coastal and marine area over which an iwi or a hapū exercises its mana and its kaitiakitanga) and cultural practices.
We lack full information of the ecological impact of fishing, which limits our ability to manage the impact of fisheries.
Fish stocks are managed under Aotearoa New Zealand’s quota management system (QMS) – 642 individual fish stocks that include 98 species (or species groups) (MPI, 2018d). A stock is defined as a species of fish, shellfish, or seaweed in a particular area. About half the stocks have sufficient information available to be assessed annually.
The QMS gives quota holders a right to harvest a fish stock up to a maximum level – the total allowable catch. This limit is set with the aim of ensuring harvests in the future and allows for commercial, customary, and recreational fishing.
In 2017, 84 percent of routinely assessed stocks were considered to be fished within safe limits and 97 percent of all commercial fish landings came from such stocks (MPI, 2018d). Eight of our fisheries (hoki, hake, southern blue whiting, ling, albacore tuna, skipjack tuna, some stocks of orange roughy, and Ross Sea Antarctic toothfish) have Marine Stewardship Council certification for environmental sustainability (MSC, 2019).
In the same year, 16 percent of routinely assessed stocks were overfished (meaning that these stocks are depleted) (MPI, 2018d). Snapper stocks in the eastern Northland, Hauraki Gulf, and Bay of Plenty (Snapper 1 area) for example, are considered likely to be overfished (MPI, 2018b). Ten stocks had collapsed, meaning that closure should be considered to rebuild the stock as quickly as possible (MPI, 2018d). For example, two sub-stocks of scallops (Tasman Bay and Golden Bay) were closed to fishing in 2016 (MPI, 2018b).
About half our fish stocks (mainly minor fished species) lack sufficient information to assess their status.
Protected species like seabirds, marine mammals, and sharks get caught unintentionally while fishing. This bycatch has a serious effect on our protected species because they generally have long life spans, mature at a late age, and have low fertility (Carrier et al, 2010; Chilvers et al, 2010; MPI, 2013; Schreiber & Burger, 2001).
The main identified cause of death for Hector’s and Māui dolphins is bycatch from commercial and recreational fishing. Between 1921 and 2015, entanglement in fishing gear accounted for 71 percent of the 301 Hector’s and Māui dolphin deaths for which a cause of death was determined. (See indicator: Bycatch of protected species: Hector’s and Māui dolphins.) In 2017/18, six Hector’s dolphins were caught in commercial set nets (DOC, 2019).
An estimated 5,075 seabirds were caught or killed by fishing operations in New Zealand waters in 2014. (See indicator: Bycatch of protected species: seabirds.) Seabirds are the world’s most threatened birds (Croxall et al, 2012). Nearly a quarter of all seabird species breed in New Zealand and 10 percent only breed here (Taylor, 2000). In 2017, of the 71 New Zealand seabirds assessed, black petrel were considered at very high risk from commercial fishing (the most at risk species), seven species were considered to be at high risk, five at medium risk, four at low risk, and the rest at negligible risk (Richard & Abraham, 2017).
Other protected species caught or killed as bycatch in the 2014/15 fishing year included an estimated 536 fur seals, 104 common dolphins, 12 New Zealand sea lions, and 13 sea turtles (Abraham & Berkenbusch, 2017). Between 2009/10 and 2013/14, commercial fisheries also accidentally caught 165 tonnes (about 33 individuals) of protected basking shark and 24 tonnes (about 150–250 individuals) of protected spinetail devilray (MPI, 2017).
Bycatch also affects non-protected species. Some of these species can be landed by fishermen, but those without commercial value are discarded. In 2012, bycatch of unwanted fish and invertebrates in deepwater fisheries was estimated at 32,000 tonnes. (See indicator: Bycatch of fish and invertebrates.) The scampi fishery is the most wasteful, with 3.8 kilograms discarded for every kilogram of scampi caught (MPI, 2017). The discard rates in other fisheries range from 0.01 to 0.34 kilograms discarded per kilogram of target catch (MPI, 2017).
Seabed (bottom) trawling and dredging involve large nets (bottom trawling) or heavy metal baskets (dredging) being towed near or along the seafloor. They are the most destructive fishing methods, causing damage to seabed habitats and reducing the density and diversity of the species that live there (MPI, 2017).
Trawling is carried out in both shallow and deep water and is used to catch a range of species, like hoki and squid. Dredging is carried out on the seabed in shallow waters and often targets shellfish species like scallops and oysters.
Between 1990 and 2016, trawling occurred over approximately 28 percent of the seabed where the water depth was less than 200 metres and 40 percent of the seabed where water depth was 200–400 metres (Baird & Wood, 2018) (see figure 19). The trawled area decreased in deeper waters but still affected 4 percent of the seabed at 1200–1600 metres depth (Baird & Wood, 2018).
Seamounts (undersea mountains) are some of the most productive areas in the sea. These too are trawled, which has a significant impact on their biodiversity (Clark et al, 2010; Clark & O’Driscoll, 2003; Clark & Rowden, 2009). (Some seamounts are protected from seabed trawling.)
Note: All gross domestic product (GDP) figures are from the National accounts (Industry production and investment): year ended March 2017. These figures exclude manufacturing or processing of primary products. They are in current prices, ie not adjusted for the effect of changing prices over time. The people employed information is from linked employer-employee data (LEED). The measure is main earning source, by industry using New Zealand standard industry output categories.

Image: Map created by NIWA (Baird & Wood, 2018) (Data source)
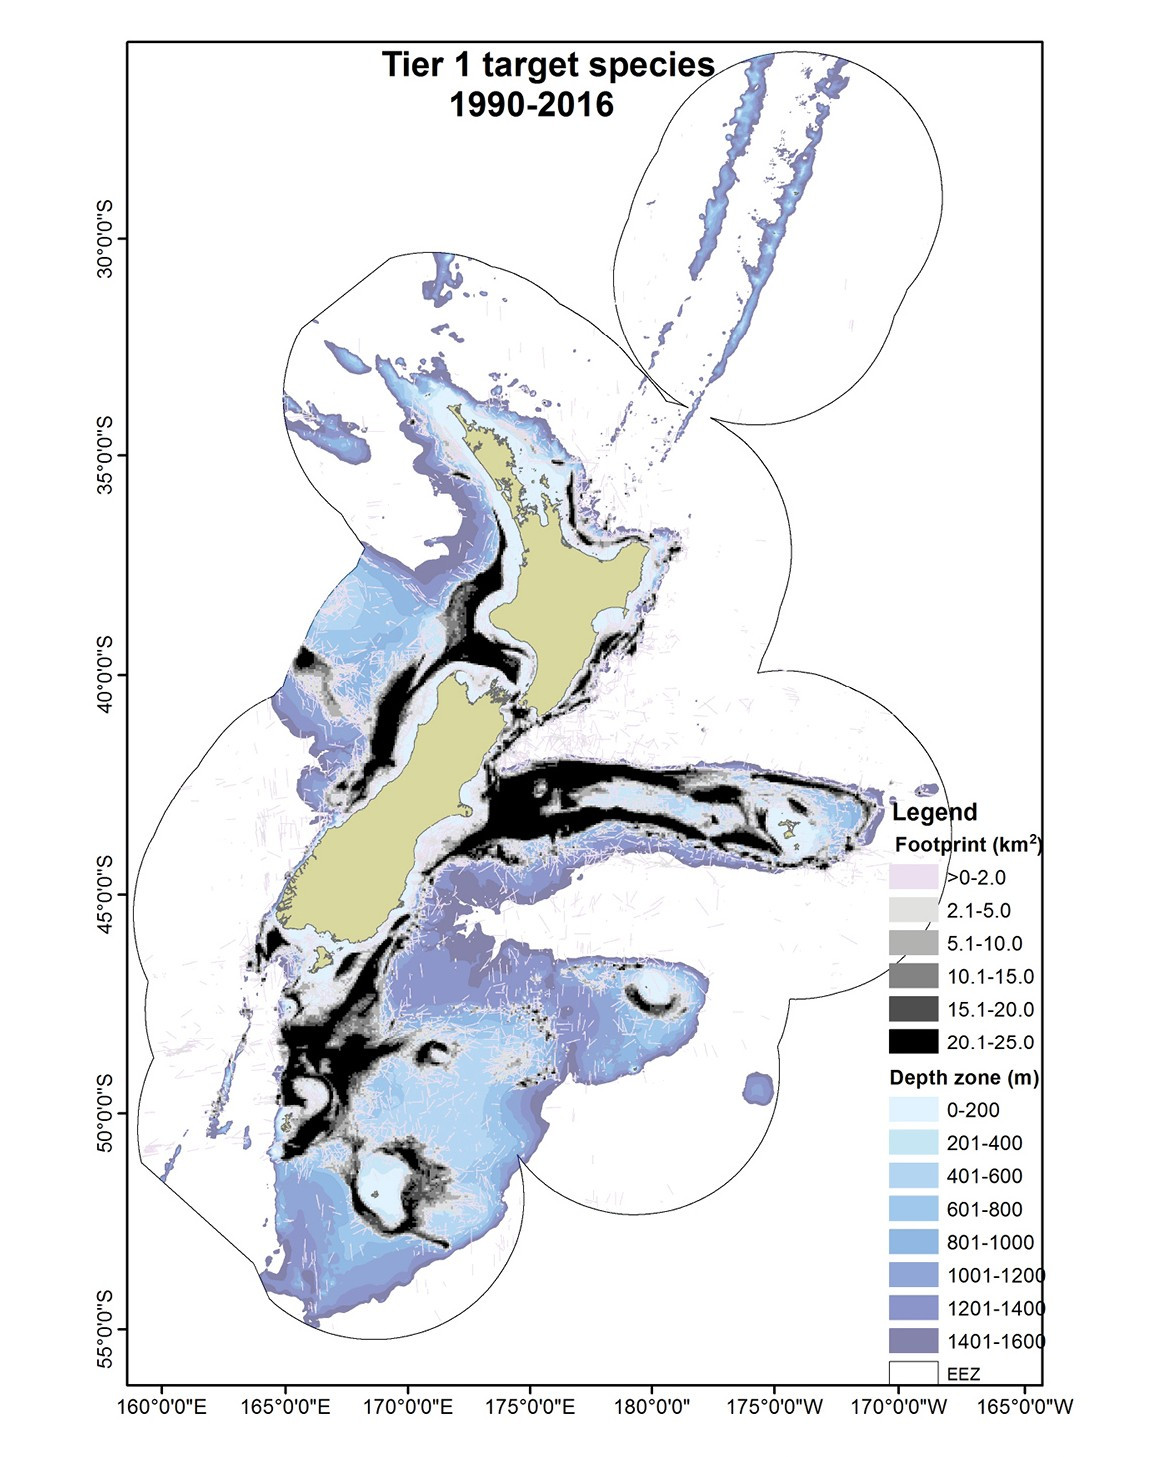
Image: Map created by NIWA (Baird & Wood, 2018) (Data source)
Commercial fishing and the pressures associated with it have reduced in the last decade but are still significant. Because of an incomplete understanding of the cumulative effects of fishing on the marine environment, it is unclear if the current levels of fishing are sustainable (see Where are the gaps in our knowledge?).
Interviews with kaitiaki around New Zealand revealed a common concern that the abundance and diversity of kaimoana have declined along much of the coastline and inshore fisheries in the past 30–50 years (Dick et al, 2012; Mccarthy et al, 2014).
New Zealand’s total marine catch peaked at nearly 650,000 tonnes in 1997 and 1998, but has since declined to less than 450,000 tonnes per year since 2009 (FAO, 2018a). This is consistent with the stabilisation of the annual fishing catch globally (FAO, 2018b).
Between 2009 and 2017, more than 80 percent of New Zealand’s assessed fish stocks were considered to be managed sustainably, and almost all of the annual catch was from these stocks (MPI, 2018d). (See indicator: State of fish stocks.) The proportion of stocks that were overfished reduced from 19 percent in 2009 to 16 percent in 2017. Fish and invertebrate (animals without a backbone, for example squid or shellfish) bycatch also reduced during this time period, peaking in 2002 at 114,000 tonnes. (See indicator: Bycatch of fish and invertebrates.) Some species, however, are increasingly being caught (Anderson, 2013).
Eight Hector’s and Māui dolphins were caught in fishing gear in 2011–15, which is a reduction from the 14 caught in 2006–10 and the 37 caught in 2001–05. (See indicator: Bycatch of protected species: Hector’s and Māui dolphins.) Māui dolphins have a nationally critical conservation status – only an estimated 63 animals were left in 2015/16 (Baker et al, 2016) – so any accidental captures are a significant issue.
The number of seabirds caught by fishing declined from an estimated 9,185 in 2003, to 5,033 in 2008 – a figure that has been about the same since. (See indicator: Bycatch of protected species: seabirds.) Measures adopted in 2006 and 2008 to reduce incidental capture may have contributed to this reduction in captures.
The seabirds that are still being caught or killed by fishing include some of our rarest native albatross, shearwater, and petrel species, which are at high or very high risk of death from bycatch (Our marine environment 2016). Salvin’s albatross, for example, has a nationally critical conservation status and a very high risk of fishing-related death.
The incidental capture of sea lions has decreased since 1996 and the incidental capture of fur seals has decreased since 1999. (See indicator: Bycatch of protected species: sea lion and fur seal.) The breeding success of sea lions on the Auckland Islands has also improved since 2009, after a marked decline from 1997/98 to 2008/09 (MPI, 2017).
The area of seabed trawled has been between approximately 40,000 and 44,000 square kilometres for the last decade. In 2003, the trawled area peaked at 80,000 square kilometres. The number of seabed-contacting tows has nearly halved from nearly 60,000 in 1998 to 26,000 in 2016 (Baird & Wood, 2018).
Some areas of the seabed have been trawled every year for 27 years. About 76 square kilometres of seabed was trawled for the first time in 2016, which expanded the trawled area slightly (Baird & Wood, 2018).
Fishing vessels are now larger and more powerful, and use wider trawls and longer lines than when trawling first started more than 100 years ago. A small number of boats today can have the same impact as a larger fleet would have had in previous decades. Similar changes have occurred worldwide.
New Zealand’s total marine catch (deepwater and inshore) was approximately 30,000 tonnes per year in the 1950s and increased to about 58,000 tonnes per year until the mid-1970s (FAO, 2018b). Rapid growth in the late 1970s saw the inshore finfish catch rise from 14,000 tonnes in 1975 to 129,000 tonnes in 1981. This quantity was unsustainable and the overfished stocks crashed in the 1980s (Walrond, 2006).
The introduction of the quota management system in 1986 reduced the pressure on inshore fish (Walrond, 2006). Overall catch increased steadily until the late 1990s, with a peak in 1997 and 1998 of nearly 650,000 tonnes. The catch has since gradually declined to less than 450,000 tonnes a year (FAO, 2018a).
Past activities are still having an effect on marine mammals, seabirds, and other species. Legacy issues include hunting of fur seal and sea lion (Seersholm et al, 2018) that once inhabited the east coast and parts of the west coasts of the North and South islands (Baird, 2011). These species recover slowly from disturbance due to their long lifespans but low fertility.
Seabirds, in particular native albatross, have been affected by Japanese longlines in the Southern Ocean. An estimated 44,000 albatrosses were killed annually in the Southern Ocean between 1981 and 1986 (Brothers, 1991).
Parts of the seabed that have been trawled take time to recover. Deepwater coral can take decades to recover (Althaus et al, 2009) but there is still some uncertainty about other species, particularly those that live in naturally disturbed areas (MPI, 2017).
New Zealand’s marine environment faces increasing pressures from activities besides fishing (MacDiarmid et al, 2012). Our coastal environments receive excess sediment and nutrients from rivers. (See Issue 4: Our waterways are polluted in farming areas and Issue 5: Our environment is polluted in urban areas.) Plastic pollution is a global issue that affects every ocean and many species of seabird, turtle, and marine mammal. Seabirds have also been affected by introduced predators (see Issue 1: Our native plants, animals, and ecosystems are under threat) on the mainland and offshore islands, loss of nesting habitat, and disturbance (DOC, 2000). Climate change is projected to have major impacts on the marine environment from ocean acidification and warming. (See Issue 9: Climate change is already affecting Aotearoa New Zealand.)
These multiple and simultaneous pressures may have complex and poorly understood effects on marine species and habitats (Crain et al, 2008). Such cumulative effects are expected to be more prevalent in our coastal waters, which are the areas of the ocean that we use the most and have the strongest connection with (Our marine environment 2016).

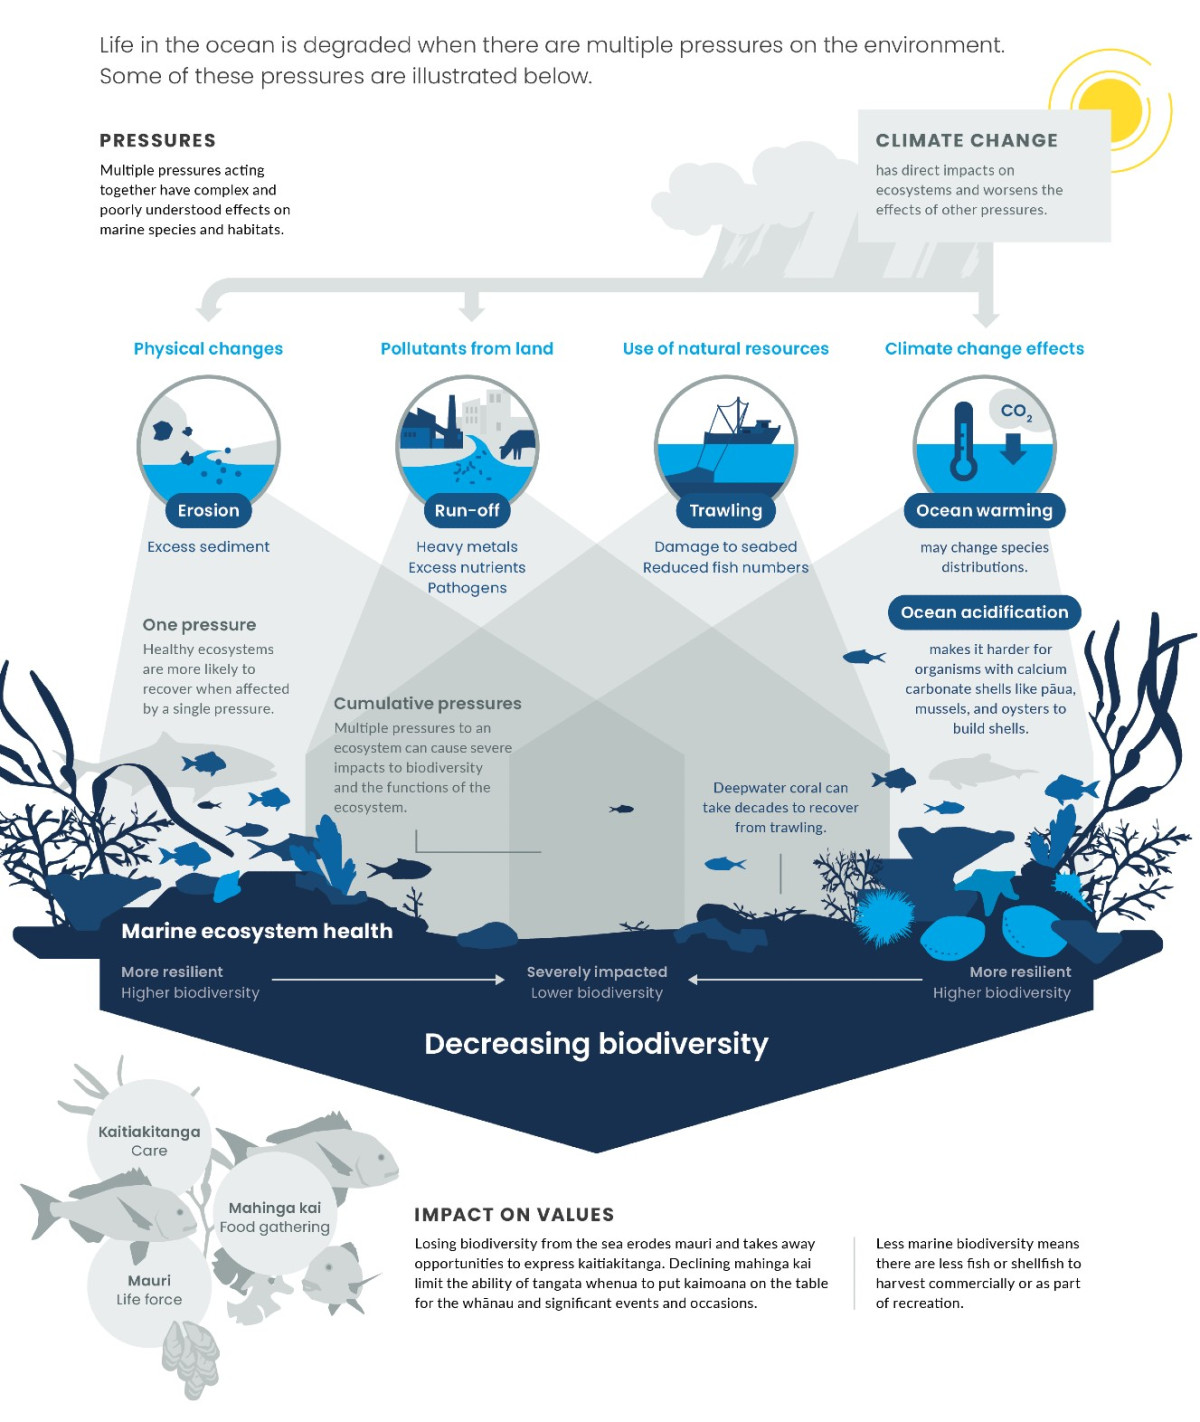
Read the long description for Cumulative pressures on the marine environment
Life in the ocean is degraded when there are multiple pressures on the environment. Some of these pressures are illustrated below.
Pressures
Climate change
Physical changes
Pollutants from land
Use of natural resources
Climate change effects
One pressure
Cumulative pressures
Marine ecosystem health
Impact on values
Taking fish from the ocean may make the remaining population less resilient, for example by reducing the genetic diversity or altering the population structure. This could affect breeding and thus the replenishment of the population, and increase the risk from other pressures.
Removing fish also changes food chains, affecting the species that depend on them for food (like seabirds and marine mammals) or are eaten by them, although evidence also exists of some species benefitting from discards from fishing. A lack of prey can affect how successfully predators can raise their young, sometimes leading to breeding failure if there is not enough food.
Seabed trawling changes the physical structure of the seabed, and reduces the density and diversity of seabed communities. These changes increase as seabed trawling intensifies. Long-lived species and those that form large structures (like mussels and corals) are most affected (MPI, 2017). Damage during fishing can also affect a wide range of ecosystem services provided by seabed habitats, like improving water quality, sequestering carbon, and providing habitat for other species (Geange et al, 2019; MacDiarmid et al, 2013).
The present and ongoing productivity of our fisheries is dependent on healthy marine ecosystems. Degradation of the marine environment could affect our ability to fish or harvest seafood for recreation, or to feed our families. For commercial fishers, depleted fish stocks could mean catching less or having to go out further to catch fish.
Changes like this could have a significant impact on the New Zealand economy. Recreational and commercial fishing sustains 16,000 jobs and generates about $4.2 billion in total economic activity (MPI, 2016). About 700,000 people fish in the sea every year, spending $946 million and generating $1.7 billion in economic activity (Holdsworth et al, 2016). This includes the contribution of other activities linked to fishing such as seafood processing. Also, more than 90 percent of our fisheries products are exported, which generates $1,375 million in export value (MPI, 2016).
Māori hold significant commercial marine interests and own more than 20 percent of fisheries quota and access to marine space for aquaculture (MPI, 2018a, 2018c). Māori customary interests are now well recognised and provided for in various legislation. These interests contribute significantly to the well-being of Māori communities today, as they have done for generations.
The loss of biodiversity from local marine environments erodes mauri (the essential essence of all beings, the life force which is in everything) and constrains opportunities to express kaitiakitanga (guardianship obligations and responsibilities) that engage kawa (protocols), tikanga (rules), and ture (laws) for protecting, restoring, and using fish and shellfish. Declines in mahinga kai also limit the capacity of tangata whenua to put kaimoana on the table for daily consumption, and for significant events and occasions (Paul-Burke et al, 2018).
Many coastal iwi and hapū have whakapapa, traditions, and knowledge that relate to seabirds, marine mammals, sharks, and other species. This includes coastal plants like pīngao. For example, customary harvests of fish and shellfish – and for a number of iwi also seabirds (sooty shearwater (Puffinus griseus) and grey-faced petrel (Pterodroma gouldi)) – link strongly to the mauri of the environment and the mana of the people.
Some species also hold special significance as taonga or non-human forms of kaitiaki whose presence or absence is indicative of ecosystem health. Taonga species are also indicators of intergenerational knowledge transmission and identity, connecting Māori to their Polynesian ancestors and relations across the Pacific and beyond. A reduction or loss of these species as a result of fishing is therefore a significant issue for Māori.
Damage to the marine environment transgresses the basic concepts of a Māori worldview in ways that undermine cultural and individual identity. The degradation of coastal mahinga kai – fish, shellfish, and marine ecosystems – has a significant detrimental effect on the relationship of Māori with their rohe moana (traditional marine environments). Other cultural consequences include fewer connections between people in a community, risk of cultural knowledge not being passed down, and impaired well-being and tribal development (Dick et al, 2012).
Our marine environment is highly complex and has many interacting components that are still poorly understood. Many of our marine species have not been discovered yet – experts estimate that there could be 17,000 or more species still to be identified (Gordon et al, 2010). Information is also lacking about the characteristics and extent of most marine habitats.
QMS stock assessments apply to individual fish stocks and do not fully account for interactions between different stocks or interactions with the broader marine environment, like how catching fish affects other species through a food chain. About half of our fish stocks (mainly minor fished species) have too little information to reliably assess their stock status.
There is insufficient information about tipping points in our marine ecosystems, as well as the environmental limits around the sustainable use of marine resources. For example, little is known about how seabed trawling changes the functioning of an ecosystem and the benefits that ecosystems derive from habitats on the seabed. This makes it difficult to assess the full impact of seabed trawling and limits our ability to make informed decisions about managing the marine environment.
There is a critical gap in our knowledge around the impact of fishing and gathering seafood from a te ao Māori perspective, especially characterising the impacts through mātauranga Māori and tikanga Māori, and on kaitiakitanga, customary use, and mahinga kai.
Theme 4: How we use our freshwater and marine resources
April 2019
© Ministry for the Environment