Climate Change Commission scenarios
New Zealand’s Climate Change Commission developed four future scenarios, as part of its advice to the New Zealand government, on how the 2050 emissions target could realistically be met.
New Zealand’s Climate Change Commission developed four future scenarios, as part of its advice to the New Zealand government, on how the 2050 emissions target could realistically be met.
The scenarios were used to inform the Climate Change Commission’s 2021 advice to government in Ināia tonu nei: a low emissions future for Aotearoa [Climate Change Commisson website].
Information about the scenarios can be found in Chapter 12: Long-term scenarios to meet the 2050 target [Climate Change Commisson website].
Explore the modelling, data, and assumptions underlying the Climate change Commission scenarios [Climate Change Commisson website].
The four scenarios were developed in 2021 and defined in terms of the nature and scale of assumed changes in technology and behaviours.
They were released in a report from the Climate Change Commission in 2021.
Changes in emissions up to 2050 are explored under the scenarios for each sector:
In contrast to the Climate Change Commission Current Policy Reference case in its 2021 report, which indicates that current government policies and settings are not on track to meet the 2050 targets, the scenarios have been developed to test how the targets could be met and therefore represent a fundamentally different future from the current trajectory of emissions.
The four scenarios developed by the Climate Change Commission in 2021 were developed to explore and demonstrate how the emissions budgets and ultimately the 2050 targets in the Climate Change Response Act 2002 could be met.
See Climate Change Response Act 2002 [New Zealand Legislation website]
The Climate Change Commission scenarios were not expressly created for the purpose of policy testing or climate scenario analysis. Despite this, elements of the scenarios can be useful for developing scenario narratives specific to Aotearoa New Zealand.
The Climate Change Commission scenarios explore how technologies and social factors may develop in Aotearoa New Zealand in the future. The scenarios cover economy-wide emissions results; sector assumptions, results, and insights; and cross-sector implications.
Most sector scenarios for Aotearoa New Zealand draw on narrative aspects or data from the Climate Change Commission scenarios.
The Climate Change Commission scenarios were developed as part of the Commission’s advice to government on meeting 2050 targets.
Unlike some other scenarios, such as the NGFS scenarios, the Climate Change Commission scenarios were not expressly developed for the purpose of testing policies or conducting climate scenario analysis.
The scenarios have not been updated since 2021. Some assumptions underlying the scenario data may be outdated.
Read more about the limitations and assumptions underlying the Climate Change Commission scenario modelling [Climate Change Commission website]
There are a total of four Climate Change Commission scenarios, each with a different narrative and emissions trajectory.
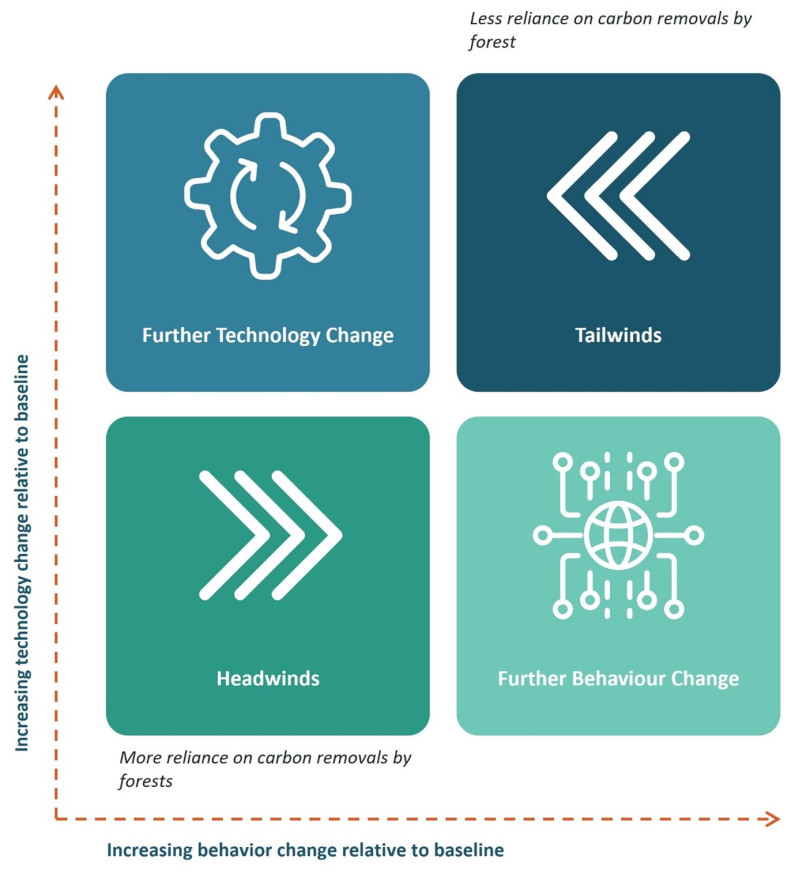
This diagram shows the Climate Change Commission scenarios plotted against an increasing technology change relative to baseline axis and increasing behaviou change relative to baseline axis
The sceanrios are:
Read analysis in content below.

This diagram shows the Climate Change Commission scenarios plotted against an increasing technology change relative to baseline axis and increasing behaviou change relative to baseline axis
The sceanrios are:
Read analysis in content below.
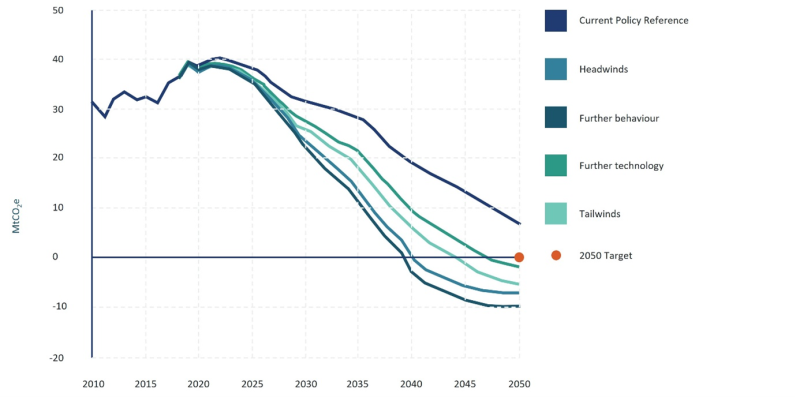
This graph shows emissions trajectories of the four scenarios - plotted from 2010 to 2050.
Read analysis in content below.
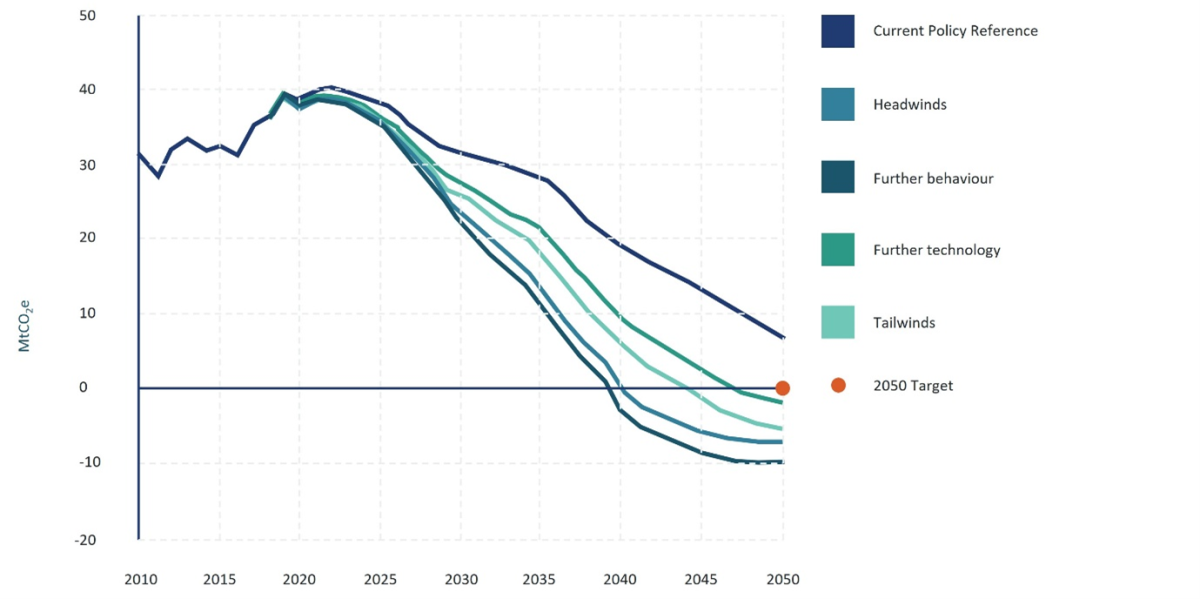
This graph shows emissions trajectories of the four scenarios - plotted from 2010 to 2050.
Read analysis in content below.
In this scenario there are higher barriers to uptake of both technology and behaviour changes across key measures.
It assumes conservative improvements in technology relative to the Current Policy Reference case. It assumes a modest change from existing behaviour trends among people and businesses.
In this scenario, technology changes help to deliver greater emissions reductions. It makes assumptions about the technologies which are developed and deployed which could allow faster emissions reductions to occur.
Relative to the Headwinds scenario, greater technology adoption is driven by:
In this scenario, changes in people's and businesses’ preferences encourage more behaviour changes away from high emitting activities and practices.
There are conservative improvements in technology as per the Headwinds scenario, but barriers to adoption of existing technologies are lower as people and businesses make greater efforts to adopt them.
This scenario combines further technology and further behaviour change assumptions to provide a potential upper bound for how far and how quickly emissions could be reduced based on current evidence and judgements.