State of our atmosphere and climate

Five key takeaways from the state of our atmosphere and climate section. An illustrative icon accompanies each one.

Whakarongo ki te taiao

Listen to the environment

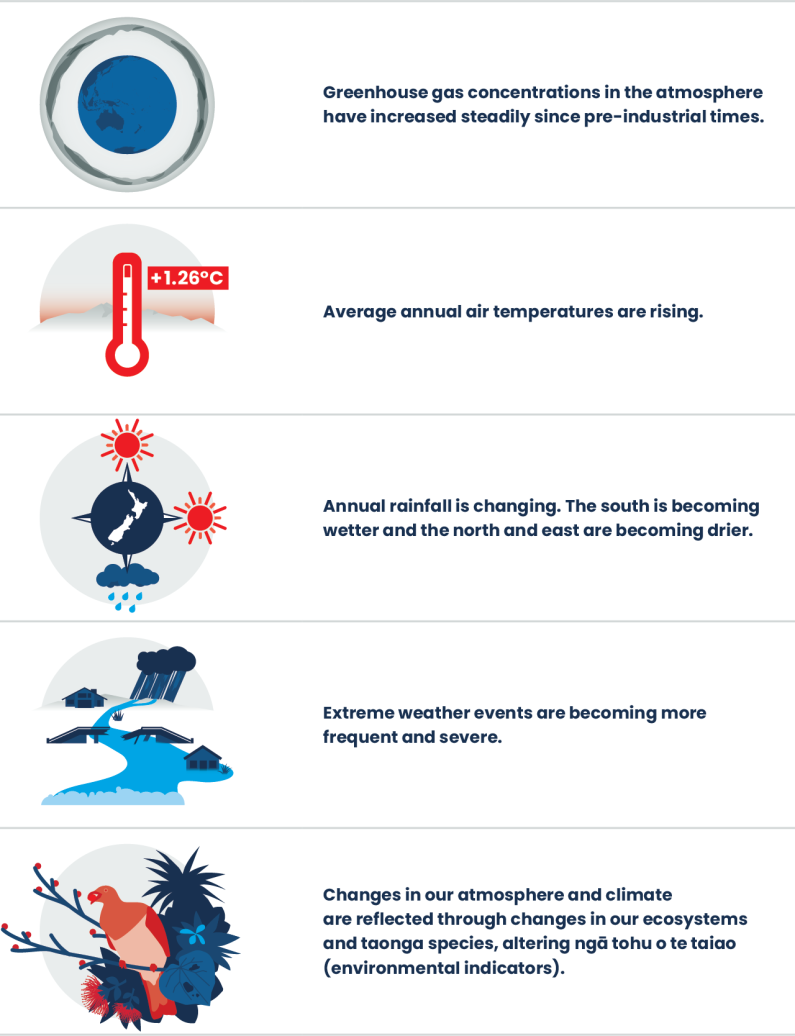
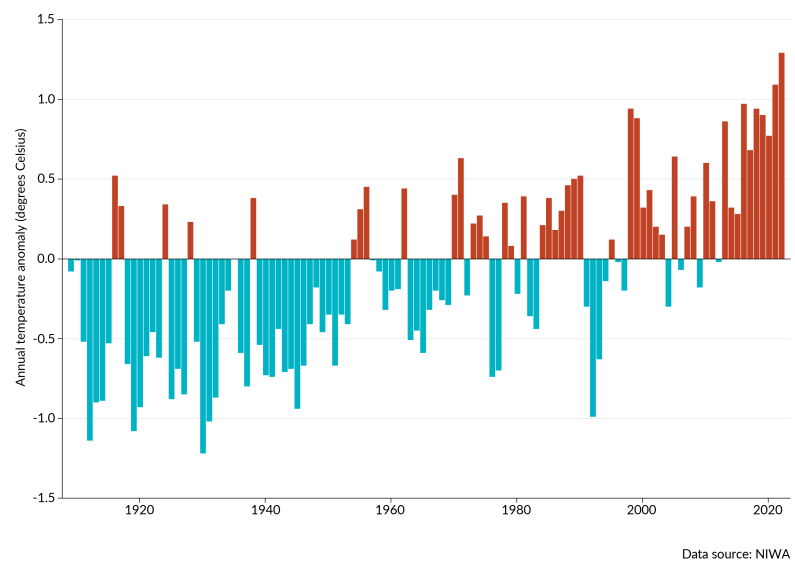
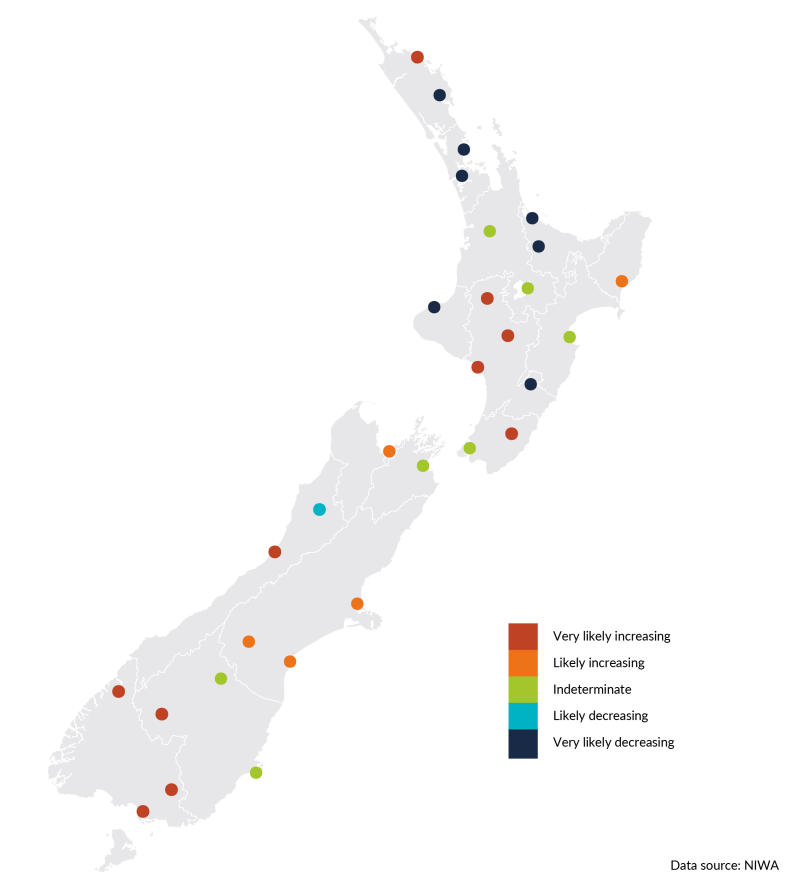
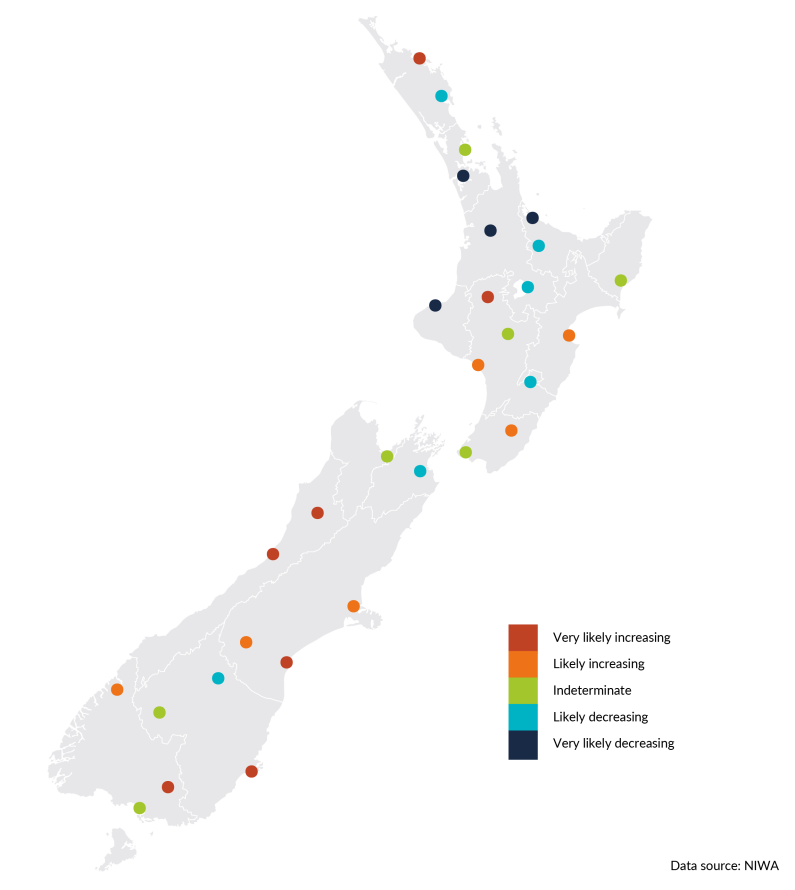
Climate change is becoming increasingly evident in Aotearoa New Zealand. Our average and extreme temperatures have increased since pre-industrial times. The growing season has lengthened, and the number of frost days has decreased in most parts of the country. Annual rainfall is changing in most places in Aotearoa, with the south of Aotearoa becoming wetter and the north and east becoming drier. Medium-term droughts are becoming more frequent.

Extreme weather events, such as those leading to floods and slips in Tairāwhiti and Auckland, storms in Westport and Nelson, and droughts across the country, are becoming both more frequent and severe. Concern is increasing that changes in the frequency of events will lead to a higher risk of multiple severe weather events that overlap in time and/or space.

Gradual changes, such as increasing temperatures, may not be as noticeable in our day-to-day life, but can cause cascading effects through the environment and lead to irreversible changes. These changes in our atmosphere and climate are evident and reflected through changes in our ecosystems and taonga (treasured) species, altering ngā tohu o te taiao, or environmental indicators.

Changing state of our atmosphere and climate can be observed through changes in ngā tohu o te taiao

  • Many Māori traditions of monitoring weather patterns and extreme events through oral communication are thought to provide insights into long-term climate trends, identify shifts in observations and warn of dangers related to climate change (King et al, 2007).
  • Different winds and cloud formations can be indicators for short term weather patterns, incoming storms, fishing conditions and harvesting times. Iwi who travelled extensively on waka (canoe) relied on this specific knowledge of clouds and winds to forecast safe travel and fishing practices, adapting and maintaining resilience in the face of global change, including climate change (King & Skipper, 2006; King et al, 2007).
  • Through observing the environment closely over time, Māori developed a deep knowledge of location-specific environmental indicators, or tohu, which help to monitor and forecast trends in te taiao (Harcourt & Awatere, 2022; King et al, 2005).
  • Tohu are passed down generations through different forms, including pūrākau (stories) and whakatauākī (proverbs) (Harcourt & Awatere, 2022).
  • Weather and climate variability and extremes can be monitored through tohu (environmental indicators), for example, behaviour of birds and blooming of flowers. The use of tohu reflects connection through whakapapa (genealogy) and the dependencies that exist throughout the atmosphere and wider environment (King et al, 2005).
  • The timing of tohu is changing. Warming sea temperatures have changed the times when kina (sea urchins) are fat and ready for gathering, and this is no longer in sync with the traditional summer blooming of the pōhutukawa (see Our marine environment 2019 and Our atmosphere and climate 2020).
  • The maramataka helps to monitor the weather, seasonal changes and migratory patterns of birds and fish (see Te ao Māori, whakapapa and our connection to atmosphere and climate for a definition of the maramataka) (Harris et al, 2013).
  • Many hapū and iwi have developed their own rohe-specific maramataka through centuries of detailed observations. These observations can be used to track appropriate times for harvesting and planting crops, hunting and fishing, and gathering kai moana (seafood) (Harris et al, 2013).

Atmospheric concentrations of greenhouse gases have increased substantially since pre-industrial times and have continued to increase in recent years

  • In 2019, global atmospheric carbon dioxide concentrations (410 parts per million (ppm)) were higher than at any time in at least 2 million years (IPCC, 2021).
  • The highest atmospheric carbon dioxide concentration observed between 1972 to 2022 was 415.5 ppm in August 2022, which is up 6 percent since 2012 and around 48 percent higher than pre-industrial levels of 280 ppm (see Indicator: Greenhouse gas concentrations) (Ciais et al, 2013).
  • The highest atmospheric methane concentration observed over 1989 to 2022 was 1881.4 parts per billion (ppb) in October 2022, which is around 169 percent higher than pre-industrial levels (see Indicator: Greenhouse gas concentrations) (Ciais et al, 2013).
  • The highest atmospheric nitrous oxide concentration observed between 1996 to 2022 was 335.5 ppb in December 2022, which is around 24 percent higher than pre industrial levels (see Indicator: Greenhouse gas concentrations) (Ciais et al, 2013).

Long-term annual average temperatures are rising in Aotearoa, with increasing

  • Annual average temperature in Aotearoa has increased by 1.26 (± 0.27) degrees Celsius between 1909 and 2022 (114 years), with 8 of the 10 warmest years on record in the past decade (figure 5) (see Indicator: Temperature).
  • From 1972 to 2022, when seasonal data are available, trends were increasing for 25 of 30 sites in spring, 28 sites in summer, 28 sites in autumn and 30 sites in winter.
  • Trends in warm days increased at 25 sites, decreased at 3 sites (Taumarunui, Milford Sound and Dunedin) and were indeterminate at 2 sites (see Indicator: Temperature). A warm day occurs when the daily maximum temperature is above 25 degrees Celsius.
  • Data from 30 of NIWA’s climate stations across Aotearoa support many of the environmental indicators by Stats NZ presented in this report (see appendix A, for more information on sites and trends).
  • The hottest days of the year have increased by over 0.5 degrees Celsius during the past 20 years across many populated areas of Aotearoa (Harrington & Frame, 2022).

Figure 5: Aotearoa New Zealand’s annual average temperature anomaly, 1909–2022

Aotearoa New Zealand’s gross carbon dioxide emissions, 1990–2021. Alt text in caption
A bar chart showing Aotearoa New Zealand’s annual average temperature anomaly, 1909–2022. It shows annual temperature anomaly in degrees Celsius.

Note: The baseline for temperature anomalies is the average annual temperature for the 30 years from 1961 to 1990.

Growing seasons are lengthening and frost days are declining in most places in Aotearoa, changing ngā tohu o te taiao

  • Trends in the number of frost days decreased at 20 of 27 sites, increased at 5 sites and were indeterminate at 2 sites, between 1972 and 2022. A frost day occurs when the daily minimum air temperature is below zero degrees Celsius, as measured 1.2 metres above the ground (rather than a day that has frost on the ground) (see Indicator: Frost and growing degree days).
  • The observation of hukapapa, or severe frosts, can be used as an indicator for many Māori customary practices. Cold weather and frosts can indicate a good year ahead for the kererū (New Zealand pigeon) and tree production (Lyver et al, 2009).
  • Some insect pests and certain plants (including invasive species) benefit from fewer frost days, while other plants rely on frosts for triggering processes like blossoming in fruit trees (Lyver et al, 2009, McGlone & Walker, 2011).
  • Trends in the number of growing degree days increased at 29 sites, and one site had an indeterminate trend (Lake Tekapo) between 1972 and 2022 (see Indicators: Frost and growing degree days).
  • Growing degree days is a measure that can be used to estimate the length of the growing season for agriculture and horticulture. The measure counts the total number of degrees Celsius that the average temperature is above a base temperature (commonly 10 degrees Celsius) each day.
  • Growing degree days indicate the amount of warmth available for plant and insect growth and can be used to predict when flowers will bloom and crops and insects will mature. While some plants and animals may benefit from more growing degree days, it can also mean more water and heat stress and longer pollen and pest seasons.

Annual rainfall is changing in most places in Aotearoa, with the south becoming wetter and the north and east becoming drier

  • Annual rainfall across 30 sites increased at 15 sites and decreased at 8 between 1960 and 2022. Seven sites had indeterminate trends (see Indicator: Rainfall).
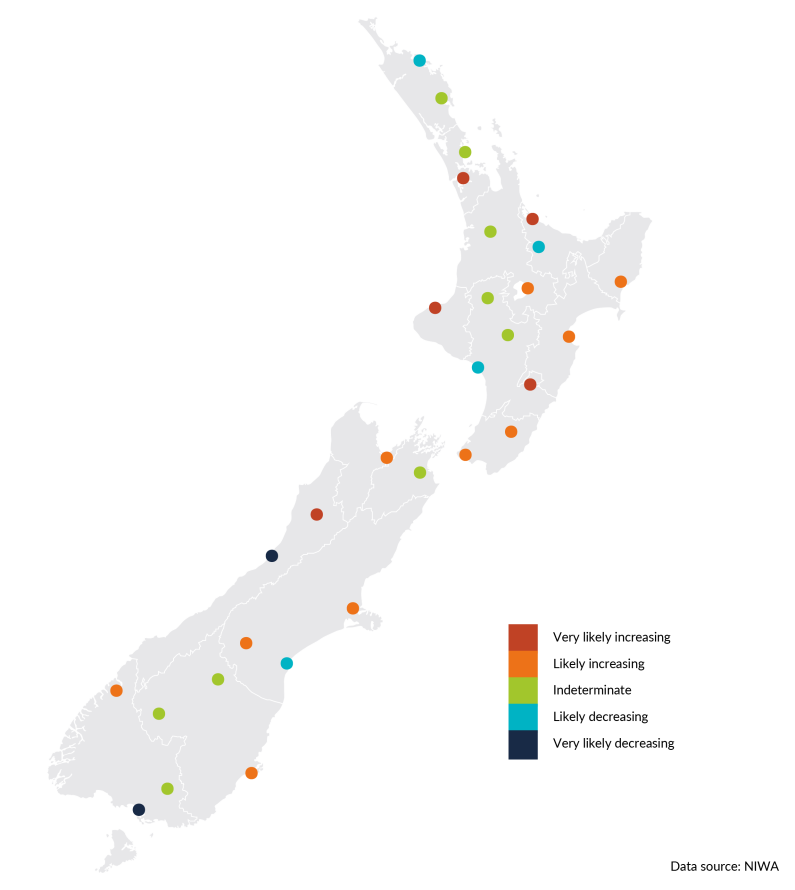
  • Annual rainfall increased at many sites in the southern South Island. Of the sites where rainfall decreased, many were in the northern half of the North Island (figure 6).

Figure 6: 	Average annual rainfall trends, 1960–2022. Alt text in the caption
A point map of Aotearoa New Zealand showing average annual rainfall trends from 1960–2022. It shows whether trends are very likely increasing, likely increasing, indeterminate, likely decreasing, or very likely decreasing.

Frequency of medium-term (agricultural) drought is increasing in many places in Aotearoa

  • A drought is a prolonged and marked shortage of moisture compared with what is expected. Drought is mainly caused by a lack of rain, but high temperatures and strong winds can contribute because they accelerate evaporation and water loss from soil, vegetation and waterways (see appendix A, for the method used to characterise drought).
  • Trends in frequency of agricultural drought events (medium-term; across six months) are increasing at half of the total sites. Agricultural drought frequency increased at 15 sites and decreased at 6, while 9 sites had indeterminate trends (figure 8) (see appendix A, for more data on short- and long-term droughts, see Indicator: Drought).
  • Trends in drought intensity are indeterminate at a majority of sites, though more sites showed decreasing rather than increasing trends across agricultural drought events. Agricultural drought intensity increased at 5 sites and decreased at 9, while 16 sites had indeterminate trends.
  • Of 30 sites, 19 had extreme dryness from 1972 to 2022. Twenty sites spent at least 25 percent of the time in medium-term drought, with Dannevirke spending the most time in a drought event (56 percent of the time) (see Indicator: Drought).
Figure 8 Frequency trends for medium term droughts. Alt text in caption
A point map of Aotearoa New Zealand showing trends in the frequency of medium-term drought from 1972–2022. It shows whether trends are very likely increasing, likely increasing, indeterminate, likely decreasing, or very likely decreasing.

El Niño Southern Oscillation and Southern Annular Mode influence natural climate variability in Aotearoa

  • Natural patterns of change (oscillations) influence the weather and climate in Aotearoa, including the El Niño Southern Oscillation (ENSO), Interdecadal Pacific Oscillation (IPO) and Southern Annular Mode (SAM) (see Indicators: ENSO, IPO, SAM).
  • El Niño is a warm-water equatorial current across the Pacific Ocean that is associated with a fluctuation of a global-scale tropical and subtropical surface pressure pattern called the Southern Oscillation. This, coupled with atmospheric-ocean phenomenon, is known as ENSO. It influences global and national rainfall, temperature and wind patterns, and has three phases: neutral, El Niño and La Niña (NIWA, nd-a).
  • In Aotearoa an El Niño phase in summer can bring increased westerly winds, more rain in the west and dryness in the east; in winter it can lead to more frequent, cooler southerly winds. During a La Niña phase, we may experience more north-easterly winds, wetter conditions in the north and east, and higher sea levels. We can also experience warmer than average air and sea temperatures.
  • The most recent El Niño phase was from July 2015 to April 2016. This was one of the two strongest El Niño phases during 1990 to 2022, with the other occurring during 1997 to 1998. The most recent La Niña phase was from April 2022 to December 2022 (see Indicator: El Niño Southern Oscillation).
  • The frequency and intensity of El Niño events between 1951 and 2000 were high relative to 1901 to 1950, but this does not necessarily reflect a long-term trend. The link between climate change and ENSO is still uncertain (Gulev et al, 2021).
  • SAM is associated with the strength and position of westerly winds and storm tracks. Evidence indicates the positive trend of SAM over recent decades is an indirect response to ozone depletion and climate change (Goyal et al, 2021; King et al, 2023; Morgenstern, 2021).

Extreme winds are decreasing at most sites in Aotearoa, which may be due to a positive Southern Annular Mode phase

  • Trends in annual average of the daily maximum wind gust decreased at 14 sites and increased at 3 sites (Gisborne, New Plymouth and Queenstown).
  • Trends in annual maximum wind gust decreased at 12 sites, increased at 3 sites (Gisborne, New Plymouth and Queenstown) and were indeterminate at 2 sites (figure 9).
  • Extreme wind measures the annual average of the daily maximum wind gust (a measure of windiness) and annual maximum wind gust (a measure of wind strength). Seventeen sites around the country had sufficient data between 1980 and 2022 to allow trends to be determined.
  • The recent declines in extreme wind magnitude and frequency are likely to be related to SAM more often being in a positive phase that moves storm tracks further south (NIWA, nd-b; Thompson et al, 2011).
Figure 9 Trend in the annual maximum gust. Alt text in caption
A point map of Aotearoa New Zealand showing annual maximum wind gust trends from 1980–2022. It shows whether trends are very likely increasing, likely increasing, indeterminate, likely decreasing, or very likely decreasing.

Extreme weather events are becoming more frequent and intense with climate change

  • A body of local evidence and research is growing that shows the intensity and/or frequency of extreme weather events we experience in Aotearoa is increasing with climate change (Harrington & Frame, 2022; Harrington & Renwick, 2014; Salinger et al, 2019; Thomas et al, 2023).
  • The frequency of tropical cyclones is slightly decreasing over the South Pacific basin, but the cyclones that do form are more severe (Chand et al, 2022; NIWA, 2017; Roberts et al, 2020).
  • We have recently seen multiple severe weather events that overlap in time and/or space. One example is the atmospheric river that delivered an unprecedented amount of rainfall to Auckland in January 2023, closely followed by the effect of Cyclone Gabrielle across much of the North Island in February 2023 (Macinnis-Ng et al, 2023).
  • Nine of the ten most damaging floods in Aotearoa between 2007 and 2017 occurred during atmospheric river events (Reid et al, 2021). Evidence indicates that, in mountain areas and in northern Aotearoa, much of the rainfall total as well as extreme rainfall events could be related to atmospheric rivers, although with seasonal variation (Shu et al, 2021). In 2021, extreme rainfall events that caused flooding in Canterbury were 10 percent to 15 percent more intense because of climate change. Similarly, extreme weather, and associated flooding, on the West Coast in 2021 were nearly 10 percent more intense due to climate change (MfE, 2023b).
  • Floods are some of Aotearoa New Zealand’s most frequent and damaging natural hazards (Frame et al, 2020; Officials Committee for Domestic and External Security Coordination, 2007). Floods are most commonly caused by heavy and/or prolonged rainfall but can be mitigated by other factors such as land use and infrastructure (Auliagisni et al, 2022).
  • The frequency of extreme temperature events in Aotearoa has doubled due to human influence (Thomas et al, 2023).
  • Wildfire risk is changing in Aotearoa, the number of days with very high and extreme fire danger increased at 12 sites and decreased at 8 of the 28 monitoring sites between 1997 and 2019 (see Indicator: Wildfire risk). Comparison of fire risk is complicated due to the difference in fuel type used for analysis between sites (see appendix A).
  • Between 1 July 2020 and 27 June 2021, 4,586 fires burnt an area of 13,348 hectares (larger than the area of Hamilton), surpassing the 5-year and 10-year averages for the number of wildfires and area burnt (FENZ, 2022c).
  • In 2022, the Awarua Wetland Ramsar site in Southland and Kaimaumau–Motutangi in Northland were significantly affected by wildfire (FENZ, 2022a, 2022b).