Pressures on our atmosphere and climate

Five key facts from the pressures section of our Atmosphere and climate. An illustrative icon accompanies each one.

Ngā pēhanga ki te taiao

Pressures on the environment

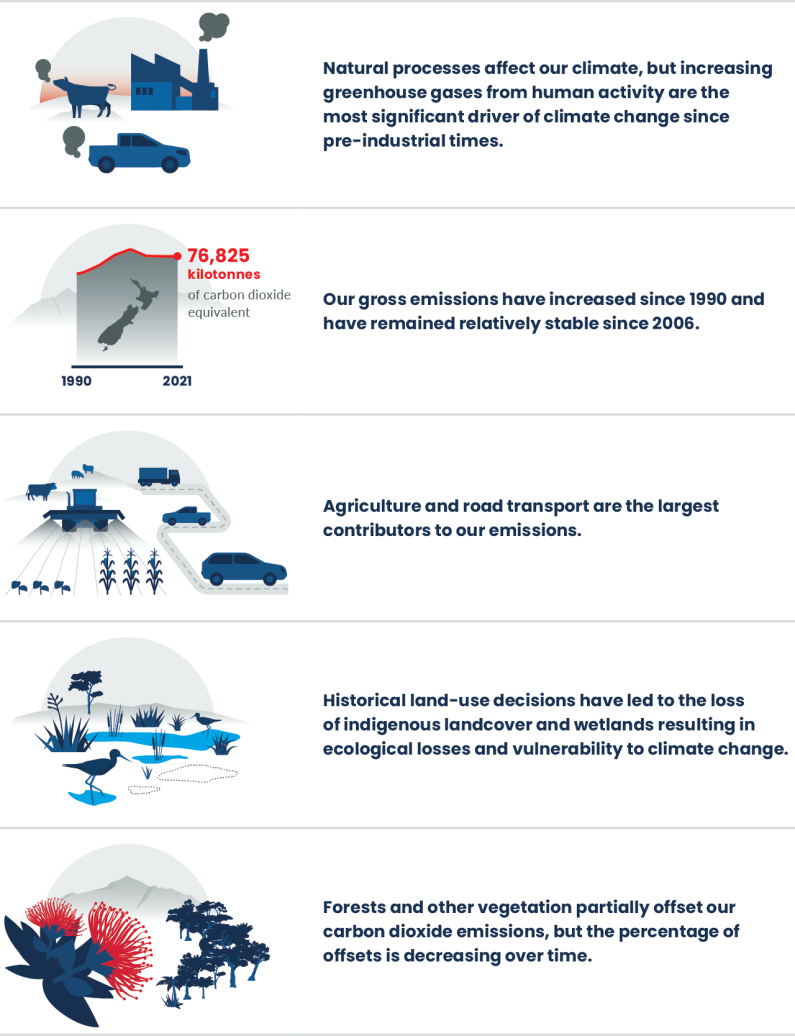
 Greenhouse gas emissions from human activities are accumulating in the atmosphere and are the most significant driver of climate change since pre-industrial times. Natural influences, such as climate oscillations, can also lead to climate fluctuations. However, by increasing the amount of greenhouse gases in the atmosphere, humans are having a profound impact on our climate.

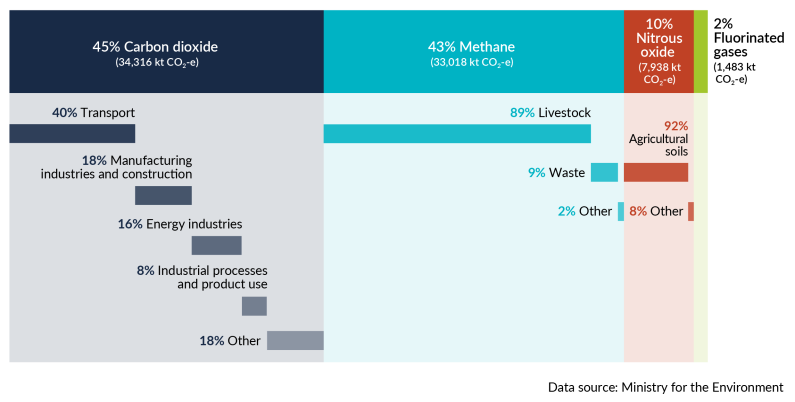
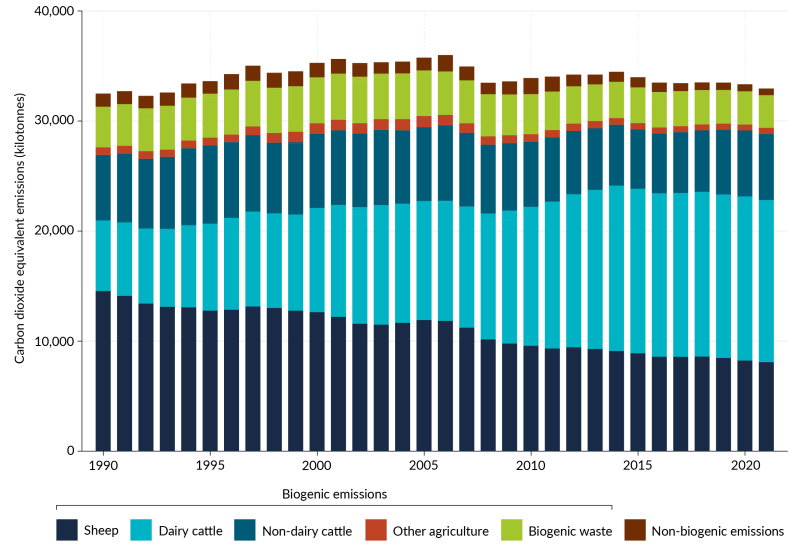
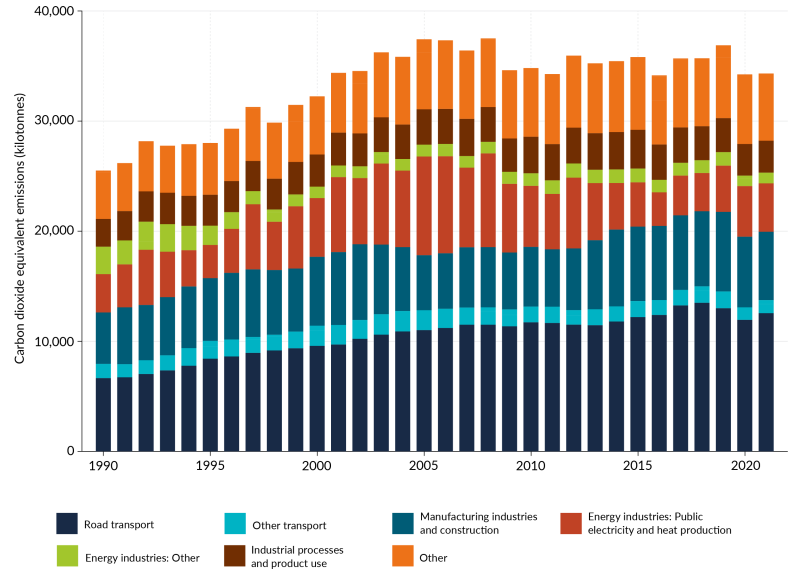
Our domestic greenhouse gas emissions contribute to this global picture. Nearly half of our emissions come from agriculture, mainly methane from farm animals. Our energy sector is the second largest contributor, mainly carbon dioxide resulting from the combustion of fossil fuels for various purposes, like driving, air travel, manufacturing and coal-fired electricity generation. Although a significant portion of our electricity comes from clean, renewable sources, we still supplement it with coal and gas generation. Furthermore, we are heavily reliant on fossil fuels for transportation energy.

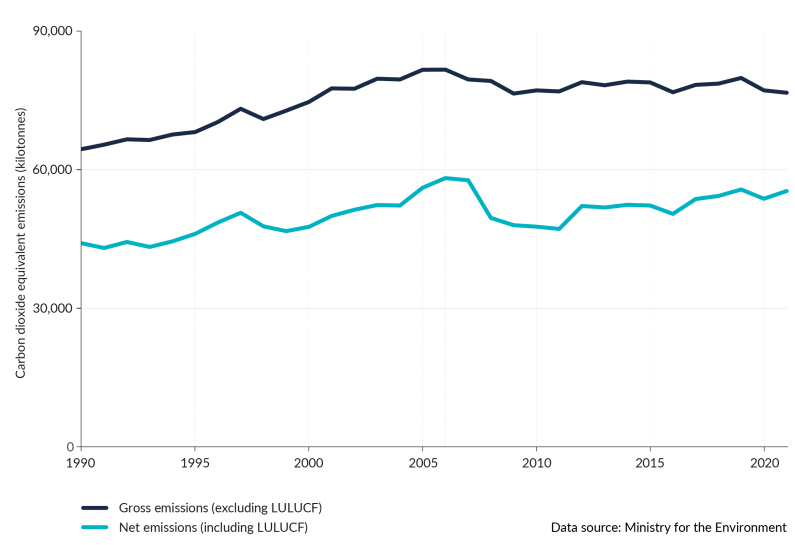
Trees and other vegetation partially offset some carbon dioxide emissions, although this is diminishing over time. Historical land-use decisions have led to the loss of indigenous land cover (with over half of the total land area modified for agriculture, forestry and housing) and wetlands (where only around 10 per cent of historic wetlands remain). This loss reduces their capacity to absorb carbon and support nature’s contribution to people, such as promoting ecological processes, mitigating flooding and landslides, and reducing erosion. The removal of this natural infrastructure not only results in ecological losses but also reduces climate resilience. As long as Aotearoa New Zealand’s net emissions (total emissions plus any emissions added or removed by the land use, land-use change and forestry sector) are greater than zero, we are contributing to further climate change.

Pressures on the atmosphere and climate also put pressure on the holistic system that connects landscapes, oceans, ecosystems and people

  • A holistic view acknowledges the intrinsic connection between the atmosphere, climate and wider environmental system. It recognises the interdependencies and inter relatedness of things, including between people and their environment.
  • Science supports the view of an interconnected Earth system, with climate, biodiversity and humans interacting across complex networks (Levin, 1998; Marquet et al, 2019; Solé & Levin, 2022).
  • A Māori perspective of the natural world recognises that non-human parts of the environment have mauri and are considered tupuna (ancestors) and taonga (treasured), with inherent rights, value and agency (see Te ao Māori, whakapapa, and our connection to atmosphere and climate, for a definition of mauri). When the mauri of the atmosphere and climate is unbalanced, it affects all other systems in te taiao (the environment), including people (Harmsworth & Awatere, 2013; Mead, 2003).
  • The holistic and reciprocal connection between Māori and the natural world is formed through shared whakapapa (genealogy). The creation and ongoing balance of the natural world is interconnected through this web of kinship, and responsibility to care is reflected in pūrākau (stories) where these relationships shape connection to the environment (Forster, 2019; Harmsworth & Awatere, 2013).
  • In one pūrākau, when humans change the balance established at the beginning with Te Ao Mārama (the world of light) by putting pressure on the atmosphere, Tāwhirimātea and his offspring (the atua that represent changes in meteorology and the atmosphere) protect Ranginui (the Sky Father) and respond by attacking the atua of the ngahere (forest), moana (ocean), and plants and animals with severe weather. These entities are not only considered personifications of the winds, or earth and sky, but also an expression of mauri (see Te ao Māori, whakapapa, and our connection to atmosphere and climate for a definition of atua) (Tunks, 1997).
  • Within te ao Māori (Māori worldview), human activities that adversely affect the delicate balance of gases in the atmosphere can have cascading effects. When we put pressure on the atmosphere and climate, we shift the mauri of that part of the ecosystem, in turn putting pressure on all ecosystems including people and communities (Harmsworth et al, 2016; MfE, 2021a).

Our oceans, land and atmosphere are closely connected through water, heat and carbon

  • After their separation, the soft mists of Papatūānuku (Earth mother) rose to greet Ranginui, and the tears from Ranginui took the visible form of rain and dew that fell from the sky to give life to the land (Reed, 2021; Salmond et al, 2019). This recognises the holistic connection of water in the atmosphere, in groundwater and on land.
  • Atmospheric circulation affects moisture transport and has a complex connection to precipitation in Aotearoa (Bennet & Kingston, 2022). Storm systems from the tropics can move south towards Aotearoa and evolve from tropical cyclones to take on the properties of mid-latitude storms (Sinclair, 2002).
  • Aotearoa, surrounded by the ocean, has mid-latitude prevailing westerly winds. These winds control regional air temperature and moisture, and regulate ocean circulation, heat transport and carbon uptake (Bracegirdle et al, 2020; Goyal et al, 2021).
  • Mountains down the length of the North Island and South Island, including the Southern Alps, interact with different air masses and the westerly airflow. This influences weather, climate and precipitation (Cullen et al, 2019; Little et al, 2019; Sturman & Spronken-Smith, 2001).
  • Atmospheric rivers are long, narrow regions in the atmosphere that transport significant quantities of water vapour. Precipitation is often observed when atmospheric rivers reach land and interact with topography (Prince et al, 2021; Waliser & Guan, 2017).
  • Aotearoa is in a region of high atmospheric river activity with a range of occurrences identified (Little et al, 2019; Prince et al, 2021; Reid et al, 2021; Waliser & Guan, 2017).
  • Global oceans have absorbed nearly 25 percent of total human carbon emissions since the start of the industrial revolution (Friedlingstein et al, 2019) and captured 90 percent of the excess heat generated by these emissions (Lindsey & Dahlman, 2023).
  • Water vapour is a naturally occurring greenhouse gas in the Earth’s atmosphere that has a strong warming effect, and its atmospheric concentration is closely linked to temperature (IPCC, 2007).

Emissions from human activities put the most pressure on our atmosphere and climate

  • Emissions from human activities including agriculture, land use and burning of coal, oil and gas have caused an increase in the concentration of greenhouse gases in the Earth’s atmosphere (IPCC, 2023).
  • Carbon dioxide, methane and nitrous oxide are some of the most significant of the greenhouse gases that human activities are emitting, with additional gases, such as hydrofluorocarbons, also causing pressure (Montzka et al, 2011, Prentice et al, 2001).
  • Carbon dioxide has the biggest effect on climate warming from human activities. This is because it is emitted in large quantities by many different processes and stays in the atmosphere for a long time (EPA, 2023a, Prentice et al, 2001).
  • Methane and nitrous oxide are emitted in smaller quantities but also make up a significant contribution to warming. Methane has far greater heat trapping potential than carbon dioxide but has a relatively short atmospheric lifetime of around 9 years. While methane is short-lived, reducing methane emissions could rapidly reduce the rate of warming in the near term. Nitrous oxide is also a powerful greenhouse gas that remains in the atmosphere for around 120 years (Montzka et al, 2011).
  • Other greenhouse gases, like hydrofluorocarbons, are potent, sometimes thousands of times higher than carbon dioxide (EPA, 2023b). These gases are generally short-lived and emitted in much smaller quantities than carbon dioxide, methane and nitrous oxide (Montzka et al, 2011).
  • The concentration of a greenhouse gas in the atmosphere depends on the rates of its emission into the atmosphere and the rates of processes that remove it from the atmosphere. Concentrations of some greenhouse gases decrease almost immediately in response to emission reduction, while others can continue to increase for centuries even with reduced emissions (IPCC, 2007).

Our gross emissions have increased between 1990 and 2021, though they have remained relatively stable since 2006

  • Aotearoa New Zealand’s share of global greenhouse gases emissions is small, but its gross emissions per person are high. In 2021, our gross greenhouse gas emissions (or total emissions) were 19 percent higher than in 1990. Since peaking in 2006, our gross emissions have been relatively stable despite increases in population and economic activity (MfE, 2023a) (figure 1).
  • The two largest contributors to our gross emissions in 2021 were the agriculture sector, at 49 percent, and energy sector (including transport), at 41 percent (MfE, 2023a).
  • Methane and nitrous oxide, largely from agricultural sources, made up over half of our gross emissions (43 percent and 10 percent, respectively). The remaining emissions consisted mostly of carbon dioxide (45 percent), mainly from the energy sector and industrial processes and product use (IPPU) sector (MfE, 2023a) (see figure 2).
  • The COVID-19 pandemic had an observable effect on our gross emissions in 2020, with a 3 percent reduction on 2019 levels. This reduction was primarily attributed to decreased fuel usage in road transport, manufacturing, construction, and domestic aviation (MfE, 2023a).

Figure 1: Aotearoa New Zealand’s annual greenhouse gas emissions, 1990–2021

J55722 MFE Figure 1 Greenhouse gas emissions 03 FINAL
A line graph showing Aotearoa New Zealand’s annual greenhouse gas emissions from 1990 to 2021. It shows gross and net emissions in kilotonnes of carbon dioxide equivalent.

Note: Emissions presented here exclude emissions from Tokelau. LULUCF refers to the land use, land-use change and forestry sector.
  • In 2021, gross emissions further declined by 0.7 percent, compared with 2020, largely due to decreases in emissions across the agriculture sector. COVID-19 continued to affect the energy sector in 2021, and emissions from other sectors largely rebounded to pre pandemic levels (MfE, 2023a).
  • Our net emissions (total emissions plus any emissions added or removed by the land use, land-use change and forestry sector) have increased by 25 percent between 1990 and 2021, due to the underlying increase in gross emissions (MfE, 2023a) (figure 2).

Figure 2: Aotearoa New Zealand’s gross greenhouse gas emissions, 2021

J55722 MFE Figure 2 NZs gross greenhouse gas emissions 03 FINAL
A percentage ribbon graph showing Aotearoa New Zealand’s gross greenhouse gas emissions by gas and sector of the economy in 2021. It shows both the percentage of total emissions and absolute amount of emissions in kilotonnes of carbon dioxide equivalent.

Note: Emissions presented here exclude emissions from Tokelau. CO2-e = carbon dioxide equivalent.

Most of our methane emissions come from agriculture and are declining weakly due to a decrease in dairy cattle and sheep populations

  • The agriculture sector accounts for nearly half (49 percent in 2021) of Aotearoa New Zealand’s gross emissions. Agricultural emissions were up 13 percent from 1990 and down 1 percent from 2018 (MfE, 2023a).
  • In 2021, 89 percent of our methane emissions came from livestock (figure 2). Livestock methane emissions were up 6 percent from 1990 and down 1 percent from 2018 (MfE, 2023a).
  • Methane emissions from dairy cattle decreased by 2 percent between 2018 and 2021, and emissions from sheep and pigs decreased by 6 percent and 13 percent, respectively (MfE, 2023a) (figure 3).
  • In 2021, 92 percent of all nitrous oxide emissions were from agricultural soils (figure 2). These emissions mainly come from the urine and dung of grazing animals and synthetic nitrogen fertiliser, which is converted to nitrous oxide by soil microbes. Nitrous oxide emissions from agricultural soil were up 40 percent from 1990 and down 1 percent from 2018 (MfE, 2023a).
  • Agriculture emissions most recently peaked in 2014 after which they have stayed relatively stable (MfE, 2023a). The peak in agriculture emissions coincided with a peak in the national dairy herd (see Indicator: Livestock numbers).
  • Waste accounted for 9 percent of our methane emissions in 2021 (figure 2). Since peaking in 2002, emissions from the waste sector have generally decreased due to ongoing improvements in the management of solid waste disposal in landfills and wastewater treatment. Methane emissions from waste were down 5 percent from 2018 (MfE, 2023a).

Figure 3: Aotearoa New Zealand’s gross methane emissions (as carbon dioxide equivalent), 1990–2021

J55722 MFE Figure 3 NZs gross methane emissions 03 FINAL
A percentage bar graph showing Aotearoa New Zealand’s gross methane emissions by sector of the economy from 1990–2021. It shows emissions in kilotonnes of carbon dioxide equivalent.

Note: Emissions presented here exclude emissions from Tokelau.

Transport is our largest source of carbon dioxide emissions, with electric vehicles accounting for only a small proportion of our light vehicle fleet

  • Aotearoa has one of the highest per capita rates of carbon dioxide emissions from road transport, compared with other developed countries (MfE, 2023a).
  • Emissions from road transport accounted for 37 percent of our gross carbon dioxide emissions in 2021. Nearly 64 percent of all transport carbon dioxide emissions are from cars and light-duty trucks (SUVs, utes, vans and light trucks and buses up to 3,500 kilograms) (MfE, 2023a).
  • Carbon dioxide emissions from road transport increased by 89 percent between 1990 and 2021. Influenced by the COVID-19 pandemic restrictions, carbon dioxide emissions from road transport decreased by 7 percent between 2018 and 2021 (figure 4). Over the same period, emissions from cars, and heavy-duty trucks and buses were down 12 percent and 2 percent respectively, while emissions from light-duty trucks increased 0.5 percent (MfE, 2023a).
  • The number of active electric vehicles (battery electric vehicle or plug-in hybrid electric vehicle) in Aotearoa has been growing rapidly in recent years. The electric vehicle fleet size was 85,593 by August 2023, which almost quadrupled, compared with August 2020. Despite the growing sales of electric vehicles, electric vehicle uptake accounts for only 2 percent of the total light vehicle fleet in Aotearoa in August 2023 (EVDB, 2023).

Figure 4: Aotearoa New Zealand’s gross carbon dioxide emissions, 1990–2021

J55722 MFE Figure 4 NZs gross carbon dioxide emissions 02 FINAL
A percentage bar graph showing Aotearoa New Zealand’s gross carbon dioxide emissions by sector of the economy from 1990–2021. It shows emissions in kilotonnes of carbon dioxide equivalent.

Note: Emissions presented here exclude emissions from Tokelau.

A large proportion of our electricity comes from renewable sources, but we rely heavily on fossil fuels for heat and energy for manufacturing and construction

  • The manufacturing industries and construction sector was Aotearoa New Zealand’s next biggest source of gross carbon dioxide after transport, accounting for 18 percent of our gross carbon dioxide emissions in 2021 (MFE, 2023a) (figure 2).
  • Carbon dioxide emissions from the manufacturing industries and construction sector were mainly from using fossil fuels to produce heat and energy. Carbon dioxide emissions from the manufacturing industries and construction sector were up 33 percent from 1990 and down 9 percent from 2018 (MfE, 2023a) (figure 4).
  • The food processing, beverages and tobacco product subsector made up the largest portion of manufacturing emissions, mainly because fossil fuels are still used in many industrial boilers. In 2021, the subsector produced 8 percent of our gross carbon dioxide emissions. Carbon dioxide emissions from the food processing, beverages and tobacco product subsector were up 68 percent from 1990 and down 8 percent from 2018 (MfE, 2023a).
  • Public electricity and heat production accounted for 13 percent of our gross carbon dioxide emissions in 2021. Carbon dioxide emissions from public electricity and heat production were up 26 percent from 1990 and up 27 percent from 2018 (MfE, 2023a).
  • In 2021, the share of electricity generated from renewable energy sources in Aotearoa was 82 percent, compared with 81 percent in 1990 (MfE, 2023a). The percentage of Aotearoa New Zealand’s electricity generated from renewable energy sources varies each year, depending on the amount of rainfall and, to a lesser extent, wind. We still supplement electricity generation with coal and gas generation (EECA, 2023).
  • The IPPU sector accounted for 8 percent of our gross carbon dioxide emissions in 2021 (figure 2). Carbon dioxide emissions from the IPPU sector were up 15 percent from 1990 and down 6 percent from 2018 (MfE, 2023a).

Carbon dioxide is removed from the atmosphere when plants grow and store carbon, which offsets some, but a decreasing percentage, of our emissions

  • Land use, land-use change and forestry offset 27 percent of gross greenhouse gas emissions in 2021 in Aotearoa. This was 4 percent less than 1990, and 12 percent less than 2018 (MfE, 2023a).
  • Net removals are variable because of the influence of forest planting and harvesting cycles. Net removals from land use, land-use change and forestry in 2021 were 4 percent more than in 1990, and 12 percent less than 2018, largely due to the increase in the harvest rate of planted forests (MfE, 2023a).
  • Before human arrival, more than 80 percent of the land was covered with native forest (see Indicator: Predicted pre-human vegetation). Recently, indigenous land cover area losses have continued. These losses reduce the capacity of our native forests and other vegetation to absorb carbon. Between 2012 and 2018, indigenous land cover area decreased by 12,869 hectares, with Southland having the highest area of net loss (3,944 hectares) (see Indicator: Indigenous land cover).
  • Modelling indicates that our forest ecosystems cold be absorbing up to 60 percent more carbon dioxide than had been calculated, with much of this uptake likely occurring in native forests (Steinkamp et al, 2017).

Repo (wetlands) have unique biodiversity and are important for carbon storage

  • Repo in coastal areas have unique biodiversity, such as saltmarshes, mangroves and seagrasses, which capture and store ‘blue carbon’ through photosynthesis and sediment accumulation (Mcleod et al, 2011; Ross et al, 2023).
  • Healthy repo in coastal areas can also stabilise coastlines, purify water through filtering out nutrients and sediments, and increase climate resilience by buffering communities from storm surges and floods (Clarkson et al, 2013; McLeod et al, 2011).
  • Globally, many human activities negatively affect repo (land-use change, draining, pollution, sedimentation) (Lotze et al, 2006; Murray et al, 2022). It is estimated around 90 percent of repo in Aotearoa have been lost since pre-human settlement (Dymond et al, 2021).
  • When repo in coastal areas are degraded, their plants and soils are washed away, and their organic carbon is exposed to microbial oxidation, which increases greenhouse gas emissions (Lovelock et al, 2017; Pendleton et al, 2012).

Aerosols can have heating and cooling effects on the climate

  • Aerosols are small solid or liquid particles in the atmosphere that can come from human and natural sources, including transport, coal fires, sea-salt and volcanoes (Ruiz-Arias et al, 2021; Sakai et al, 2016; Shi et al, 2022).
  • Aerosols can absorb or scatter incoming solar radiation and be the seed on which cloud drops and ice crystals can grow. Through these processes, aerosols can influence the weather and climate (Hamilton, 2015; Ruiz-Arias et al, 2021; Spada et al, 2015).
  • Black carbon strongly absorbs sunlight due to its dark colour and has localised warming effects in Aotearoa. It mostly comes from vehicles, domestic fires and wildfires (Bond et al, 2013; Lee et al, 2022).
  • No inventory exists for black carbon emissions in Aotearoa, though nitrogen dioxide emissions can be used as a proxy for these (see Our air 2021). Over 2011 to 2020, nitrogen dioxide trends were improving at 6 out of 7 sites, and indeterminate at one site (see Indicator: Nitrogen dioxide concentrations).
  • Wildfires and dust storms in Australia produce dust aerosols that can be transported to Aotearoa and have the potential to influence our climate (Brahney et al, 2019; Nguyen et al, 2019).

Global efforts to reduce the use of ozone depleting substances have seen the hole in the ozone layer reduce, but some substitutes are potent greenhouse gases

  • The ozone layer stops potentially harmful ultraviolet radiation reaching the Earth’s surface, but damage to the ozone layer was discovered over Antarctica in the 1980s.
  • The Montreal Protocol was established in 1987 to reduce the production of ozone depleting substances, which are human-made chemicals that destroy the ozone layer. Aotearoa does not manufacture any of the substances controlled under the protocol (MfE, 2021b).
  • Methyl bromide is an ozone depleting substance that is notably still used in Aotearoa to fumigate logs for export, however, the Government is working with importing countries on accepting alternative treatments for logs.
  • The size of the ozone hole naturally varies from year to year but is on track to recover, and in 2019, was at its smallest since 2002 (WMO, 2022).
  • The annual average thickness of the ozone column decreased between 1979 and 2022. The average over this period was slightly thicker than the global average (see Indicator: Atmospheric ozone) (Liley & McKenzie, 2006).
  • Hydrofluorocarbons and perfluorocarbons are potent greenhouse gases often used as substitutes for ozone depleting substances. Hydrofluorocarbon emissions accounted for 32 percent of the IPPU sector in 2021 and were up 8 percent since 2018 (MfE, 2023a). Hydrofluorocarbons and related compounds are being phased down under the Kigali Amendment to the Montreal Protocol (MfE, 2019).