Our air 2024 Tō tātou hau takiwā

Our air 2024 is the Ministry for the Environment and Stats NZ’s latest three-yearly update about air quality in Aotearoa New Zealand.
The report shows how human activities and natural phenomena are affecting air quality and impacting people and nature.
Our air 2024 is the Ministry for the Environment and Stats NZ’s latest three-yearly update about air quality in Aotearoa New Zealand.
The report shows how human activities and natural phenomena are affecting air quality and impacting people and nature.
Tēnā koutou katoa
Aotearoa New Zealand’s isolation in the Pacific Ocean and strong prevailing westerlies mean that our overall air quality is among the best in the world. Our large areas of clean air and smog-free skies provide many benefits for New Zealanders and are a major drawcard for international visitors.
Many monitoring sites across the country have shown improving air quality since the last Our air report, largely because emissions from transport and home heating have reduced. However, our air quality is not good everywhere. In cities and urban areas, where most of us live, air pollution is often above national standards and international guidelines. Some regions are worse affected than others, and the level of air pollution varies between seasons and times of day. This is important as it’s becoming clear that for most air pollutants, there are significant health impacts.
We are continually learning more about the effects of poor air quality on our health and environment, but we still need more and better data to inform high-quality decision making. Most of Aotearoa New Zealand’s monitoring network is located in urban areas, and as a result we know little about the effects of air pollution on our native species and ecosystems. We also lack sufficient data on some emerging pollutants, as well as on other aspects of air quality such as pollen, light pollution and noise pollution.
A strong evidence base is crucial for informing decisions about the natural and built environments and ensuring we continue to meet the social and economic needs of people, now and in the future. This report provides valuable context on the challenges we face with air quality in Aotearoa, as well as where things are getting better.
| James Palmer Secretary for the Environment |
Mark Sowden Government Statistician |
The air we breathe plays an important role in both our health and our quality of life. In Aotearoa New Zealand, air quality is generally good compared with many other countries. Many monitoring sites across our country have shown improvements in recent years. But air pollution remains an important public health issue. At particular times and places, and under certain conditions, our air quality can result in harm.
While we cannot see the air, its presence is made visible by its impacts on people and the environment. If the air is not healthy, we will see impacts on human and environmental health and our connections to the environment (see Environment Aotearoa 2022).
In te reo Māori (Māori language), the word hau can mean air or wind, and can also refer to the vital essence or vitality of a person, place or object. The origins of these words recognise that our hauora (health) and the health of hau takiwā (air) are interlinked. In te ao Māori (Māori world view), the human and non-human worlds are indivisible. All things are interconnected, and whakapapa (genealogy) relationships connect people with the environment, including the air, in a multitude of ways.
For many Māori, air is a taonga (treasure). This view is reflected in Māori creation stories where the separation of Ranginui (Sky Father) and Papatūānuku (Earth Mother) allowed light and air into the world. Light and air link all components of Earth and the atmosphere, and reflect cultural connections to te taiao (the environment).
Aspects of air quality that affect our lives include emissions of pollutants as well as light pollution, noise pollution, and odour. The main sources of air pollution in Aotearoa are transport and home heating. Other human activities including agriculture, construction, and industry also put pressure on our air quality through a range of air pollutants.
Some of the pressures on our air quality have been decreasing in recent years, with declining emissions of most pollutants. However, increasing urbanisation can mean that more people are at risk of exposure to polluted air.
Since Our air 2021 our understanding of the health impacts of fine particulate matter (PM2.5) and nitrogen dioxide has increased. As a result, concentrations of PM2.5 and nitrogen dioxide have been monitored at more sites, with implications for the way we produce and update environmental indicators. Our air 2024 builds on updates of six air quality indicators, and reports for the first time on the indicator of health impacts of PM2.5 and nitrogen dioxide.
Transport, in particular motor vehicle emissions, remain a large source of air pollutants, including PM2.5 and nitrogen dioxide. Transport emissions were lower for all monitored pollutants except sulphur dioxide in 2019 than 2012. Motor vehicle engine and fuel improvements continue to contribute to reductions. This is despite increases in the total number of kilometres travelled in a year, vehicle fleet numbers, and proportion of diesel vehicles. In 2022 we reached the largest fleet size to date, with the largest percentage of diesel vehicles (21 percent).
Burning wood for home heating also continues to be a major source of PM2.5. According to the 2018 Census data, fewer homes are burning wood for home heating, and the use of heat pumps continues to increase. There was a 32 percent increase in the sales of heat pump units from 2020 to 2021 and further increases in 2022 and 2023.
Particulate matter (PM10 and PM2.5), nitrogen dioxide, and sulphur dioxide concentrations continue to improve at most monitoring sites. However, many sites have still been reaching levels above World Health Organisation (WHO) guidelines (see Guidelines and standards we report against).
Evidence in recent years has shown that air pollution has greater health impacts in Aotearoa than previously thought. The health impacts in this report are therefore much higher than those reported in Our air 2021, largely due to an increase in our understanding of nitrogen dioxide exposure. These impacts come with significant social costs, with these costs falling disproportionately on already disadvantaged communities. Our understanding of the health impacts of air pollution will improve as we monitor and investigate both existing and emerging pollutants.
Our air 2024 is the latest in a series of environmental reports produced by the Ministry for the Environment and Stats NZ. It is the fourth report in the series dedicated to our air, following the 2014, 2018 and 2021 reports. It is part of the third cycle of reports released under the Environmental Reporting Act 2015.
Our air 2024 builds on previous reporting and contributes further information while we progress the fundamental changes needed to improve the reporting system in line with recommendations from the Parliamentary Commissioner for the Environment (PCE) (PCE, 2019). The primary focus of this report is on updating recent indicators and scientific evidence about air. Our air 2024 updates some of the indicators reported on in previous years and brings those indicators together with what we know from past reports and insights from the research literature.
As required by the Environmental Reporting Act 2015, this report uses the concepts of pressure, state and impact to report on the environment and these concepts form the basis for the report’s structure. The logic of the framework is that pressures can cause changes to the state of the environment, and these changes may have impacts on air and associated human values. The report also includes future outlook assessments. The evaluation of specific policies is out of scope for environmental reporting releases under the Environmental Reporting Act 2015, and therefore is not included here.
The data used in this report, some of which is monitored, and some of which is modelled, came from many sources including data from Crown research institutes and central and local government (see the Acknowledgements). This report uses modelling outputs from the Health and Air Pollution in New Zealand (HAPINZ) 3.0 study.
Two sources have been used through the report:
For the indicators related to our air and the date when each one was last updated, see the Stats NZ indicator web pages.
See appendix A for details of the monitoring sites presented in this report.
A ‘body of evidence’ approach provided further supporting information. This body of evidence includes peer-reviewed, published literature, as well as mātauranga Māori (Māori knowledge) and observational tools used to identify changes in our air. All data used in this report, including references to scientific literature, were corroborated and were checked for consistency with the original source. A team of analysts and scientists from within and outside the Ministry for the Environment and Stats NZ produced the report. In addition, a panel of independent experts reviewed it.
This report evaluates monitored data against two primary air quality standards or guidelines – one national and one international – to indicate potential impacts on human health.
Nationally, the Resource Management National Environmental Standards for Air Quality (NESAQ) Regulations 2004 set legally binding levels of air pollution that must not be exceeded.1 The levels of these standards are set based on international research and guidelines available at the time (eg, the WHO guidelines – see below). Where no NESAQ standard exists, as is the case for fine particulate matter (PM2.5), for example, the WHO guidelines can provide guidance directly.
In contrast to the NESAQ Regulations 2004, the WHO Global Air Quality Guidelines (particulate matter (PM2.5 and PM10), ozone, nitrogen dioxide, sulphur dioxide and carbon monoxide) (WHO, 2021) (WHO guidelines) are based on an evaluation of the most recent science on health impacts from air pollution and identify air pollution levels above which there are significant risks to human health. This is the only consideration used for setting the guideline levels, although the WHO guidelines also discuss how growing evidence indicates that for most pollutants there is no safe level. They are intended to inform air quality management but, as international guidelines, they are not legally binding. The WHO guideline values apply to the 99th percentile – that is, they allow three to four days above the guideline per year (WHO, 2021).
Table 1 summarises the guidelines and standards we report against from each of these sources.
| Air pollutant | NESAQ | WHO air quality guidelines | |||
|---|---|---|---|---|---|
| Time period | Concentration | Number of exceedances allowed |
Time period | Concentration | |
| Particulate matter (PM10) | 24-hour | 50 µg/m3 | 1 in a 12-month period | 24-houra | 45 µg/m3 |
| Annual | 15 µg/m3 | ||||
| Fine particulate matter (PM2.5) | No standard | No standard | No standard | 24-houra | 15 µg/m3 |
| Annual | 5 µg/m3 | ||||
| Nitrogen dioxide (NO2) | 1-hour | 200 µg/m3 | 9 in a 12-month period | 24-houra | 25 µg/m3 |
| Annual | 10 µg/m3 | ||||
| Sulphur dioxide (SO2) | 1-hour | 350 µg/m3 | 9 in a 12-month period | 24-houra | 40 µg/m3 |
| 1-hour | 570 µg/m3 | None | |||
| Ozone (O3) | 1-hour | 150 µg/m3 | None | 8-houra | 100 µg/m3 |
| Peak seasonb | 60 µg/m3 | ||||
| Carbon monoxide (CO) | 8-hour | 10 mg/m3 | 1 in a 12-month period | 24-houra | 4 mg/m3 |
Note:
a. 99th percentile (ie, 3–4 exceedance days per year).
b. Average of daily maximum 8-hour mean O3 concentration in the six consecutive months with the highest six‑month running-average O3 concentration.
µg/m3: micrograms per cubic metre.
mg/m3: milligrams per cubic metre.
1 See the Resource Management (National Environmental Standards for Air Quality) Regulations 2004 [New Zealand Legislation website]
Our air 2024
Across Aotearoa New Zealand as a whole, air quality is good compared to many other countries. However, poor air quality exists at particular places and times which has negative health impacts for people living there.
Air quality is improving in most places where it is monitored.
Particulate matter and nitrogen dioxide (NO2) are key pollutants that contribute to poor air quality.
Despite improvements in air quality at monitored sites, our growing understanding of health impacts shows that most air pollutants have no safe level.
Modelling indicates 3,239 premature adult deaths were associated with air pollution in 2019.
Modelling indicates in 2019 the annual social cost of air pollution was estimated at Modelling indicates $15.3 billion.
Human activities and natural phenomena affect the quality of the air we breathe. We are a remote island nation far from sources of pollution in other countries, and so almost all our air pollution is generated locally. Home heating and transport are major human sources of air pollution in Aotearoa. Other contributing human activities are agriculture, construction and industry. Natural sources can also affect air quality, such as where small particles of salt from sea spray are suspended in the air.
Pressures on air quality vary across Aotearoa. For example, air pollution is greater in urban areas with a lot of traffic or in areas where more people use wood burners to heat their homes. The time of day or year can also make a difference. For instance, more people use wood burners in the evening and in winter. Another factor affecting the level of air pollution is the environment into which we emit pollutants: local geography and weather patterns influence how much pollutants either disperse or build up. All these variables influence air quality and, combined with how close we are and our level of exposure, impact how much pollution we breathe in.
Pollutant emissions are not the only influences on the quality of the air we experience. Light, noise and odour pollution contribute, putting pressure on our health, quality of life and connection with the wider environment.
This section looks in more detail at the diverse factors that influence our air quality.
The most recent data show that, in relation to both particulate matter and gas pollutants, air quality is improving at many of the monitoring sites around Aotearoa. However, some sites show worsening quality, and even in many of the improving sites these pollutants are still at levels that are above (that is, worse than) WHO guidelines. More than that, for most air pollutants, no level may be safe, so while levels may be improving or within guidelines, reduced air quality can still impact people’s health.
Monitoring of air quality generally takes place in areas where we expect air pollution to be highest and where people are exposed. Typically, then, it focuses on urban areas, where the major sources of air pollutants tend to be concentrated and where we therefore expect the impacts on people to be highest. Our monitoring network covers a large proportion of the population but a relatively small part of our land area. While this approach captures data relevant to many people at risk from poor air quality, we generally do not have air quality data for rural or less-populated areas of the country. For more information on monitoring sites presented in this report, see appendix A.
This section presents an overview of the most recent air quality data from monitoring sites across the country.

Image: Regional councils and unitary authorities (data source)
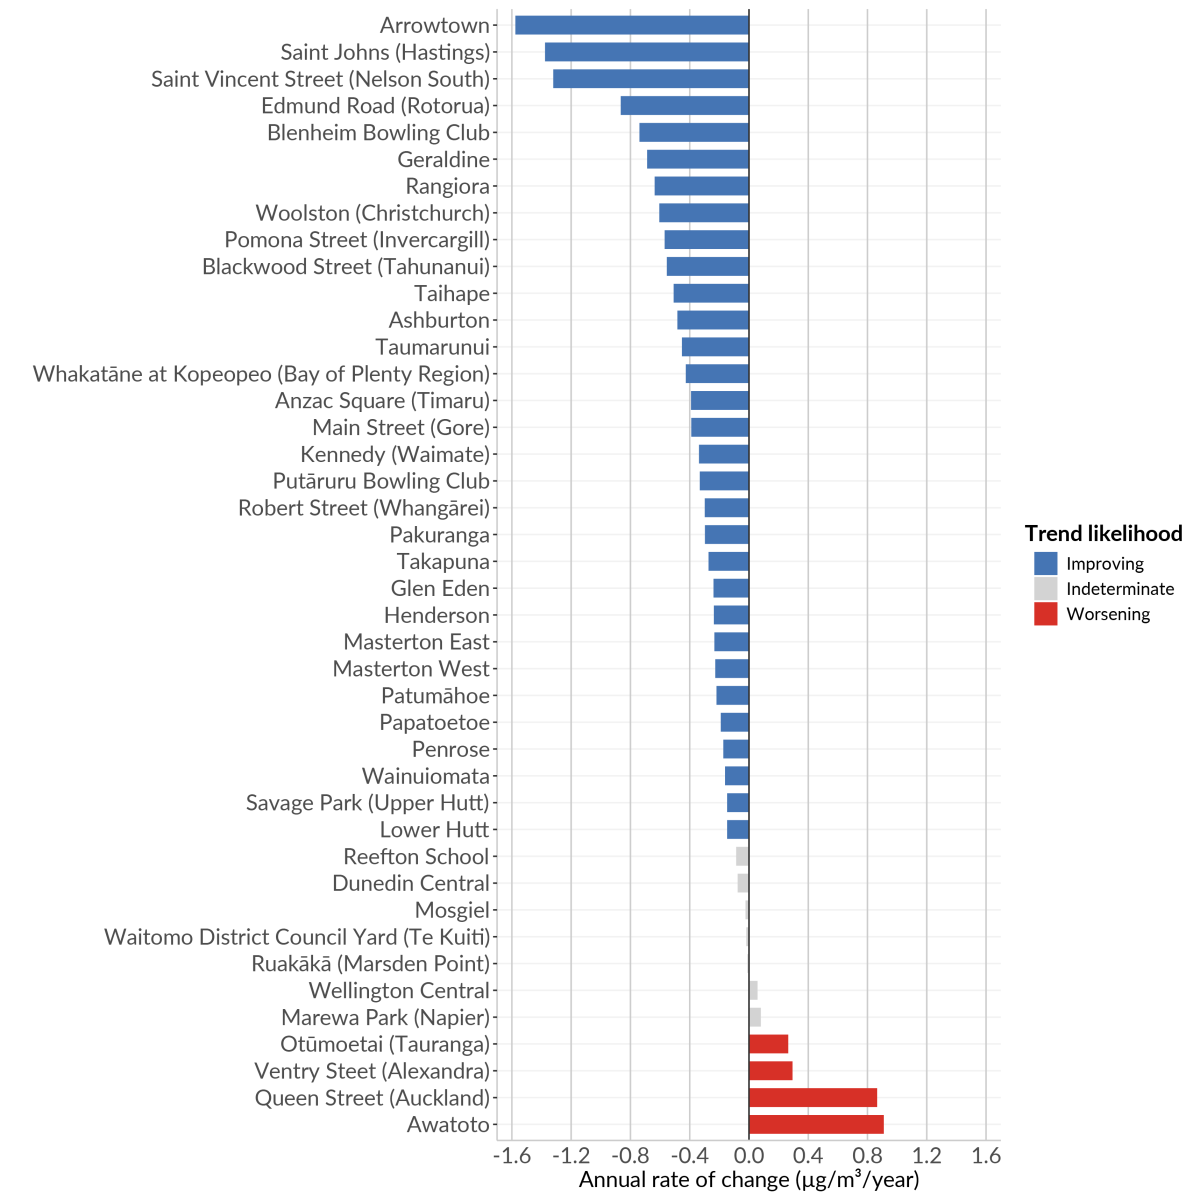
Image: Regional councils and unitary authorities (data source)
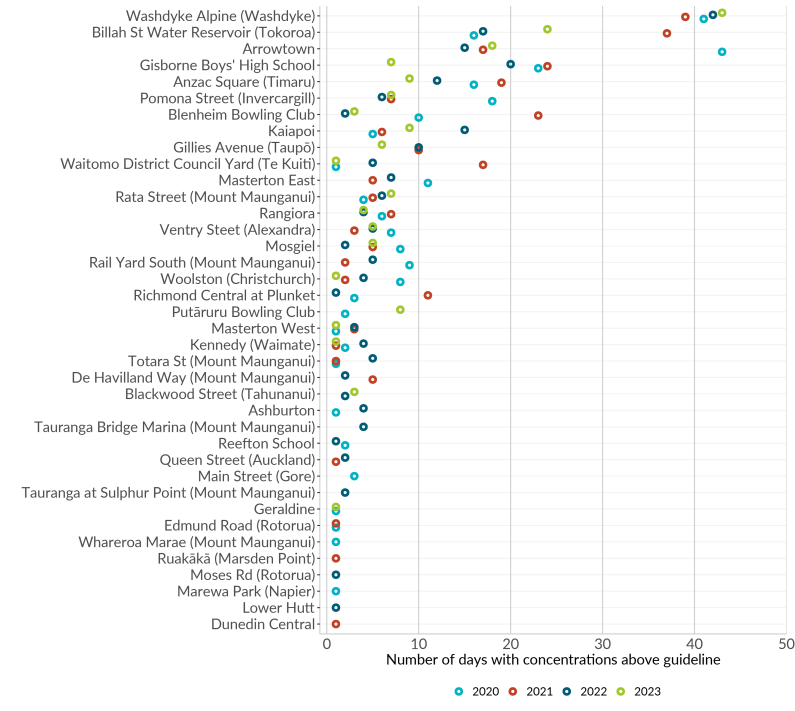
Image: Regional councils and unitary authorities (data source)
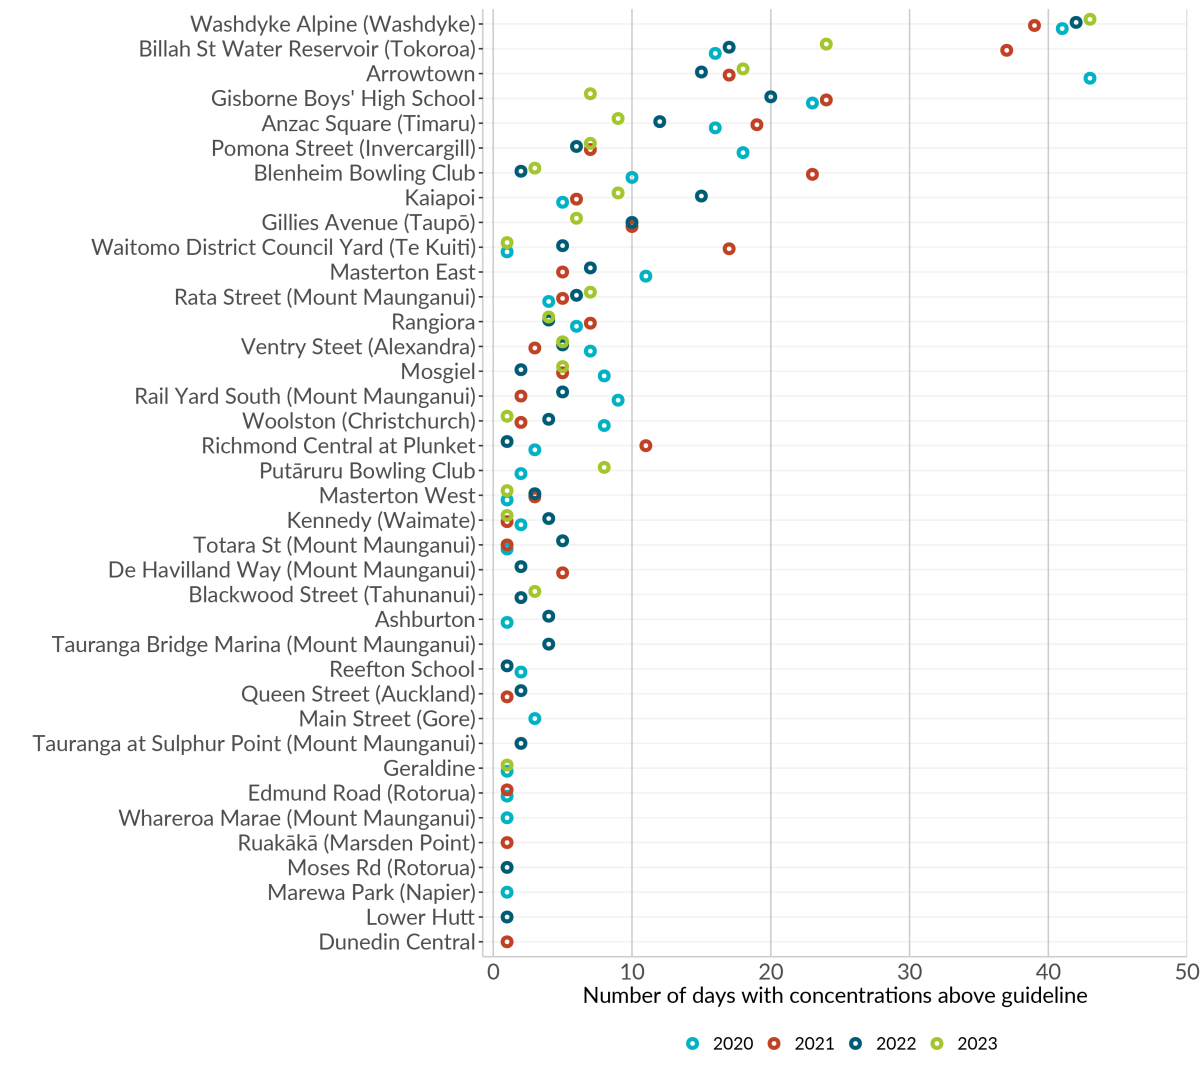
Image: Regional councils and unitary authorities (data source)

Image: Regional councils and unitary authorities (data source)
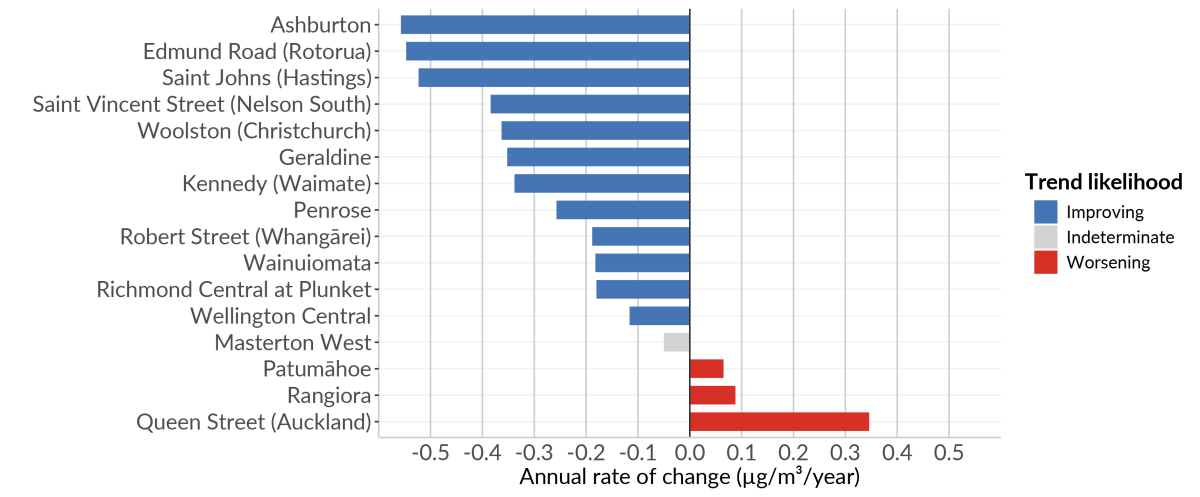
Image: Regional councils and unitary authorities (data source)
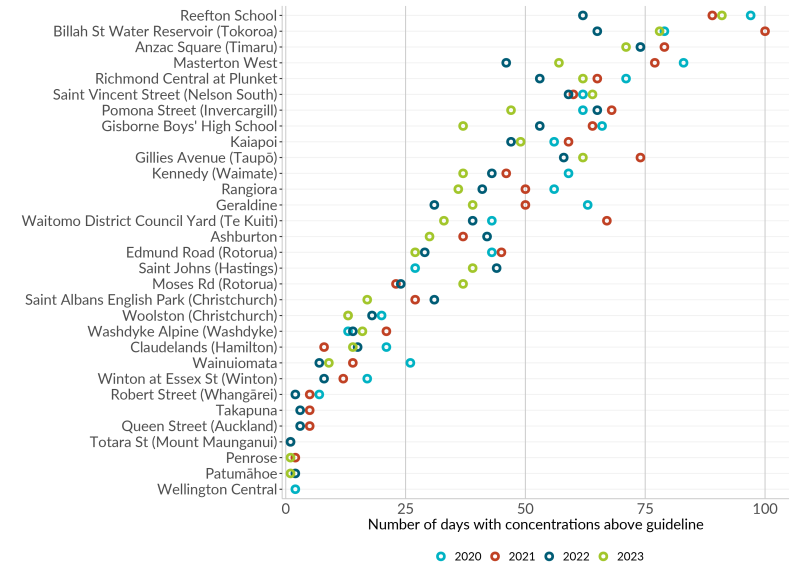
Image: Regional councils and unitary authorities (data source)

Image: Regional councils and unitary authorities (data source)

Image: Regional councils and unitary authorities (data source)
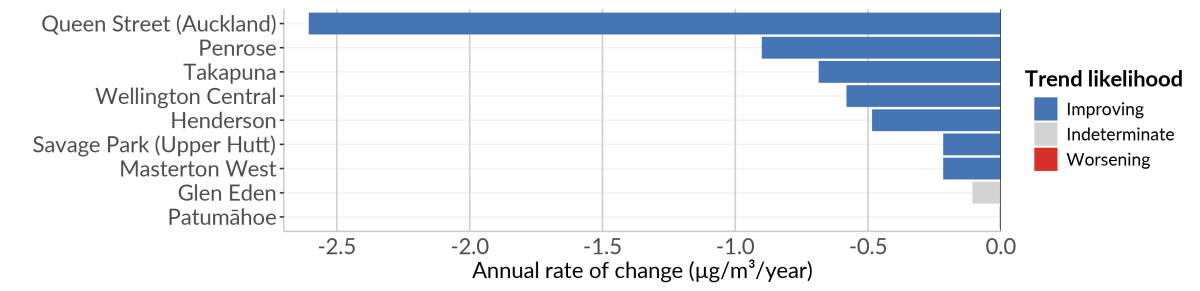
Image: Regional councils and unitary authorities (data source)
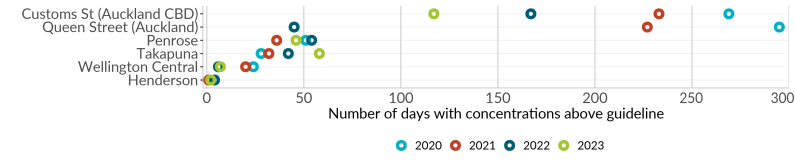
Image: Regional councils and unitary authorities (data source)
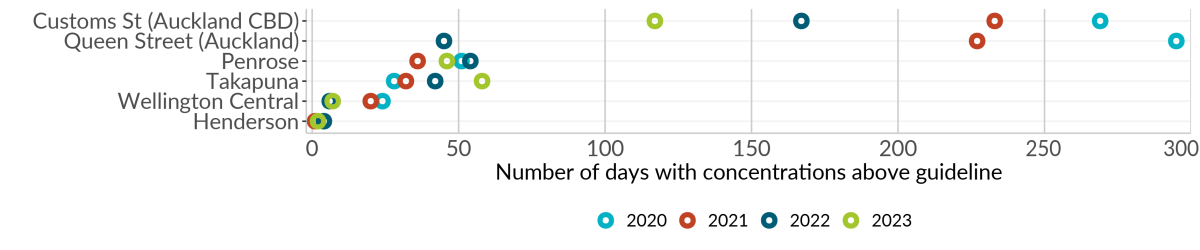
Image: Regional councils and unitary authorities (data source)
Air quality directly affects our health and our quality of life. Air pollution plays a part in the premature deaths of thousands of New Zealanders every year. It contributes to hospitalisations and other health impacts, and results in billions of dollars in social costs. Our improved understanding of both the health effects and associated costs has helped us establish that these health and economic impacts are higher than previously reported.
The impacts of air pollution are not spread evenly across the population. Some groups are more likely to be affected, including Māori, Pacific peoples, children, the elderly and those living in the most deprived areas.
Air pollution also impacts the wider environment, as the air is interconnected with the land, freshwater and marine environments. While evidence is limited in Aotearoa, air pollutants as well as light pollution can cause harm to species and ecosystems.
This section looks at the health, economic and cultural impacts of different types of air pollution, and the evidence around how it impacts the environment more broadly.
In this section, we provide an assessment of how we think the air quality of Aotearoa may change out to 2050. Assessments are not statements of fact, but rather use evidence from peer-reviewed literature, statistical data, input from experts and other credible sources to indicate what may happen based on our current pathway and what we know now. For more information on the probabilistic and analytical language we use in these assessments, see appendix B.
To support outlook assessments in this report, we make the following set of baseline assumptions about the future across a spectrum of issues.
Critical uncertainties remain, however. The direction of change is unclear in areas such as:
In addition, evidence is insufficient to estimate how air pollution might impact public health in future (see the Knowledge gaps section).
Volcanic eruptions can affect air quality over a large area but, given the unpredictable nature of volcanic activity, we cannot reflect it in our assessments of how air quality might change in future. The same is true for other rapid onset events such as the COVID-19 pandemic, where our response to the event can have a substantial effect on air quality.
Air pollution monitoring in Aotearoa focuses on a few pollutants in high-risk locations. While this approach gives us a good picture of the impacts on the most-affected populations, it results in significant gaps in our knowledge of the wider effects of air pollution on people and nature. We need our monitoring to reflect our emerging understanding of different types of pollutants and their impacts, and our projections need to take account of climate change and shifting demographics. Here we highlight five key knowledge gaps that became apparent when we were compiling this report.
We generally only monitor air pollutants in areas that we know are at risk of poor air quality and where people are exposed. As a result, we do not have a full national picture of air quality in Aotearoa, and we may not be aware of poor air quality that could exist in some areas. Rural areas generally do not have air quality monitoring, and many communities in these areas also have less access to healthcare.
Important ways to improve monitoring include expanding NO2 monitoring beyond main centres and continuing to expand the PM2.5 monitoring network alongside PM10 monitoring. Other means of expanding air quality monitoring beyond current monitoring stations can also be investigated, including the use of satellite data, artificial intelligence-enabled forecasting and citizen science initiatives.
Air quality monitoring in Aotearoa focuses on a few pollutants, which has given us a good understanding of their risks. This means that we lack a full understanding of air quality more generally, including localised and emerging pollutants, and what makes up our particulate matter. It is therefore likely that current and projected health impacts are underestimated. Improving our data and understanding in these areas can help with conducting risk assessments and quantifying associated costs. Important pollutants for which we have limited data include black carbon, airborne pollen, airborne microplastics, ultrafine particulate matter and persistent organic pollutants.
Two examples illustrate how such data can support our understanding of air pollution. First, black carbon is a type of particulate matter produced from combustion, and when monitored alongside other pollutants can provide data that help us to determine the sources of pollution. The WHO air quality guidelines recommend monitoring black carbon but currently this only occurs regularly in Aotearoa at three locations and we have no national monitoring standard.
Second, airborne pollen data for Aotearoa is fragmented and outdated. Given the prediction that the already significant health impacts of pollen in Aotearoa are predicted to increase with climate change, it is important to have comprehensive information on airborne pollen distribution.
Our understanding of the physical and biological mechanisms through which air pollution impacts human health is continually improving, but there remains more to learn. We have significant knowledge gaps around cumulative impacts and emerging pollutants, such as ultrafine particles, which are the subject of a growing area of research.
Projecting how air pollution might impact public health in future is important so that we can plan for and manage health impacts and associated social costs. A more strategic network for air quality monitoring could better support modelling and predictions of future air quality and associated health and economic impacts. Integrating air pollution data with climate change and extreme weather projections will strengthen our understanding of future air quality and health impacts. This knowledge can then help inform actions to address both air quality and climate change.
Our physical health is only one component of health. We lack data about how air quality is impacting cultural health, ways of life and traditional practices. Such gaps are particularly clear in relation to impacts on te ao Māori (Māori worldview). While some aspects of air quality disproportionately impact Māori, we have little documented evidence of impacts beyond physical health statistics. More generally, there is a lack of reporting on air quality issues from a Māori perspective.
Strengthening our understanding in this area requires enhancing our mātauranga Māori (Māori knowledge) evidence base and improving the resourcing of Māori research and access to ngā tohu o te taiao (environmental indicators) that draw from mātauranga Māori. In te ao Māori, te taiao (the environment) is seen as a whole rather than as separate parts. This perspective can be challenging for our national reporting system, which divides the environment into domains. But emphasising the connections between different parts of the environment helps build a richer understanding of the whole. For air, this could mean, for example, looking more closely at cumulative and legacy impacts of poor air quality on land and water, and how these impacts affect mahinga kai (traditional food gathering practices) and taonga (treasured) species and subsequently customary practices related to these species.
We have limited evidence of how air pollution is impacting the natural environment in Aotearoa. Non-populated locations are not monitored, so we lack understanding of the pollutants that our natural environment and many of our taonga species are being exposed to.
We can look to more well established and robust international studies to get an idea of impacts that could be happening in Aotearoa but are not documented. However, as we are a remote island nation with unique ecosystems, the shortage of specific evidence for Aotearoa makes it challenging to understand how our ecosystems might respond to air pollution and how sensitive they are to damage. For example, we do not monitor airborne nitrogen deposition in freshwater and terrestrial environments. We therefore have no information on the scale of this issue or how sensitive our taonga species and mahinga kai practices are to it.
Observed coarse particulate matter (PM10) concentrations are reported from 58 monitoring sites across Aotearoa. Daily exceedances, along with 24-hour and annual average PM10, are reported for state between 2020 and 2023. Annual average daily concentrations are also available. Annual trends are reported for 41 sites between 2016 and 2023.
Observed fine particulate matter (PM2.5) concentrations are reported from 31 monitoring sites across Aotearoa. Annual average and 24-hour PM2.5 are reported for state, as well as annual average daily concentrations, between 2020 and 2023. Annual trends are reported for 16 sites between 2016 and 2023.
Observed nitrogen dioxide (NO2) concentrations are reported from two data sources: 10 monitoring sites from regional councils and unitary authorities, and 114 monitoring sites from NZTA’s monitoring network. For the regional council and unitary authority monitoring network, state is monitored hourly at 10 sites, and is reported as 24-hour and annual averages against environmental standards between 2020 and 2023. Annual trends are reported for 9 sites between 2020 and 2023. For the NZTA network, annual trends are presented for 114 sites between 2014 and 2023.
Observed sulphur dioxide (SO2) concentrations are reported from 8 monitoring sites across Aotearoa. Hourly exceedances and 24-hour SO2 are reported against environmental standards between 2020 and 2023. Annual average daily concentrations are also reported. Annual trends are reported for 4 sites between 2016 and 2023.
Observed carbon monoxide (CO) concentrations are reported from 12 monitoring sites across the Auckland and Greater Wellington regions. State is reported at 4 sites between 2020 and 2023, and trends across 3 sites for the period between 2016 and 2023.
Observed ground-level ozone (O3) concentrations are reported from 2 monitoring sites: Patumāhoe and Wellington Central. State is monitored hourly, and reported as eight-hour averages against environmental standards between 2020 and 2023. Eight-year trends from 2016 to 2023 are reported.
For sites where trends could be determined, trends are classified as determinate when the probability of an increasing or decreasing trend is above 95 percent. The term ‘indeterminate’ is used when there is not enough statistical certainty to determine trend direction (less than 95 percent certainty). Trends were only analysed for sites where both sampling location and instrumentation were consistent for the considered period. For more information, see the indicators.
Evidence supported by the Indicator: Human health impacts of PM2.5 and NO2 has been updated with information from the latest Health and Air Pollution in New Zealand (HAPINZ) release, with data up to 2019 (Metcalfe & Kuschel, 2023) (see table 2).
Table 2: Estimated human health impacts per year from PM2.5 and NO2 air pollution in 2016 and 2019
| | 2016 (See Indicator: Human health impacts of PM2.5 and NO2) | 2019 (Metcalfe & Kuschel, 2023) |
|---|---|---|
| Cases due to PM2.5 | ||
| Premature deaths (30+ years) | 1,292 | 1,275 |
| Cardiovascular hospitalisations (all ages) | 2,639 | 2,746 |
| Respiratory hospitalisations (all ages) | 1,985 | 2,041 |
| Restricted activity days (all ages) | 1,745,354 | 1,771,197 |
| Cases due to NO2 | ||
| Premature deaths (all adults) | 2,025 | 1,964 |
| Cardiovascular hospitalisations (all ages) | 1,987 | 2,010 |
| Respiratory hospitalisations (all ages) | 6,544 | 6,440 |
| Asthma prevalence (0–18 years) | 13,229 | 12,653 |
Metcalfe and Kuschel (2023) also estimated the social costs from PM2.5 and NO2 as $15,613 million in 2016 and $15,267 million in 2019.
Evidence previously supported by the Indicator: Artificial night sky brightness has been updated with information from peer-reviewed literature, using data up to 2021 (Cieraad & Farnworth, 2023).
Expressions of likelihood are underlined in each outlook assessment. Expressions of confidence are presented in italics in brackets at the end of each assessment.
| Probabilistic language | Associated numeric probability |
|---|---|
| Almost certain | >90% |
| Highly likely / Very probable | 75–85% |
| Probable / Likely | 55–70% |
| Realistic possibility | 25–50% |
| Improbable / Unlikely | 15–20% |
| Remote / Highly unlikely | <10% |
High confidence
Assessments are based on high-quality information, and/or the nature of the issue makes it possible to give a solid judgement. A ‘high confidence’ judgement is not a fact, however, and still carries a risk of being incorrect.
Moderate confidence
Assessments are based on credibly sourced and plausible information, but are not of sufficient quality or are not sufficiently corroborated to warrant a higher level of confidence.
Low confidence
Assessments are based on questionable or implausible information, the information is too fragmented or too poorly corroborated to make solid analytic inferences, or significant concerns or problems with sources exist.
Outlook assessments contained in this report should not be read as statements of fact and may be based on a variety of sources that differ in their reliability. Certain words in this report are used to convey the probability of analytical assessments. These words are underlined to clearly identify assessments. The probability terms are used in conjunction with expressions of confidence, which indicate the reliability and level of corroboration of sources used in an assessment. The language and probability ranges are the same as those other government agencies use, to maintain consistency and support effective cross-agency decision-making.
Listed below are the environmental indicators incorporated in this report, including seven indicators updated since the last release in bold:
This report was compiled by the Ministry for the Environment and Stats NZ’s Environmental Reporting team.
We would like to thank the following for providing data and advice in the development of indicators used in this report:
We would like to thank the following people and organisations for providing advice and helping to shape this report:
We would like to thank the following people and organisations for providing advice and critical review of this report:
The summary of key findings infographic was created by Studio C.
Aguilera R, Corringham T, Gershunov A, Leibel S, & Benmarhnia T. (2021). Fine particles in wildfire smoke and pediatric respiratory health in California. Pediatrics, 147(4). https://doi.org/10.1542/peds.2020-027128
Akdemir EA, Battye WH, Myers CB, & Aneja, VP. (2022). Estimating NH3 and PM2.5 emissions from the Australia mega wildfires and the impact of plume transport on air quality in Australia and New Zealand. Environmental Science: Atmospheres, 2(4), 634–646. https://doi.org/10.1039/d1ea00100k
Asthma Foundation NZ. (2021). What is thunderstorm asthma? https://www.asthmafoundation.org.nz/stories/what-is-thunderstorm-asthma
Auckland Council. (2022). Auckland Air Quality: 2021 Annual Data Report. https://www.knowledgeauckland.org.nz/publications/auckland-air-quality-2021-annual-data-report/
Auckland Council. (2023). Auckland Air Quality: 2022 Annual Data Report. https://www.knowledgeauckland.org.nz/publications/auckland-air-quality-2022-annual-data-report/
Aves A, Ruffell H, Evangeliou N, Gaw S, & Revell LE. (2024). Modelled sources of airborne microplastics collected at a remote Southern Hemisphere site. Atmospheric Environment, 325. https://doi.org/10.1016/j.atmosenv.2024.120437
Barton M, Henderson I, Border J, & Siriwardena G. (2023). A review of the impacts of air pollution on terrestrial birds. Science of Total Environment, 873. https://www.sciencedirect.com/science/article/abs/pii/S0048969723007520
Bay of Plenty Regional Council. (2010). Rotorua Air Quality Action Plan. https://www.boprc.govt.nz/media/523549/rotorua-air-quality-action-plan-booklet-may-2010-read-only.pdf
Bay of Plenty Regional Council. (nd). Mount Maunganui industrial air quality. https://www.boprc.govt.nz/environment/air/mt-maunganui-air-project/
Boamponsem LK, Hopke PK, & Davy PK. (2024). Long-term trends and source apportionment of fine particulate matter (PM2.5) and gaseous pollutants in Auckland, New Zealand. Atmospheric Environment, 322. https://doi.org/10.1016/j.atmosenv.2024.120392
Bodeker G, Cullen N, Katurji M, McDonald A, Morgenstern O, Noone D, Renwick J, Revell L, & Tait A. (2022). Aotearoa New Zealand Climate Change Projections Guidance: Interpreting the Latest IPCC WG1 Report Findings. https://environment.govt.nz/publications/aotearoa-new-zealand-climate-change-projections-guidance/
Bokowa A, Diaz C, Koziel JA, McGinley M, Barclay J, Schauberger G, Guillot JM, Sneath R, Capelli L, Zorich V, Izquierdo C, Bilsen I, Romain AC, del Carmen Cabeza M, Liu D, Both R, van Belois H, Higuchi T, & Wahe L. (2021). Summary and overview of the odour regulations worldwide. Atmosphere, 12(206). https://doi.org/10.3390/atmos12020206
Bolton A. (2018). Climate Change and Environmental Health. https://www.researchgate.net/publication/325263289
Booth K. (2022). Wilderness and Remoteness Values of Fiordland Waters. https://www.es.govt.nz/repository/libraries/id:26gi9ayo517q9stt81sd/hierarchy/about-us/plans-and-strategies/regional-plans/coastal-plan/documents/PC5%20initial%20notification/Report%20Wilderness%20and%20remoteness
%20values%20of%20Fiordland%2C%20Lindus%20Consulting%20-%20Final%2022%20Feb%202020.pdf
Bożejko M, Tarski I, & Małodobra-Mazur M. (2023). Outdoor artificial light at night and human health: A review of epidemiological studies. Environmental Research, 218. https://doi.org/10.1016/j.envres.2022.115049
BRANZ. (2017). Project: Indoor Air Quality in New Zealand Homes and Garages. https://d39d3mj7qio96p.cloudfront.net/media/documents/BRANZ-RN-Indoor_Air_Quality_4.pdf
Brody-Heine S, Katurji M, Stewart C, Wilson T, Smid ER, & Trancoso R. (2024). Modeling SO2 dispersion from future eruptions in the Auckland Volcanic Field, New Zealand. Journal of Applied Volcanology, 13(1). https://doi.org/10.1186/s13617-024-00141-0
Cheriyan D, & Choi J-H. (2020). A review of research on particulate matter pollution in the construction industry. Journal of Cleaner Production, 254. https://doi.org/10.1016/j.jclepro.2020.120077
Cieraad E, & Farnworth B. (2023). Lighting trends reveal state of the dark sky cloak: Light at night and its ecological impacts in Aotearoa New Zealand. New Zealand Journal of Ecology, 47(1). https://doi.org/10.20417/nzjecol.47.3559
Coates J, Mar KA, Ojha N, & Butler TM. (2016). The influence of temperature on ozone production under varying NOx conditions: A modelling study. Atmospheric Chemistry and Physics, 16(18), 11601–11615. https://doi.org/10.5194/acp-16-11601-2016
Commerce Commission. (2023). Electricity lines and transmission charges: What are they, why are they changing and what does this mean for your electricity bill? https://comcom.govt.nz/regulated-industries/electricity-lines/electricity-lines-and-transmission-charges-what-are-they,-why-are-they-changing-and-what-does-this-mean-for-your-electricity-bill
Coulson G, Bian R, & Somervell E. (2015). An investigation of the variability of particulate emissions from woodstoves in New Zealand. Aerosol and Air Quality Research, 15(6), 2346–2356. https://doi.org/10.4209/aaqr.2015.02.0111
Dale ER, Kremser S, Tradowsky JS, Bodeker GE, Bird LJ, Olivares G, Coulson G, Somervell E, Pattinson W, Barte J, Schmidt JN, Abrahim N, McDonald AJ, & Kuma P. (2021). The winter 2019 air pollution (PM2.5) measurement campaign in Christchurch, New Zealand. Earth System Science Data, 13(5), 2053–2075. https://doi.org/10.5194/essd-13-2053-2021
D’Amato G, Annesi-Maesano I, Urrutia-Pereira M, Del Giacco S, Rosario Filho NA, Chong-Neto HJ, Solé D, Ansotegui I, Cecchi L, Sanduzzi Zamparelli A, Tedeschini E, Biagioni B, Murrieta-Aguttes M, & D’Amato M. (2021). Thunderstorm allergy and asthma: State of the art. Multidisciplinary Respiratory Medicine, 16(1), 806. https://www.ncbi.nlm.nih.gov/pmc/articles/PMC8672486/pdf/mrm-16-1-806.pdf
Damialis A, Smith M, & Galán C. (2021). Editorial: Climate change and aeroallergens. Frontiers in Allergy 2, 794430. https://doi.org/10.3389/falgy.2021.794430
DarkSky International. (2023). All international dark sky places. https://darksky.org/what-we-do/international-dark-sky-places/all-places/?_location_dropdown=new-zealand
Davy P & Trompetter W. (2021). The rise of non-tailpipe motor vehicle emissions in a Southern Hemisphere city. Air Quality and Climate Change, 55(1), 44–45.
Davy PK, & Trompetter WJ. (2022). A tale of two sources (as seen in New Zealand). Air Quality and Climate Change, 56(2), 29.
Davy PK, Trompetter WJ, Ancelet, T, & Markwitz A. (2017). Source Apportionment and Trend Analysis of Air Particulate Matter in the Auckland Region. https://knowledgeauckland.org.nz/media/1126/tr2017-001-source-apportionment-trend-analysis-air-particulate-auckland-gns-july-2017.pdf
Davy PK, Trompetter WJ, Revell LE, & Hardacre C. (2024). Evaluation of New Zealand’s Background Particulate Matter Sources. GNS Science Consultancy Report 2024/53. GNS CR 2024/53. https://environment.govt.nz/assets/publications/Environmental-Reporting/Evaluation-of-New-Zealands-background-particulate-matter-sources.pdf
Deshpande AG, Jones MR, van Dijk N, Mullinger NJ, Harvey D, Nicoll R, Toteva G, Weerakoon G, Nissanka S, Weerakoon B, Grenier M, Iwanicka A, Duarte F, Stephens A, Ellis CJ, Vieno M, Drewer J, Wolseley PA, Nanayakkar S, … Sutton MA. (2024). Estimation of ammonia deposition to forest ecosystems in Scotland and Sri Lanka using wind-controlled NH3 enhancement experiments. Atmospheric Environment, 320. https://doi.org/10.1016/j.atmosenv.2023.120325
Dowdy AJ, Ye H, Pepler A, Thatcher M, Osbrough SL, Evans JP, di Virgilio G, & McCarthy N. (2019). Future changes in extreme weather and pyroconvection risk factors for Australian wildfires. Scientific Reports, 9(1). https://doi.org/10.1038/s41598-019-46362-x
EECA (Energy Efficiency and Conservation Authority). (2023). 2023 Heat pump sales and efficiency data [Dataset]. https://www.eeca.govt.nz/insights/eeca-insights/e3-programme-sales-and-efficiency-data/
EHINZ (Environmental Health Intelligence New Zealand). (2015). Proportion of Households Using Wood and Coal fires as a Source of Home Heating. EHI issue 13 & 14, Jan 2015. https://ehinz.ac.nz/assets/Factsheets/Released-2015/EHI13-14-ProportionOfHouseholdsUsingWoodAndCoalasASourceOfHomeHeating1996-2013-released201501.pdf
EHINZ (Environmental Health Intelligence New Zealand). (2020). Main types of heating used to heat dwellings. https://www.ehinz.ac.nz/assets/Factsheets/Released_2020/19446-Types-of-Heating-FA2_.pdf
EHINZ (Environmental Health Intelligence New Zealand). (2021). Average age of motor vehicles. https://ehinz.ac.nz/assets/Factsheets/Released_2021/Average-age-of-motor-vehicles.pdf
EHINZ (Environmental Health Intelligence New Zealand). (2023). Number of motor vehicles. https://www.ehinz.ac.nz/assets/Factsheets/Released_2023/2023_FS_NumberOfVehicles.pdf
EHINZ (Environmental Health Intelligence New Zealand). (nd). About air quality and health. https://ehinz.ac.nz/indicators/air-quality/air-qual/
Environment Canterbury & Christchurch City Council. (2020). Bromley Community Offensive and Objectionable Odour Survey. https://ccc.govt.nz/assets/Documents/Environment/Land/Bromley-odour/Bromley-Community-Odour-Report.pdf
EPA (United States Environmental Protection Agency). (2024). Ground-level ozone basics. https://www.epa.gov/ground-level-ozone-pollution/ground-level-ozone-basics
ESR (Institute of Environmental Science and Research). (2023). Air Pollution: Health Risk Assessment Mount Maunganui. https://www.esr.cri.nz/digital-library/environmental-health-report-air-pollution-health-risk-assessment-mount-maunganui/
EVDB (Electric Vehicle Database). (2024). EV Market Stats 2024. https://evdb.nz/ev-stats
Falcón J, Torriglia A, Attia D, Viénot F, Gronfier C, Behar-Cohen F, Martinsons C, & Hicks D. (2020). Exposure to artificial light at night and the consequences for flora, fauna, and ecosystems. Frontiers in Neuroscience, 14. https://doi.org/10.3389/fnins.2020.602796
Fan W, Salmond JA, Dirks KN, Cabedo Sanz P, Miskelly GM, & Rindelaub JD. (2022). Evidence and mass quantification of atmospheric microplastics in a coastal New Zealand city. Environmental Science and Technology, 56(24), 17556–17568. https://doi.org/10.1021/acs.est.2c05850
Fiddes SL, Pezza AB, Mitchell TA, Kozyniak K, & Mills D. (2016). Synoptic weather evolution and climate drivers associated with winter air pollution in New Zealand. Atmospheric Pollution Research, 7(6), 1082–1089. https://doi.org/10.1016/j.apr.2016.06.014
Gauss M, Bartnicki J, Jalkanen JP, Nyiri A, Klein H, Fagerli H, & Klimont Z. (2021). Airborne nitrogen deposition to the Baltic Sea: Past trends, source allocation and future projections. Atmospheric Environment, 253. https://doi.org/10.1016/j.atmosenv.2021.118377
Genesis Energy. (2022). How heat pumps can tackle climate change. https://www.genesisenergy.co.nz/about/sustainability/climate-change-hub/yourself/how-heat-pumps-can-tackle-climate-change
Hales S, Atkinson J, Metcalfe J, Kuschel G, & Woodward A. (2021). Long term exposure to air pollution, mortality and morbidity in New Zealand: Cohort study. Science of the Total Environment, 801, 149660. https://doi.org/10.1016/j.scitotenv.2021.149660
Hawke’s Bay Regional Council. (nd). Dust and odours. https://www.hbrc.govt.nz/environment/air-quality/dust-and-odours/
Hikuroa D. (2017). Mātauranga Māori – the ūkaipō of knowledge in New Zealand. Journal of the Royal Society of New Zealand, 47(1), 5–10. https://doi.org/10.1080/03036758.2016.1252407
Hughes J, Cowper-Heays K, Olesson E, Bell R, & Stroombergen A. (2021). Impacts and implications of climate change on wastewater systems: A New Zealand perspective. Climate Risk Management, 31. https://doi.org/10.1016/j.crm.2020.100262
Kim JB, Prunicki M, Haddad F, Dant C, Sampath V, Patel R, Smith E, Akdis C, Balmes J, Snyder MP, Wu JC, & Nadeau KC. (2020). Cumulative lifetime burden of cardiovascular disease from early exposure to air pollution. Journal of the American Heart Association, 9(6). https://doi.org/10.1161/JAHA.119.014944
Krzyzanowski M. (2023). The Health Impacts of Nitrogen Dioxide (NO2) Pollution. https://www.env-health.org/wp-content/uploads/2023/06/NO2_briefing_EN.pdf
Kunak. (2023). Air pollution from construction sites, analysing the environmental impact of construction. https://kunakair.com/air-pollution-from-construction-sites/
Kuschel G. (2022). Public Health Risks Associated with Transport Emissions in NZ: Part 1 Stocktake and Gap Analysis as at 30 June 2021. https://www.esr.cri.nz/media/ws5aohdm/transport-emissions-risk-assessment-esr-march-2022.pdf
Kuschel G, Metcalfe J, Sridhar S, Davy P, Hastings K, Denne T, Woodward A, Hales S, Atkinson J, Berentson-Shaw J, & Bell S. (2022). Health and air pollution in New Zealand 2016 (HAPINZ 3.0): Volume 1: Findings and Implications. https://environment.govt.nz/assets/publications/HAPINZ/HAPINZ-3.0-Findings-and-implications.pdf
Kyba CCM, Altıntas YÖ, Walker CE, & Newhouse M. (2023). Citizen scientists report global rapid reductions in the visibility of stars from 2011 to 2022. Science, 379, 265–268. https://doi.org/10.1126/science.abq7781
Langer L, Wegner S, & Pearce G. (2021). Preparing Homeowners and Communities in the Rural-Urban Interface for Increasing Wildfire Risk. https://www.ruralfireresearch.co.nz/__data/assets/pdf_file/0004/78664/RFR_tech_note_45.pdf
Langer L, Wegner S, & Grant A. (2022). Risk perception and preparedness in a high-wildfire risk community: Case study of Northern Wānaka/Albert Town, Otago. In Scion Fire Technology Transfer Note (Vol. 46). https://resiliencechallenge.nz/outputs/risk-perception-and-preparedness-in-a-high-wildfire-risk-community-case-study-of-northern-wanaka-albert-town-otago/
LAWA (Land Air Water Aotearoa). (2021). Factsheet: Air pollutants – gases. https://www.lawa.org.nz/learn/factsheets/air-quality-topic/air-pollutants-gases/
LAWA (Land Air Water Aotearoa). (2023). Factsheet: Air pollutants – particulate matter. https://www.lawa.org.nz/learn/factsheets/air-quality-topic/air-pollutants-particulate-matter/
LAWA (Land Air Water Aotearoa). (nd). Industrial sources of air pollution. https://www.lawa.org.nz/learn/glossary/i/industrial-sources-of-air-pollution
Lawrence A, Rawls ML, Jah M, Boley A, di Vruno F, Garrington S, Kramer M, Lawler S, Lowenthal J, McDowell J, & McCaughrean M. (2022). The case for space environmentalism. Nature Astronomy, 6(4), 428–435. https://doi.org/10.1038/s41550-022-01655-6
Liang X, Zhang T, Lu X, Ellsworth DS, BassiriRad H, You C, Wang D, He P, Deng Q, Liu H, Mo J, & Ye Q. (2020). Global response patterns of plant photosynthesis to nitrogen addition: A meta-analysis. Global Change Biology, 26(6), 3585–3600. https://doi.org/10.1111/gcb.15071
Longley I. (2020). Investigating Indoor Air Quality in Arrowtown using Hau-Haus (2019). https://niwa.co.nz/sites/default/files/CONA%20Arrowtown%202019
%20report%202_Indoor%20Air%20Quality.pdf
Longley I, Salmond J, Dirks K, Welch D, Shepherd D, Grange S, Olivares G, & Miskell G. (2014). Personal Exposure to Noise and Air Pollution (PENAP) in the Queen Street Valley, Auckland. https://knowledgeauckland.org.nz/media/1572/tr2014-036-personal-exposure-to-noise-and-air-pollution-penap-in-the-queen-street-valley-auckland.pdf
Matamua R. (2017). Matariki: The Star of the Year. Huia Publishers.
McDonald VM, Archbold G, Beyene T, Brew BK, Franklin P, Gibson PG, Harrington J, Hansbro P, Johnston FH, Robinson PD, Sutherland M, Yates D, Zosky GR, & Abramson MJ (2023). Asthma and landscape fire smoke: A Thoracic Society of Australia and New Zealand position statement. Respirology, 28(11), 1023–1035.
McNaughton EJ, Gaston KJ, Beggs J, Jones DN, & Stanley MC. (2022). Areas of ecological importance are exposed to risk from urban sky glow: Auckland, Aotearoa-New Zealand as a case study. Urban Ecosystems, 25(1). https://doi.org/10.1007/s11252-021-01149-9
Meeuwen-Dijkgraaf A. (2021). Effects of Artificial Light on Urban Wildlife within the Lower Hutt District Photobiology Assessment Document History. https://www.huttcity.govt.nz/council/district-plan/district-plan-review/other-topics
Metcalfe J, & Kuschel G. (2022). Estimating the Impacts of Introducing Euro 6/VI Vehicle Emission Standards for New Zealand: Final Report. https://www.transport.govt.nz/assets/MoT-Euro-6-modelling-final-report-4-July.pdf
Metcalfe J, & Kuschel G. (2023). Public Health Risks associated with Transport Emissions in NZ: Part 2 Road Transport Emission Trends. https://sacnzs.org.nz/assets/1Reports/Environmental-reports/ESR-environmental-health-report-public-health-risks-transport-emissions.pdf
Metcalfe J, Powell J, & Wickham L. (2022). Public Health Risks Associated with Discharges to Air from Agriculture in New Zealand: Scoping Review. https://testsite1.esr.cri.nz/assets/1Reports/Environmental-reports/ESR-environmental-health-report-agriculture-air-dishcharges.pdf
Metcalfe J, Wickham L, & Sridhar S. (2018). Auckland Air Emissions Inventory 2016: Home Heating. https://knowledgeauckland.org.nz/media/1091/tr2018-018-auckland-air-emissions-inventory-2016-home-heating.pdf
MfE (Ministry for the Environment). (2016). Good Practice Guide for Assessing and Managing Dust. https://environment.govt.nz/assets/Publications/Files/good-practice-guide-dust-2016.pdf
MfE (Ministry for the Environment). (2020). Proposed Amendments to the National Environmental Standards for Air Quality: Particulate Matter and Mercury Emissions. https://environment.govt.nz/assets/Publications/Files/proposed-amendments-to-the-national-environmental-standards-for-air-quality-consultation-document_0.pdf
MOT (Ministry of Transport). (2017). Transport Outlook Future State: A Starting Discussion on the Future of Transport in New Zealand. https://www.transport.govt.nz/assets/Uploads/Report/TransportOutlookFutureState.pdf
MOT (Ministry of Transport). (2019). Transport Outlook: Future state model results (VKT and Vehicle Numbers Model Version 3 base 20220419). https://www.transport.govt.nz/statistics-and-insights/transport-outlook/sheet/updated-future-state-model-results
MOT (Ministry of Transport). (2020). Green freight project | Te kaupapa tiaki taiao mō ngā utanga. https://www.transport.govt.nz/area-of-interest/freight-and-logistics/green-freight
MOT (Ministry of Transport). (2022). Te Tatauranga Rāngi Waka a Tau 2021 | Annual Fleet Statistics 2021 Report of Te Manatū Waka Ministry of Transport. https://www.transport.govt.nz/assets/Uploads/Report/AnnualFleetStatistics.pdf
MOT (Ministry of Transport). (nd-a). Annual fleet statistics. https://www.transport.govt.nz/statistics-and-insights/fleet-statistics/annual-fleet-statistics/
MOT (Ministry of Transport). (nd-b). MARPOL Annex VI Treaty. https://www.transport.govt.nz/area-of-interest/maritime-transport/marpol
Munir S, Luo Z, Dixon T, Manla G, Francis D, Chen H, & Liu Y. (2022). The impact of smart traffic interventions on roadside air quality employing machine learning approaches. Transportation Research Part D: Transport and Environment, 110(103408). https://doi.org/10.1016/j.trd.2022.103408
Newnham RM. (2017). High levels of allergenic tree pollen in southern New Zealand. Biomedical Journal of Scientific & Technical Research, 1(4). https://doi.org/10.26717/bjstr.2017.01.000376
Newnham RM. (2021). Monitoring airborne pollen in New Zealand. Journal of the Royal Society of New Zealand, 52(2), 192–211. https://doi.org/10.1080/03036758.2021.1967414
NIWA (National Institute of Water and Atmospheric Research). (2021). Air Quality in Picton. https://www.marlborough.govt.nz/repository/libraries/id:1w1mps0ir17q9sgxanf9/hierarchy/Documents/
Your%20Council/Meetings/2021/Environment%202021%20list/Item_7
_-_07102021_-_Picton_Air_Quality_2019-2020_Report_NIWA_August_2021.pdf
NIWA (National Institute of Water and Atmospheric Research). (nd). Climate change will cause more deaths from air pollution, study finds. https://niwa.co.nz/news/climate-change-will-cause-more-deaths-air-pollution-study-finds
NZTA (New Zealand Transport Agency | Waka Kotahi). (2022). VKT Reduction Evidence Package. https://www.nzta.govt.nz/assets/planning-and-investment/nltp/vkt-reduction-evidence-package-may-2022.pdf
NZTA (New Zealand Transport Agency | Waka Kotahi). (2023). Ambient Air Quality (Nitrogen Dioxide) Monitoring Programme: Annual Report 2007–2022. https://www.nzta.govt.nz/assets/resources/air-quality-monitoring/docs/ambient-air-quality-monitoring-programme-annual-report-2007-2022.pdf
NZTA (New Zealand Transport Agency | Waka Kotahi). (2024). Monetised Benefits and Costs Manual. https://www.nzta.govt.nz/assets/resources/monetised-benefits-and-costs-manual/Monetised-benefits-and-costs-manual.pdf
OECD (Organisation for Economic Co-operation and Development). (2012). OECD environmental outlook to 2050: The consequences of inaction. In OECD Environmental Outlook to 2050: The Consequences of Inaction (p 286). https://doi.org/10.1787/9789264122246-en
One Picture. (2023). Intentions to Travel to New Zealand – active considerer (ac) deep dives. https://www.tourismnewzealand.com/assets/insights/intl-research/Intention-to-travel/TNZ-AC-Deep-Dives-Pres-v9-for-external-sharing.pdf
Orellano P, Reynoso J, & Quaranta N. (2021). Short-term exposure to sulphur dioxide (SO2) and all-cause and respiratory mortality: A systematic review and meta-analysis. Environment International, 150. https://doi.org/10.1016/j.envint.2021.106434
Otago Regional Council. (2023). Regional Plan: Air for Otago. https://www.orc.govt.nz/media/15298/regional-plan-air-for-otago-30-september-2023.pdf
Parfitt RL, Schipper LA, Baisden WT, & Elliott AH. (2006). Nitrogen inputs and outputs for New Zealand in 2001 at national and regional scales. Biogeochemistry, 80(1), 71–88. https://doi.org/10.1007/s10533-006-0002-y
Parfitt RL, Stevenson BA, Dymond JR, Schipper LA, Baisden WT, & Ballantine DJ. (2012). Nitrogen inputs and outputs for New Zealand from 1990 to 2010 at national and regional scales. New Zealand Journal of Agricultural Research, 55(3), 241–262. https://doi.org/10.1080/00288233.2012.676991
Patterson B. (2023). Economic Impacts of a Proposed Waimakariri Dark Sky Reserve Centred on Oxford. https://www.benjepatterson.co.nz/wp-content/uploads/2023/12/Economic-impacts-of-a-proposed-Waimakariri-dark-sky-reserve-centred-on-Oxford_FINAL.pdf
PCE (Parliamentary Commissioner for the Environment). (2019). Focusing Aotearoa New Zealand’s Environmental Reporting System. https://pce.parliament.nz/publications/focusing-aotearoa-new-zealand-s-environmental-reporting-system/
PCE (Parliamentary Commissioner for the Environment). (2023). Are We Building Harder, Hotter Cities? https://pce.parliament.nz/media/tetah53z/report-are-we-building-harder-hotter-cities-the-vital-importance-of-urban-green-spaces.pdf
Peled R. (2011). Air pollution exposure: Who is at high risk? Atmospheric Environment, 45(10), 1781–1785. https://doi.org/10.1016/j.atmosenv.2011.01.001
Piccardo MT, Geretto M, Pulliero A, & Izzotti A. (2022). Odor emissions: A public health concern for health risk perception. Environmental Research, 204. https://doi.org/10.1016/j.envres.2021.112121
Revell LE, Edkins NJ, Venugopal AU, Bhatti YA, Kozyniak KM, Davy PK, Kuschel G, Somervell E, Hardacre C, & Coulson G. (2024). Marine aerosol in Aotearoa New Zealand: Implications for air quality, climate change and public health. Journal of the Royal Society of New Zealand, 1–23. https://doi.org/10.1080/03036758.2024.2319753
RNZ (Radio New Zealand). (2024). Pollen, asthma and allergies. https://www.rnz.co.nz/national/programmes/ourchangingworld/audio/2018923999/pollen-asthma-and-allergies
Sabih A, Russell C, & Chang CL. (2020). Thunderstorm‐related asthma can occur in New Zealand. Respirology Case Reports, 8(7). https://doi.org/10.1002/rcr2.655
Sanderfoot OV, & Holloway T. (2017). Air pollution impacts on avian species via inhalation exposure and associated outcomes. Environmental Research Letters, 12(8). https://doi.org/10.1088/1748-9326/aa8051
Schofield, J. (2021). Effects of LED light on adult caddisflies at two rivers in Canterbury, New Zealand [Master’s thesis, University of Canterbury]. http://dx.doi.org/10.26021/11154
Semadeni-Davies A, Coulson G, Gadd J, Somervell E, Longely I, & Olivares G. (2021). Determining the Ecological and Air Quality Impacts of Particulate Matter from Brake and Tyre Wear and Road Surface Dust: Stage 1 – Literature review and recommendations for developing new emission factors for New Zealand. New Zealand Transport Agency | Waka Kotahi Research Report 683. https://www.nzta.govt.nz/assets/resources/research/reports/683/683-determining-the-ecological-and-air-quality-impacts-of-particulate-matter-from-brake-and-tyre-wear-and-road-surface-dust.pdf
Shepherd D, Dirks K, Welch D, McBride D, & Landon J. (2016). The covariance between air pollution annoyance and noise annoyance, and its relationship with health-related quality of life. International Journal of Environmental Research and Public Health, 13(8). https://doi.org/10.3390/ijerph13080792
Sierzchula W, Bakker S, Maat K, & van Wee B. (2014). The influence of financial incentives and other socio-economic factors on electric vehicle adoption. Energy Policy, 68, 183–194. https://doi.org/10.1016/j.enpol.2014.01.043
Silva RA, West JJ, Lamarque JF, Shindell DT, Collins WJ, Faluvegi G, Folberth GA, Horowitz LW, Nagashima T, Naik V, Rumbold ST, Sudo K, Takemura T, Bergmann D, Cameron-Smith P, Doherty RM, Josse B, MacKenzie IA, Stevenson DS, & Zeng G. (2017). Future global mortality from changes in air pollution attributable to climate change. Nature Climate Change, 7(9), 647–651. https://doi.org/10.1038/nclimate3354
Simoni M, Baldacci S, Maio S, Cerrai S, Sarno G, & Viegi G. (2015). Adverse effects of outdoor pollution in the elderly. Journal of Thoracic Disease, 7(1), 34–45. https://doi.org/10.3978/j.issn.2072-1439.2014.12.10
Sordello R, Ratel O, de Lachapelle FF, Leger C, Dambry A, & Vanpeene S. (2020). Evidence of the impact of noise pollution on biodiversity: A systematic map. Environmental Evidence, 9(1), 1–27. https://doi.org/10.1186/s13750-020-00202-y
South Wairarapa District Council. (nd). Wairarapa International Dark Sky Reserve. https://swdc.govt.nz/wp-content/uploads/Summary-of-the-Plan-Change-and-FAQs.pdf
https://swdc.govt.nz/wairarapa-international-dark-sky-reserve/
Spacewatch. (2024). Look Up Space reports more than 10,000 active satellites in orbit. https://spacewatch.global/2024/06/look-up-space-reports-more-than-10000-active-satellites-in-orbit/
Stats NZ. (2018). 2018 Census. https://www.stats.govt.nz/2018-census/
Stats NZ. (2022). National population projections: 2022(base)–2073. https://www.stats.govt.nz/information-releases/national-population-projections-2022base2073/
Stats NZ. (nd). Births and deaths. https://www.stats.govt.nz/topics/births-and-deaths/
Sterup, K. L. (2024). The nature of coastal light pollution and its relationship with morphological variation in a larval fish around Wellington, New Zealand [Master’s thesis, Victoria University of Wellington]. https://doi.org/10.26686/wgtn.25130843
Stewart C, Damby DE, Horwell CJ, Elias T, Ilyinskaya E, Tomašek I, Longo BM, Schmidt A, Carlsen HK, Mason E, Baxter PJ, Cronin S, & Witham C. (2022a). Volcanic air pollution and human health: Recent advances and future directions. Bulletin of Volcanology, 84(1). https://doi.org/10.1007/s00445-021-01513-9
Stewart C, Young N, Kim N, Johnston D, & Turner R. (2022b). Thunderstorm asthma: A review, risks for Aotearoa New Zealand, and health emergency management considerations. New Zealand Medical Journal, 135(1557). https://mro.massey.ac.nz/server/api/core/bitstreams/4658a329-753f-49e7-9bae-e8350f617039/content#:~:text=The%20aetiological%20role%20of%20thunderstorms
Talbot N. (2019). Air Quality and Societal Impacts from Predicted Climate Change in Auckland. https://knowledgeauckland.org.nz/media/1079/tr2019-013-air-quality-and-societal-impacts-climate-change-auckland-final.pdf
Talbot N, & Reid N. (2017). A Review of Research into the Effects of Shipping on Air Quality in Auckland: 2006–2016. Auckland Council, Te Kaunihera o Tāmaki Makaurau technical report TR2017/005. https://knowledgeauckland.org.nz/media/1131/tr2017-005-review-of-research-effects-of-shipping-on-air-quality-in-auckland-2006-2016.pdf
Tapada A, Marques CS, Marques CP, & Costa C. (2021). Astrotourism: A literature review and framework for future research. Enlightening Tourism: A Pathmaking Journal, 11(2), 291–331. http://dx.doi.org/10.33776/et.v11i2.5189
Telfar-Barnard L, & Zhang J. (2021). The Impact of Respiratory Disease in New Zealand: 2020 Update. https://www.asthmafoundation.org.nz/assets/documents/Respiratory-Impact-report-final-2021Aug11.pdf
Tunno B, Longley I, Somervell E, Edwards S, Olivares G, Gray S, Cambal L, Chubb L, Roper C, Coulson G, & Clougherty JE. (2019). Separating spatial patterns in pollution attributable to woodsmoke and other sources, during daytime and nighttime hours, in Christchurch, New Zealand. Environmental Research, 171, 228–238. https://doi.org/10.1016/j.envres.2019.01.033
UCAR Center for Science Education. (nd). How weather affects air quality. https://scied.ucar.edu/learning-zone/air-quality/how-weather-affects-air-quality
UNEP (United Nations Environment Programme). (2022). Noise, blazes and mismatches: Emerging issues of environmental concern. https://www.unep.org/resources/frontiers-2022-noise-blazes-and-mismatches
Waikato Regional Council. (nd). Weather and air quality. https://www.waikatoregion.govt.nz/environment/air/weather-and-air/
Wang T, Kaida N, & Kaida K. (2023). Effects of outdoor artificial light at night on human health and behavior: A literature review. Environmental Pollution, 323. https://doi.org/10.1016/j.envpol.2023.121321
Watts G, Pearse J, Delikostidis I, Kissick J, Donohue B, & Dalley J. (2020). Tranquillity mapping in New Zealand national parks: A pilot study. Noise Mapping, 7(1), 303–315. https://doi.org/10.1515/noise-2020-0025
WHO (World Health Organization). (2021). WHO Global Air Quality Guidelines: particulate matter (PM2.5 and PM10), ozone, nitrogen Dioxide, sulfur dioxide and carbon monoxide. https://iris.who.int/handle/10665/345329
WHO (World Health Organization). (2022). Chapter 11. Environmental noise. In Compendium of WHO and Other UN Guidance on Health and Environment. https://cdn.who.int/media/docs/default-source/who-compendium-on-health-and-environment/who_compendium_noise_01042022.pdf?sfvrsn=bc371498_3
Wickham L, Metcalfe J, & Mason K. (2023). Air Quality and Social Inequity in Aotearoa: A Preliminary Assessment. https://www.esr.cri.nz/digital-library/environmental-health-report-air-quality-and-social-inequity-in-aotearoa-a-preliminary-assessment
Wilton E. (2022). Picton Air Emission Inventory – 2022. https://www.marlborough.govt.nz/repository/libraries/id:2ifzri1o01cxbymxkvwz/hierarchy/
documents/environment/air-quality/picton-air-emission-inventory-list/2383412_Picton_Air_Emission_Inventory_2022-Updated_April_2023_Final.pdf
Wolf K, Hoffmann B, Andersen ZJ, Atkinson RW, Bauwelinck M, Bellander T, Brandt J, Brunekreef B, Cesaroni G, Chen J, de Faire U, de Hoogh K, Fecht D, Forastiere F, Gulliver J, Hertel O, Hvidtfeldt UA, Janssen NAH, Jørgensen JT, … Ljungman PLS. (2021). Long-term exposure to low-level ambient air pollution and incidence of stroke and coronary heart disease: A pooled analysis of six European cohorts within the ELAPSE project. The Lancet Planetary Health, 5(9), e620–e632. https://doi.org/10.1016/S2542-5196(21)00195-9
Wright LP, Zhang L, Cheng I, Aherne J, & Wentworth GR. (2018). Impacts and effects indicators of atmospheric deposition of major pollutants to various ecosystems: A review. Aerosol and Air Quality Research, 18(8), 1953–1992. https://doi.org/10.4209/aaqr.2018.03.0107
Yan H, Li Q, Feng K, & Zhang L. (2023). The characteristics of PM emissions from construction sites during the earthwork and foundation stages: An empirical study evidence. Environmental Science and Pollution Research, 30(22), 62716–62732. https://doi.org/10.1007/s11356-023-26494-4
Zanobetti A, Ryan PH, Coull BA, Luttmann-Gibson H, Datta S, Blossom J, Brokamp C, Lothrop N, Miller RL, Beamer PI, Visness CM, Andrews H, Bacharier LB, Hartert T, Johnson CC, Ownby DR, Khurana Hershey GK, Joseph CLM, Mendonça EA, … Gold DR. (2024). Early-life exposure to air pollution and childhood asthma cumulative incidence in the ECHO CREW Consortium. JAMA Network Open, 7(2), E240535. https://doi.org/10.1001/jamanetworkopen.2024.0535
Zielinska-Dabkowska KM, & Xavia K. (2021). Looking up to the stars: A call for action to save New Zealand’s dark skies for future generations to come. Sustainability (Switzerland), 13(23). https://doi.org/10.3390/su132313472

Our air 2024 Tō tātou hau takiwā
October 2024
© Ministry for the Environment