This snapshot summarises the latest greenhouse gas inventory, which covers data from the years 1990 to 2023.
For the full inventory report, see New Zealand's Greenhouse Gas Inventory 1990–2023.
We are pleased to present this snapshot of New Zealand's Greenhouse Gas Inventory (1990–2023).
The Inventory is the official record of all emissions produced and removed by human activities within Aotearoa New Zealand. Prepared each year by the Ministry for the Environment, the Inventory helps fulfil New Zealand’s responsibilities as a signatory to the Paris Agreement and the United Nations Framework Convention on Climate Change. These international agreements are all about working together, globally, to tackle climate change and reduce greenhouse gas emissions.
Our annual Inventory is like a detailed balance sheet of all the greenhouse gases we emit and remove. This year, it shows our total emissions other than those from forests and other land uses (gross emissions) reduced by 2 per cent in 2023 – the equivalent of taking about a quarter of all our cars off the road. Our forests and other land uses also absorbed more emissions than in 2022, meaning net emissions reduced by 4 per cent.
The Inventory is part of New Zealand’s official statistics system. Publicly available data like this helps inform critical decisions, including around effective policies to combat climate change, and helps ensure New Zealand is best prepared for a resilient future.
This snapshot condenses the key findings from the Inventory report into an accessible and straightforward format. It highlights the critical trends in emissions and removals, providing a clear overview for those seeking an understanding of New Zealand’s contributions to the global challenge of climate change.
The Inventory’s comprehensive record of our emissions and removals provides crucial insights into New Zealand’s current situation and historical trends, allowing us to track progress and identify areas of improvement. To complement this, other reports on New Zealand’s projected emissions offer valuable perspectives on our progress toward emissions reduction targets. Together, these reports form a well-rounded evidence base, supporting informed decision-making and effective strategies to meet our climate goals.
We hope you find this snapshot report useful, as part of the range of information available showing our contribution to the global effort to meet the challenge of climate change.
| James Palmer Secretary for the Environment |
Alison Collins Departmental Chief Science Advisor Ministry for the Environment |
Read the long description of the infographic for New Zealand’s Greenhouse Gas Inventory:
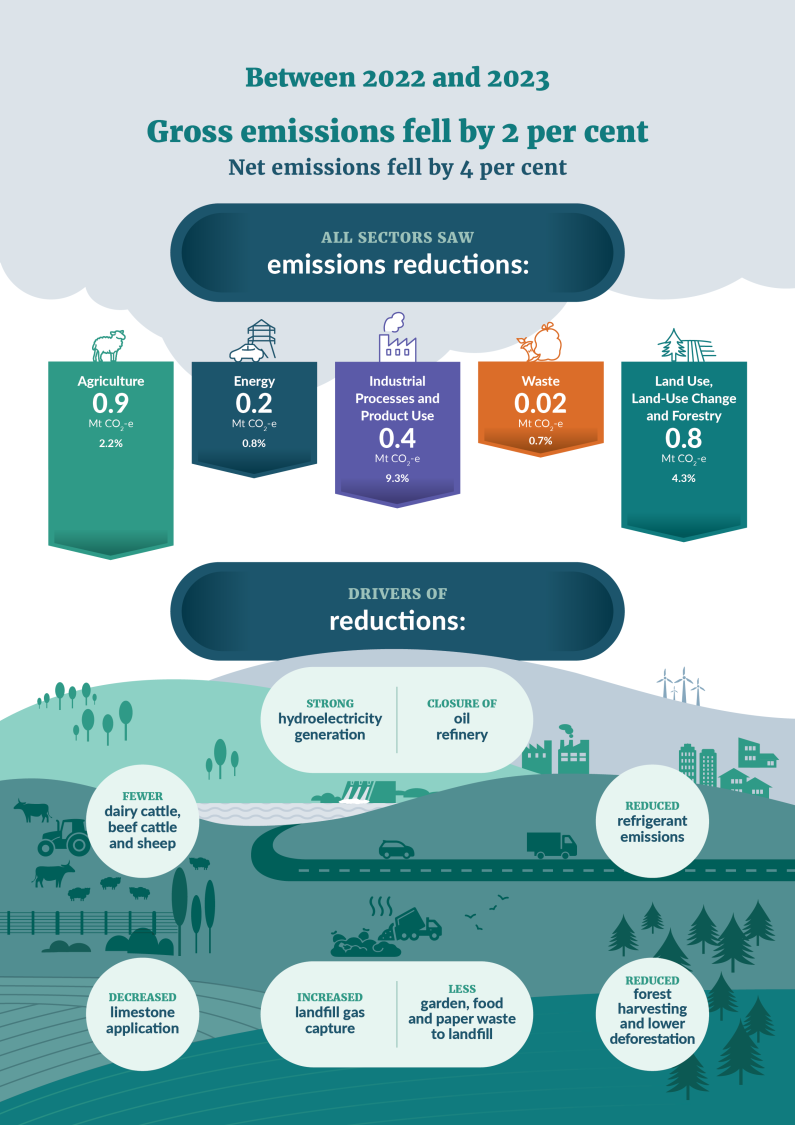
Between 2022 and 2023
Gross emissions fell by 2 per cent
Net emissions fell by 4 per cent
All sectors saw emissions reductions
Five arrows are underneath this line, one for each sector, pointing down and proportional to the reductions from each, stating:
↓ Agriculture: 0.9 Mt CO2-e, 2.2%
↓ Energy: 0.2 Mt CO2-e, 0.8%
↓ Industrial Processes and Product Use: 0.4 Mt CO2-e, 9.3%
↓ Waste: 0.02 Mt CO2-e, 0.7%
↓ Land Use, Land-Use Change and Forestry: 0.8 Mt CO2-e, 4.3%
Drivers of reductions
An illustrated landscape is depicted with rolling hills; trees; wind turbines; hydroelectricity dam; housing, city and roading elements; landfill; and an agricultural scene complete with sheep and cattle.
Throughout the landscape are text bubbles that detail the secondary drivers of emissions reductions between 2021 and 2022:
- Strong hydroelectricity generation. This bubble is next to the hydroelectricity dam illustration.
- Closure of oil refinery. This bubble is placed next to the factory illustration.
- Fewer dairy cattle, beef cattle and sheep. This is placed by the agricultural illustration.
- Decreased limestone application. This is placed by the agricultural field illustration.
- Reduced refrigerant emissions. This bubble is placed next to the building and houses illustration.
- Increased landfill gas capture. This bubble is next to the landfill illustration.
- Less garden, food, and paper waste to landfill. This bubble is next to the landfill illustration.
- Reduced forest harvesting and lower deforestation. This bubble is next to the forestry illustration.
New Zealand’s Greenhouse Gas Inventory (the Inventory) is the authoritative evidence source on Aotearoa New Zealand’s greenhouse gas emissions and removals
The Inventory is the official annual report of all emissions and removals of greenhouse gases from human activities in New Zealand. It is produced as part of New Zealand’s obligations under the Paris Agreement and United Nations Framework Convention on Climate Change (UNFCCC).
The Inventory informs New Zealand’s action on climate change. Accurate emissions data are essential to understand current emissions and past trends, generate policy recommendations on climate change, and for developing and monitoring emissions reduction plans and targets.
The Inventory is a Tier 1 statistic under New Zealand’s Official Statistics System. This means it is one of the most important publicly available statistics for making informed decisions, and for monitoring the state and progress of New Zealand.
The Inventory is prepared based on internationally agreed reporting guidelines
The Inventory is prepared by following the Paris Agreement reporting guidelines and the international methodology guidelines set out by the Intergovernmental Panel on Climate Change (IPCC).
The guidelines govern what the Inventory covers and when it is submitted. The latest year inventoried is 16 months behind the current calendar year, to give countries time to collect and process inventory data and prepare the submission. The latest Inventory, published in April 2025, contains data from 1990 (the base year for reporting) to 2023, inclusively.
Inventory reporting uses carbon dioxide equivalence (CO2-e) for comparing greenhouse gases. Carbon dioxide equivalence allows different gases to be aggregated together and their warming impacts compared. The Inventory applies 100-year global warming potential (GWP100) values from the IPCC Fifth Assessment Report (AR5). This is the required common unit under the Paris Agreement.
Inventory estimates are continuously improved
Data for each year in the Inventory, from 1990 to the latest year, is recalculated when methodologies or underlying data change. This means the emissions estimates are only up to date in the latest Inventory, and previous inventories are not useful for comparisons. Changes made to the Inventory are often related to improvements in data collection, emission factors and methodology, or the inclusion of new emission sources.
Further information on the improvements that have been introduced this year, and their emissions impacts are described in Chapter 10 of the Inventory.
The Inventory groups emissions and removals into five sectors:
- Agriculture (eg, livestock digestive systems, fertiliser and manure)
- Energy (eg, road transport and electricity production)
- Industrial Processes and Product Use (IPPU) (eg, production of metals and chemicals, and use of refrigerants)
- Waste (eg, landfills and wastewater processing)
- Land Use, Land-Use Change and Forestry (LULUCF) (eg, land use, such as forest land, cropland and grassland).
Gross emissions are total emissions from the Agriculture, Energy, IPPU and Waste sectors, as well as emissions from Tokelau1. Net emissions are all emissions, minus what is absorbed by forests and other land uses. Net emissions are calculated by combining gross emissions with emissions and removals from the LULUCF sector.
1 New Zealand extended its ratification of the UNFCCC and Paris Agreement on 13 November 2017 to include Tokelau, an overseas dependent territory of New Zealand. Emissions from Tokelau have been included since the 2019 submission of the Inventory.
All sectors had emissions decreases in 2023
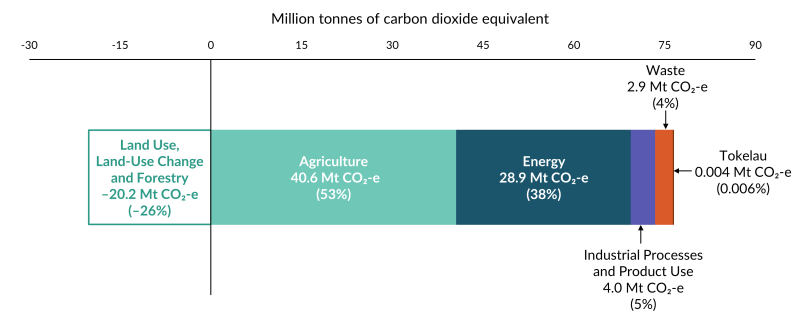
In 2023, New Zealand’s gross emissions were 76.4 million tonnes of carbon dioxide equivalent (Mt CO2-e), 2 per cent (1.6 Mt CO2-e) lower than in 2022.
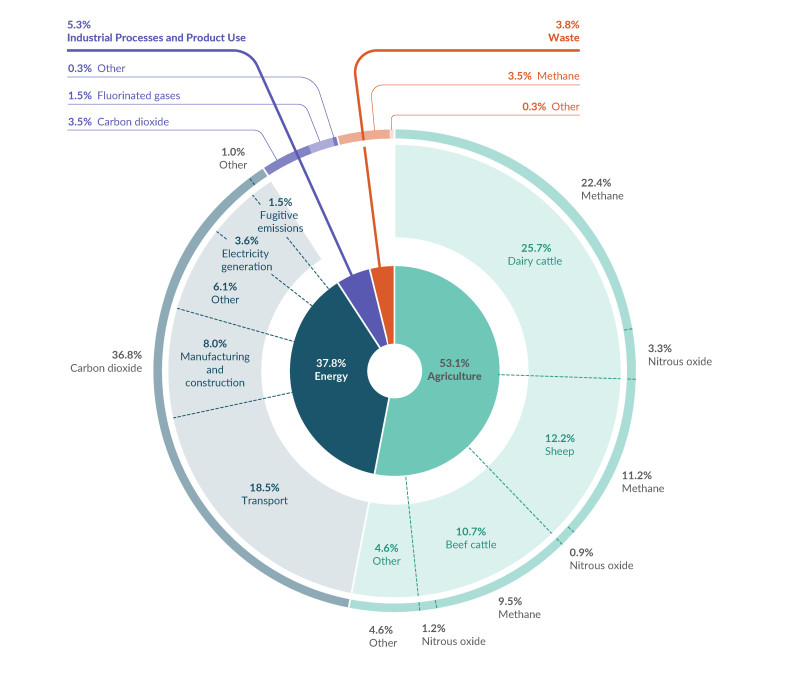
The Agriculture and Energy sectors remained the greatest contributors to gross emissions, at 53 and 38 per cent, respectively. Over half of gross emissions were from methane (48 per cent) and nitrous oxide (9 per cent), largely from agricultural sources. The remaining emissions were mostly carbon dioxide (41 per cent), largely from the Energy and IPPU sectors. The breakdown of emissions by sector are shown in figure 1 and figure 2.
The LULUCF sector offset 26 per cent of gross emissions, bringing net emissions to 56.2 Mt CO2-e. This is 4 per cent (2.4 Mt CO2-e) lower than in 2022.
Figure 1: Breakdown of New Zealand’s emissions (in Mt CO2-e) by sector in 2023
All sectors had emissions decreases between 2022 and 2023:
- The largest reduction was from the Agriculture sector, which decreased 2.2 per cent (0.9 Mt CO2-e). This was due to fewer livestock, and a decrease in limestone use.
- The second largest reduction was from the LULUCF sector, which decreased 4.3 per cent (0.8 Mt CO2-e) due to reduced harvesting and deforestation rates in planted forests, decreasing emissions from forest land and grassland.
- The third largest reduction was from the IPPU sector of 9.3 per cent (0.4 Mt CO2-e) due to a fall in emissions from refrigeration and air conditioning.
- Energy emissions decreased by 0.8 per cent (0.2 Mt CO2-e), following a decrease of 8 per cent between 2021 and 2022. These decreases were due to high rainfall that enabled increased renewable electricity generation, meaning less coal- and gas-fired electricity generation was required.
- There were also decreases in emissions from Waste by 0.7 per cent (0.02 Mt CO2-e), and Tokelau by 10.4 per cent (0.0005 Mt CO2-e).
Figure 2: Gross greenhouse gas emissions percentages in 2023 by sector, category and gas type
In 2023, New Zealand’s gross emissions were 76.4 Mt CO2-e. This is a 13 per cent increase from emissions in 1990.
The five emission sources that contributed most to the increase since 1990 were:
- methane from enteric fermentation (digestive processes) from dairy cattle, largely due to an increase in the dairy cattle population (an increase of 8.6 Mt CO2-e)
- carbon dioxide from road transportation, due to traffic growth (an increase of 5.9 Mt CO2-e)
- nitrous oxide from agricultural soils, due to increased fertiliser use (an increase of 1.7 Mt CO2-e)
- carbon dioxide from fuel use in manufacturing and construction, due to increased economic activity leading to increased production (an increase of 1.4 Mt CO2-e)
- hydrofluorocarbons, mainly due to increased use in refrigeration and air-conditioning systems as replacement for ozone-depleting substances (an increase of 1.1 Mt CO2-e).
Between 1990 and 2023, Waste was the only sector to have an overall reduction in emissions, decreasing 11 per cent due to improved solid-waste management at landfills.
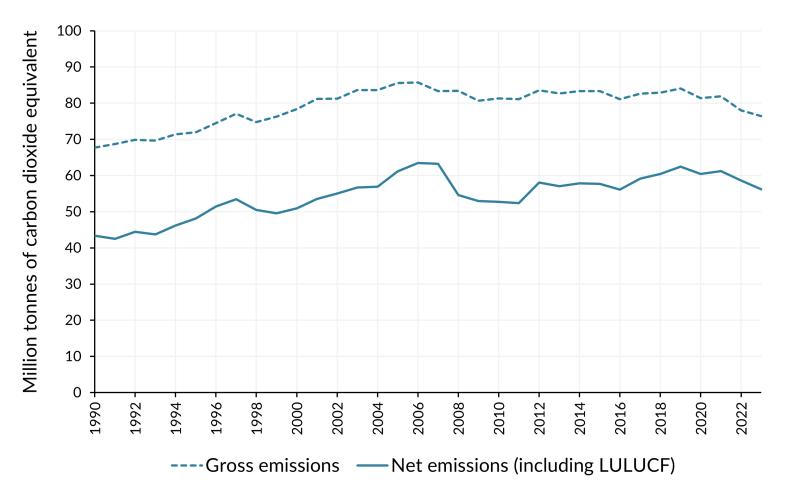
Gross emissions peaked in 2006 and were relatively stable through to 2019. Since 2019, emissions have been trending down, with a slight increase between 2020 and 2021 (figure 3). A range of factors have contributed, including COVID-19 restrictions, high levels of hydroelectricity generation and reduced livestock numbers.
Figure 3: New Zealand’s gross and net emissions (in Mt CO2-e) from 1990 to 2023
Net emissions are influenced by forest planting cycles
Net emissions are gross emissions combined with the emissions and removals from the LULUCF sector. Forests absorb carbon dioxide from the atmosphere as they grow, but also release it after being harvested, deforested or following natural disturbances like storm damage. Since 1990, the LULUCF sector has remained a net carbon sink, meaning it absorbs more carbon dioxide than it emits.
New Zealand is currently experiencing high rates of forest planting, at levels not seen since the 1990s. 83,000 hectares of new forests were established in 2023. This is on top of the establishment of 86,000 hectares of new forests in 2022. 3,200 hectares were deforested in 2023, the lowest rate reported since the 1990s.
The LULUCF sector absorbed 26 per cent of gross emissions in 2023 (20.2 Mt CO2-e). This is a decrease from 1990, when the LULUCF sector absorbed 36 per cent of New Zealand’s gross emissions (24.3 Mt CO2-e, figure 4). This change is mainly the result of the overall increase in gross emissions, and the impact of harvesting cycles on net emissions.
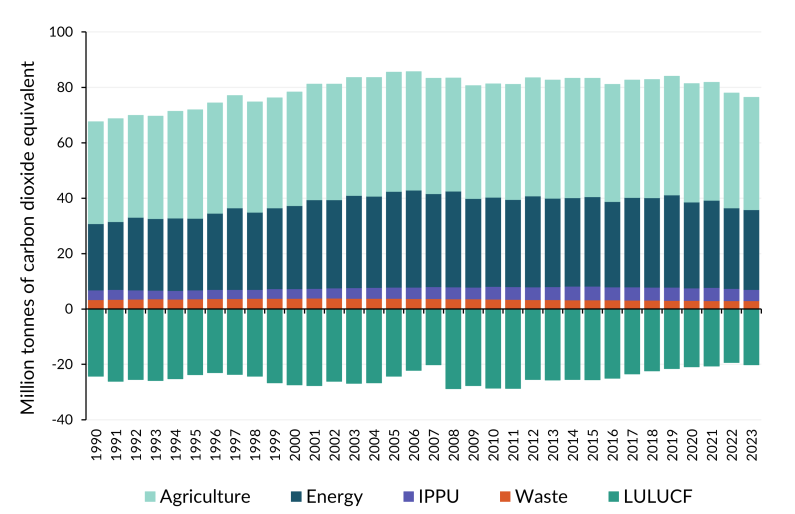
Aotearoa New Zealand’s emissions by sector reflect our national economy, with the Agriculture, Energy and LULUCF sectors dominating our emissions profile (figure 4). The Agriculture and Energy sectors drive overall trends in gross emissions due to their size and their higher sensitivity to changes in global economic conditions, extreme weather conditions and natural disasters compared to other sectors.
Figure 4: New Zealand’s greenhouse gas emissions (in Mt CO2-e): Trends by sector from 1990 to 2023
Drivers of emissions trends by sector
Agriculture
2022–2023
Emissions change: 2% decrease
Drivers: Reductions in the number of dairy cattle, beef cattle and sheep, and a decrease in the application of limestone.
1990–2023
Emissions change: 10% increase
Emissions trends and drivers: Emissions peaked in 2014 and remained fairly stable between 2015 and 2021, before dropping significantly in 2022 and 2023. Since 1990, this has been driven by increases in the number of dairy cattle, and synthetic nitrogen fertiliser use. Decreases since 2022 have largely been driven by reduced livestock populations, as well as market forces, such as the price of fertiliser and afforestation incentives under the New Zealand Emissions Trading Scheme (NZ ETS).
Energy
2022–2023
Emissions change: 0.8% decrease
Drivers: High rainfall year, allowing greater electricity generation from renewable energy sources, and the 2022 closure of the Marsden Point oil refinery.
1990–2023
Emissions change: 20% increase
Emissions trends and drivers: Emissions increased until 2006. They decreased slightly and remained steady to 2019, then generally declined to 2023. Emissions from road transport have increased since 1990, due to increased population and economic activity. New Zealand has also used more fuel for processing food, beverages and tobacco. Decreases since 2019 have been influenced by the COVID-19 pandemic and high levels of hydro-power generation in 2022 and 2023.
Industrial Processes and Product Use (IPPU)
2022–2023
Emissions change: 9% decrease
Drivers: 2021 and 2022 had increased heat-pump sales, resulting in greater emissions from retired equipment. In 2023, heat-pump sales slowed and disposal emissions decreased.
1990–2023
Emissions change: 16% increase
Emissions trends and drivers: Increased steadily to 2015, trending down to a large decrease in 2023. Since 1990, this has been driven by phasing out ozone-depleting substances used for refrigeration and air-conditioning and replacing them with hydrofluorocarbons, and increased use of household and commercial air conditioning. Increases have been offset between 2020 and 2022 due to COVID-19 restrictions and the shutdown of the Marsden Point oil refinery.
Waste*
2022–2023
Emissions change: 0.7% decrease
Drivers: Improvements and increases in landfill-gas capture, and ongoing reductions in the proportion of garden, food and paper waste disposed to landfill.
1990–2023
Emissions change: 11% decrease
Emissions trends and drivers: Emissions increased between 1990 and 2002, before stabilising, then declining steadily since 2005. This is due to improvements in the management of solid-waste disposal at landfills, despite population growth and economic activity increasing waste volumes since 1990. Drivers for these improvements include the 2004 National Environmental Standards for Air Quality and the NZ ETS, which has included large municipal landfills since 2013.
Land Use, Land-Use Change and Forestry (LULUCF)
2022–2023
Net removals change: 4% increase in removals
Drivers: Reduced harvesting rates in planted forests, decreasing emissions from forest land; lower deforestation of planted forests, decreasing emissions from grassland.
1990–2023
Net removals change: 17% decrease in removals
Emissions trends and drivers: Long-term trends are driven by the age of planted forests, along with harvesting and replanting cycles. Since 2008, net removals from LULUCF have generally been decreasing, due to the large proportion of maturing planted forests undergoing harvest. As high harvesting rates continue, and forests are replanted, the average age of the forest reduces. In the future, as harvest rate decline and younger stands mature, net removals are likely to increase.
We have a unique emissions profile
Aotearoa New Zealand’s has a different emissions profile than most other developed countries. This is because New Zealand has a relatively:
- small Energy sector, generating approximately 40 per cent of gross emissions due to New Zealand’s high proportion of renewable electricity generation (although that is partially offset by relatively high transport emissions)
- large Agriculture sector, generating more than half of gross emissions due to the key role primary industries play in the economy.
Our emissions trends differ from other developed countries
New Zealand’s gross emissions have increased since 1990, whereas in many other developed countries, emissions are now below 1990 levels. Transforming energy systems by increasing renewable electricity generation has provided significant opportunities for many countries to effectively reduce emissions.
In 1990, 81 per cent of New Zealand’s electricity supply was already being generated from renewables, which was very high by international standards and still is.
New Zealand’s electricity demand has increased since 1990, requiring a 36.8 per cent increase in electricity generation between 1990 and 2023. New Zealand has kept up with the increased demand for electricity while maintaining a high rate of renewable electricity generation. While the volume of renewable electricity generation fluctuates annually due to weather, over the past 10 years the average share of renewable electricity generated has been similar to the 1990 proportion, at 83.4 per cent.
New Zealand has met the additional electricity demand across the period by increasing capacity for renewable electricity generation; however, the high rates of renewables in 1990 has limited the extent to which electricity emissions could be reduced relative to other countries.
Emissions are decoupling from population growth
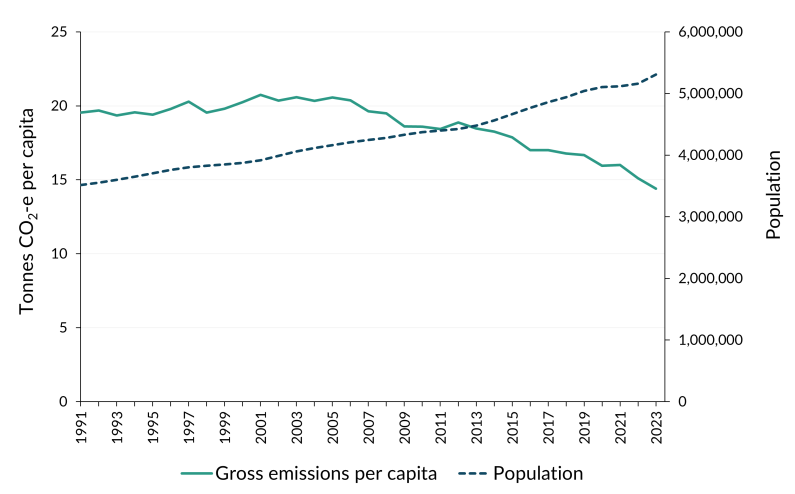
Aotearoa New Zealand’s emissions increased between 1991 and 2023. At the same time, economic and population growth was also strong. 2 During this time, emissions per capita decreased by 26.4 per cent while the population increased by 51 per cent (figure 5). Emissions per capita were relatively stable between 1991 and 2005. Since 2006, emissions have been declining, while population has continued to increase.
2 Population data is from Stats NZ’s Estimated Resident Population (table reference DPE058AA), which is only available from 1991. For this reason, comparisons between population growth and emissions per capita are between 1991 and 2023.
Figure 5: Comparison between New Zealand’s population and gross emissions per capita
Stats NZ publishes information on the relationship between emissions and gross domestic product (GDP) in their greenhouse gas emissions (industry and household) update. This is on a System of Environmental-Economic Accounting (SEEA) basis and enables GDP and emissions to be compared.
Our emissions reduction goals
New Zealand has set domestic goals to reduce greenhouse gas emissions.
- In 2019 the Climate Change Response Act 2002 was amended to establish targets for reducing emissions: net-zero emissions (except biogenic methane) by 2050 and a 24 to 47 per cent reduction of biogenic methane by 2050.
- Emissions budgets have been set to step towards the 2050 targets.
- Government Target 9: Reduced net greenhouse gas emissions commits New Zealand to meeting its first and second emissions budgets.
New Zealand’s first emissions reduction plan, released in May 2022, sets out the policies and strategies to meet the first emissions budget. New Zealand’s second emissions reduction plan, to meet the second emissions budget, was published in December 2024. The plan contains targeted actions in the sectors of the economy that produce the greatest emissions, including Agriculture, Transport, Energy and Waste.
New Zealand has also set two international emissions reduction targets under the Paris Agreement. New Zealand’s first Nationally Determined Contribution (NDC) sets a target of a 50 per cent reduction of net emissions below gross 2005 levels, by 2030. Our second NDC sets a target of a 51 to 55 per cent reduction compared to 2005 levels, by 2035.
The latest update on how we are tracking towards our emissions reduction goals can be found on the Ministry for the Environment’s webpage New Zealand’s projected greenhouse gas emissions to 2050.
New Zealand’s first Biennial Transparency Report under the Paris Agreement was submitted in December 2024. This report covers how New Zealand is tracking towards the achievement of our first NDC. It also covers information on adaptation measures and financial contributions to developing countries to address climate change.
The Inventory is the official source of information for Aotearoa New Zealand’s greenhouse gas emissions data; however, other sources of data are derived from the Inventory for domestic purposes.
The Ministry for the Environment thanks the following agencies for their contribution to the production of New Zealand’s Greenhouse Gas Inventory 1990–2023:
- the Ministry of Business, Innovation and Employment
- the Ministry for Primary Industries
- Stats NZ
- the Government of Tokelau’s Ministry of Climate, Oceans and Resilience.
* After the Inventory was finalised, a potential underestimate of emissions was identified in a Waste sector category. Preliminary analysis suggests that this may revise the decrease in Waste sector emissions from 11 per cent to 7 per cent between 1990 and 2023, and from 0.7 per cent to 0.5 per cent between 2022 and 2023. However, the impact on New Zealand's overall emissions totals is expected to be minor. Any adjustments will be made in future submissions, once a full review has been completed.
New Zealand's Greenhouse Gas Inventory 1990–2023: Snapshot
April 2025
© Ministry for the Environment