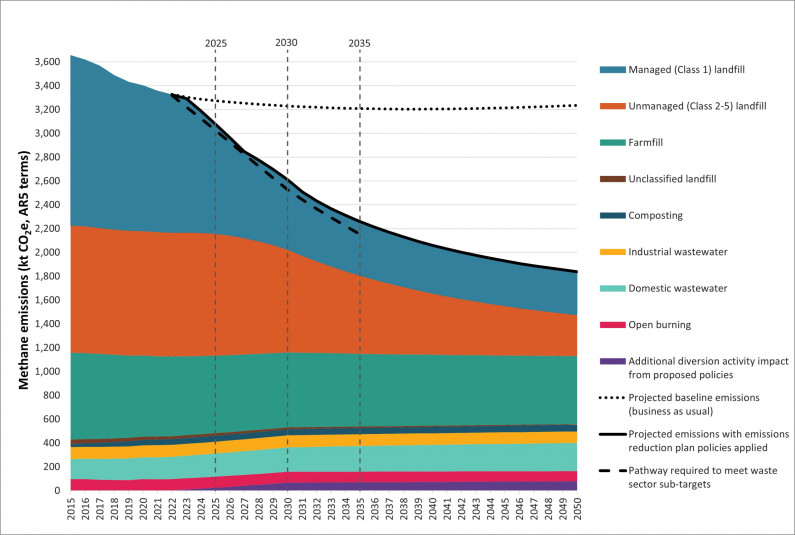
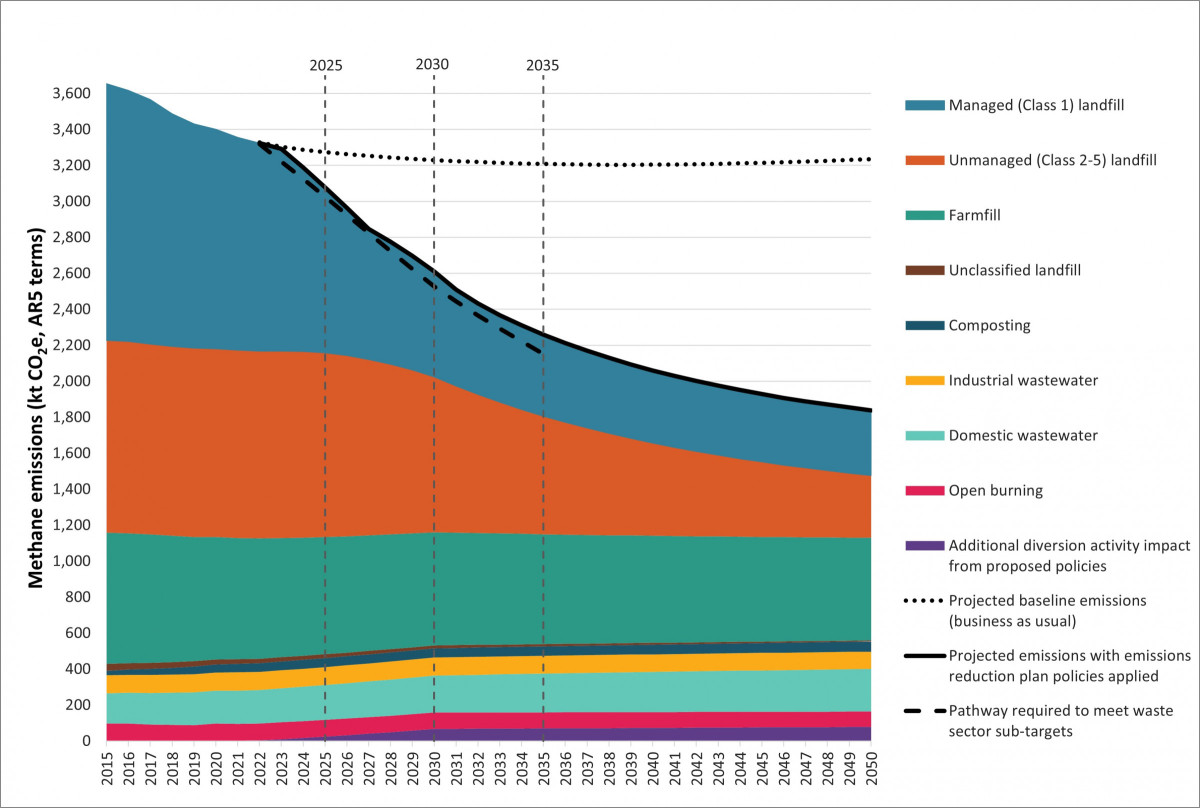
Since 2004, improvements in waste management and landfill gas capture at municipal landfills have resulted in a significant reduction of waste sector emissions.
In 2022, waste sector emissions were 19.8 per cent below 1990 levels. This highlights the positive impact of regulation of a significant proportion of municipal landfills in New Zealand.
The reduction of emissions from the waste sector is attributed to a number of initiatives implemented to improve solid waste management practices in New Zealand.
These initiatives include:
- requiring municipal landfills to meet resource consent conditions under the Resource Management Act 1991
- requiring large municipal landfills to operate landfill gas capture systems (LFG) according to the National Environmental Standards for Air Quality (2004) under the Resource Management Act 1991
- providing direction and guidance to local governments and the waste sector through the New Zealand Waste Strategy and its revision in 2010
- developing the Solid Waste Analysis Protocol to set up a consistent waste classification system, sampling regimes and survey procedures for the estimation of solid waste composition
- implementing a waste disposal levy for waste sent to class 1-4 landfills and enabling regulations to establish product stewardship requirements under the Waste Minimisation Act 2008.
In 2022, 93.3 per cent of waste emissions were biogenic methane – largely generated by the decomposition of organic waste (such as food, garden, wood and paper waste). While waste contributes a small percentage of our total emissions, biogenic methane has a warming effect 28 times greater than carbon dioxide.

