Two people stand by a wind turbine on a hill.

Tracking progress Carbon Neutral Government Programme

In December 2025, 85 CNGP participants from Tranches 1, 2, and 3 reported their emissions, reduction targets, and plans to achieve them.

This is the third year that participants from all tranches have reported, providing a comprehensive understanding of the New Zealand government’s emissions profile.

The CNGP programme saw one organisation participate for the first time: University of Canterbury. Two organisations did not report this year: Te Pukenga, which is being disestablished and Whaikaha, which was re-established in 2024 as a public service department. Whaikaha will begin to report their emissions in December 2027.

2025 reporting

View the list of CNGP participants (PDF, 260KB)

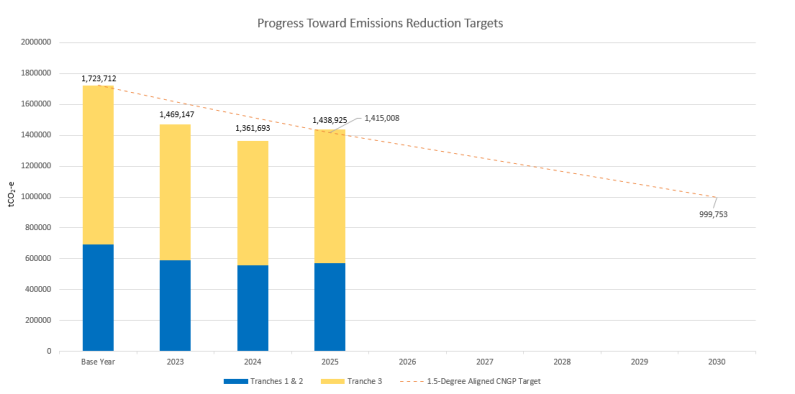
2025 was the first year agencies reporting on a financial year (FY 2024/25) were being assessed against their 1.5-degree aligned targets. Emissions have decreased 16.5% since base years with overall CNGP emissions reported for 2025 of 1,438,925 tCO2-e. This is a decrease of 284,787 tCO2-e and represents a reduction of up to 90% for some organisations compared to base years. A total of 73% of the organisations reporting on their targets this year (those reporting on a Financial Year) met their individual 1.5-degree aligned 2025 target.  Across the programme, there was a small shortfall of 23,917 tCO2-e in reaching the pro-rated 2025 target of a 17.9% reduction. Participants reporting on a calendar year will be assessed against their 1.5-degree aligned 2025 target next reporting period.

The next 1.5-degree aligned target occurs in 2030 with a reduction target of 42%1. Fifty-two percent of organisations indicated they are confident or very confident of achieving their 2030 reduction targets. Fifteen percent identified funding as a barrier in meeting their target.

1 The CNGP 2030 42% reduction target may be pro-rated due to restated base years and new or recently established organisations.  

Progress toward targets

CNGP progress towards emissions reduction targets from base year to 2025.

A total of 1,438,925 tCO2-e of greenhouse gas emissions were reported under participants’ reduction targets. Forty percent (573,593 tCO2-e) was from tranche 1 and 2 participants, and 60 percent (865,333 tCO2-e) from tranche 3 participants. 

Tranches 1 and 2

Sixty-nine public sector organisations were directed to participate in the CNGP in 2025. This number includes 41 Tranche 1 organisations (Public Service Departments, Departmental Agencies and the Executive Branch) reporting to the CNGP for the fourth time, and 28 Tranche 2 organisations (Crown Agents and schools) reporting for the third time.

Total emissions from Tranches 1 and 2 were 573,593 tCO2-e, a 17% reduction from respective base years. 

See further emission data from Tranche 1 and 2 (PDF, 635KB)

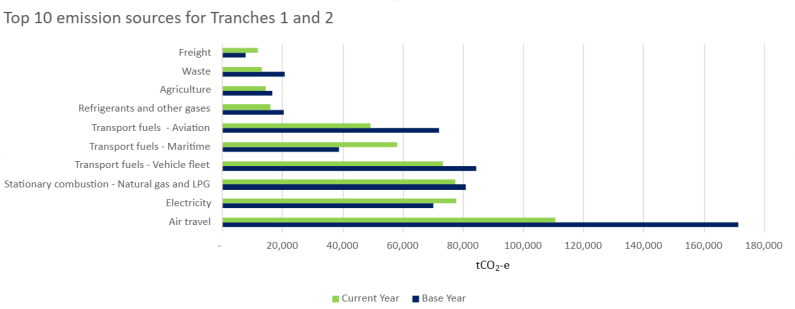
Top emission sources for Tranche 1 and 2 organisations

Graph showing top emission sources for Tranche 1 and 2, see captions for full detail
Top emission sources for Tranche 1 and 2 organisations


Base year Current year % change from base year % of total (current year)
Air travel (all classes)

171415

110754

 -35%

19%

Stationary combustion- Nat gas & LPG (including T&D losses

81000

77574

-4%

14%

Transport fuels- vehicle fleet 84343

73522

-13%

13%

Electricity

70221

77779

11%

14%

Transport fuels- maritime

 38934

58140

49%

10%

Transport fuels – aviation

72094

35441

 -31%

 9%

Refrigerants and other gases 20482 18241 -21% 3%
Agriculture

 16776

 16285

 -13%

 3%

Freight

7913

13173

50%

 2%

Waste 20832 14286 -31% 2%
Graph showing top emission sources for Tranche 1 and 2, see captions for full detail
Top emission sources for Tranche 1 and 2 organisations


Base year Current year % change from base year % of total (current year)
Air travel (all classes)

171415

110754

 -35%

19%

Stationary combustion- Nat gas & LPG (including T&D losses

81000

77574

-4%

14%

Transport fuels- vehicle fleet 84343

73522

-13%

13%

Electricity

70221

77779

11%

14%

Transport fuels- maritime

 38934

58140

49%

10%

Transport fuels – aviation

72094

35441

 -31%

 9%

Refrigerants and other gases 20482 18241 -21% 3%
Agriculture

 16776

 16285

 -13%

 3%

Freight

7913

13173

50%

 2%

Waste 20832 14286 -31% 2%

Tranche 3

Thirty organisations, including state-owned enterprises and tertiary institutions, were encouraged to join the programme from financial year 2022/2023. Of these, 19 organisations submitted reports to the CNGP in 2025, some opting to report by calendar year instead of financial year. Nine Tranche 3 participants opted not to report in 2025. However, the programme added one new participant in 2025, University of Canterbury.

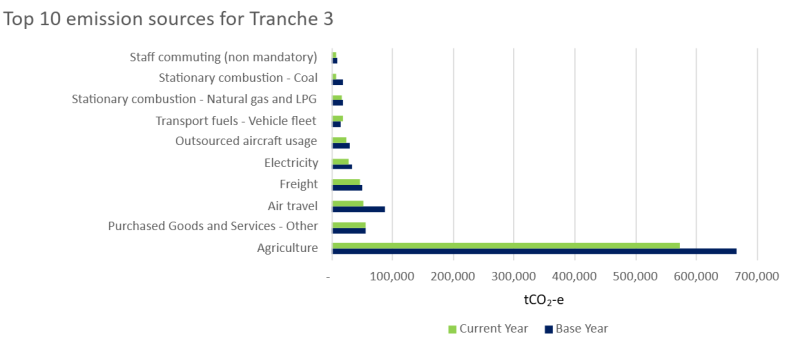
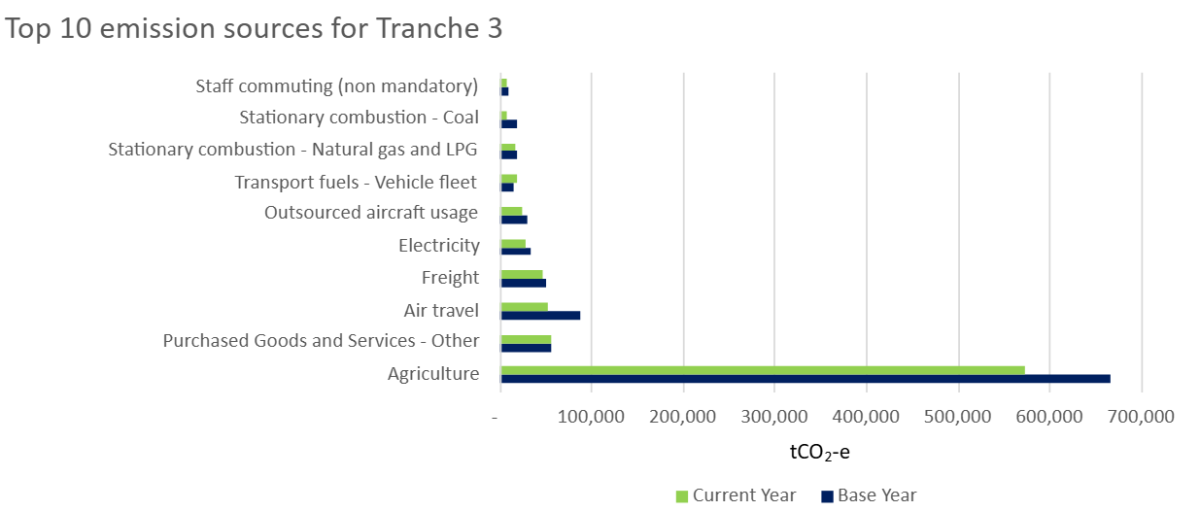
Total emissions from Tranche 3 were 865,333 tCO2-e. This is a 16% reduction from base year. 

See further emission data from Tranche 3 (PDF, 392KB)

Top emission sources for Tranche 3 organisations

CNGP Tranche 3 organisations - see caption for full details
Top emission sources for Tranche 3 organisations


Base year Current year % change from base year % of total (current year)
Agriculture

666032

573963

 -14%

 66%

Purchased goods and services - Other

57358

52092

0%

 7%

Air travel

88022

53911

-39%

 6%

Freight 50274

47125

-6%

 5%

Outsourced aircraft usage

 31369

24775

 -21%

 3%

Transport fuels - Vehicle fleet

15222

19370

 27%

 2%

Electricity

33466

28760

-14%

 3%

Stationary combustion - Nat Gas & LPG 

 19295

17498

 -9%

 2%

Stationary combustion - Coal

18675

9010

-52%

1%

Staff Commuting (non mandatory)

 10945

8408

 -23%

1%

CNGP Tranche 3 organisations - see caption for full details
Top emission sources for Tranche 3 organisations


Base year Current year % change from base year % of total (current year)
Agriculture

666032

573963

 -14%

 66%

Purchased goods and services - Other

57358

52092

0%

 7%

Air travel

88022

53911

-39%

 6%

Freight 50274

47125

-6%

 5%

Outsourced aircraft usage

 31369

24775

 -21%

 3%

Transport fuels - Vehicle fleet

15222

19370

 27%

 2%

Electricity

33466

28760

-14%

 3%

Stationary combustion - Nat Gas & LPG 

 19295

17498

 -9%

 2%

Stationary combustion - Coal

18675

9010

-52%

1%

Staff Commuting (non mandatory)

 10945

8408

 -23%

1%

Key emission sources in the CNGP

Air travel

Across all tranches, air travel is the second highest source of emissions, and it is the top source of emissions for tranches 1 and 2. Since base years, emissions for air travel across all tranches have reduced by 37% (94,772 tCO2-e), with tranches 1 and 2 seeing reductions of 35% (60,661 tCO2-e) and tranche 3 seeing a reduction of 39% (34,111 tCO2-e). Air travel is also the number one reduced category of emissions across the programme. The programme has not only seen a reduction in total emissions from air travel but also in person kilometres travelled (27% reduction) and in the class of travel. 

Air travel accounted for 11% of 2025 reported emissions across all tranches, down from 13% in 2024. This includes any travel on a commercial plane such as for overseas diplomacy, site visits, and community engagement and consultation (organisation-controlled aircraft, such as NZDF planes, are counted separately).  

To date, 98% of participants have implemented measures to reduce air travel emissions through things like improved travel data and oversight, changes to travel policy and technology to support online meetings.  

Transport Fuels 

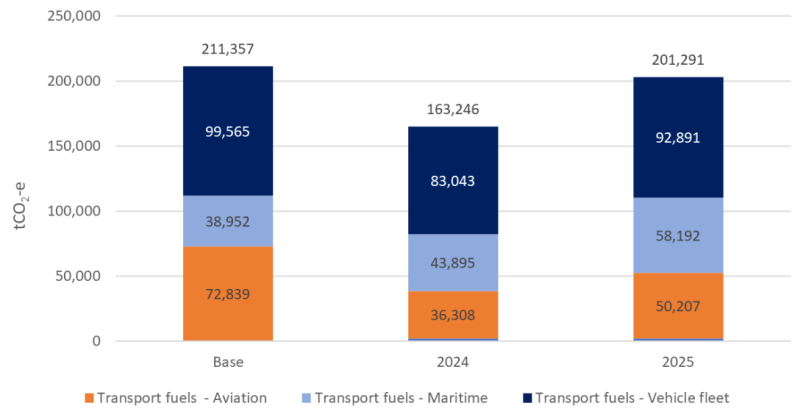
Transport fuel emissions have decreased from base year overall by 5%. However, all transport fuels have increased since 2024. This includes a 12% increase from vehicle fleet (92,891 tCO2-e in 2025), 33% increase from maritime (58,192 tCO2-e in 2025) and 38% increase from aviation (50,207 tCO2-e in 2025).  

Fleet emissions reduced 7% from base years, in part due to the transition to electric vehicles. The New Zealand Police road fleet continues to account for the majority of vehicle emissions (24%) but has seen a decrease of 12% compared with base year due to replacement with more fuel-efficient vehicles.  

See Government Fleet Dashboard (New Zealand Government Procurement).

The New Zealand Defence Force (NZDF) accounts for almost all reported maritime (99%) and aviation (94%) fuel use, reflecting the fuel-intensive nature of military aviation and maritime capabilities, operational readiness requirements, and training activities. Reported transport fuel emissions increased between 2024 and 2025, primarily due to improvements in reporting maturity, including the first-time inclusion of international aviation and maritime fuels, rather than a like-for-like increase in domestic activity. This expanded reporting provides a more complete picture of fuel demand and informs considerations relating to fuel availability and resilience. 

The NZDF will continue to explore opportunities to improve fuel efficiency and reduce emissions where these can be achieved without compromising operational effectiveness. However, alternative fuels suitable for military aviation and maritime operations are not yet available at the scale, reliability, or cost required to support core military functions and readiness requirements. 

Fuel emissions by fuel type 

Graph showing CNGP organisations fuel emissions by transport fuel type: aviation, maritime and vehicle fleet.

CNGP Fuel emissions

Coal boilers

All coal boilers in New Zealand state schools were decommissioned by 11 April 2025 and have been replaced with alternative heating systems, including wood pellet boilers, wood chip boilers, and heat pumps. 

 The final permanent replacement heating system was completed in March 2026.  

Agriculture

In 2025, agriculture was the highest emissions source across the programme, making up 41% of total emissions (588,474 tCO2-e). This reflects a 14% decrease of agricultural emissions since base year and a 7% increase from 2024 to 2025. Five organisations reported agricultural emissions in 2025 with Pāmu continuing to account for 97% of the agricultural emissions. Landcorp/Pāmu manages nearly 360,000 ha of land around New Zealand. 

Supply Chain emissions

In addition to the mandatory programme emission sources, CNGP participants are encouraged to measure, report, and set appropriate targets for their Scope 3 value chain emissions. Alternative targets are permitted, reflecting the sometimes-limited influence organisations have over these sources. These Scope 3 value chain emissions disclosures improve transparency and help organisations understand where significant emissions sit in their wider operations. In 2025, 3,028,547tCO2-e was reported under this category:   

  1. Fifty-five percent of this was from Airways, from leased assets, investments, etc.  
  2. Twenty-two percent was from embodied construction emissions primarily from New Zealand Transport Authority, the state schooling sector and Kāinga Ora.  
  3. Twenty percent of this was from the state schooling sector, predominantly from staff and student commuting, and student transport. 

This is an important part of the programme where emission reduction initiatives by government can influence the wider economy and support the provision of lower emission goods and services across a wide range of industries. 

Energy and electricity

Seven percent of 2025 reported emissions across all tranches were from electricity. This covers activities such as heating and lighting. Stationary combustion accounted for 8% of overall programme emissions with a decrease of 23% from respective base years.  

CNGP organisations are leading by example in the energy transition, in line with the government’s Emissions Reduction Plan and net zero 2050 goals (Target 9). The energy landscape has dynamically shifted, with MBIE forecasting a faster and earlier decline in New Zealand's natural gas supply than previously predicted, putting pressure on gas prices and security of supply. The future replacement of gas systems with efficient electric technology will result in further operational savings and enhance organisational and national resilience to gas supply constraints. Further, investment in energy efficiency and energy transition reduces agency operational costs. We are seeing CNGP agencies' investment in modern energy systems enabling some of these other benefits such as on-site operational resilience.  

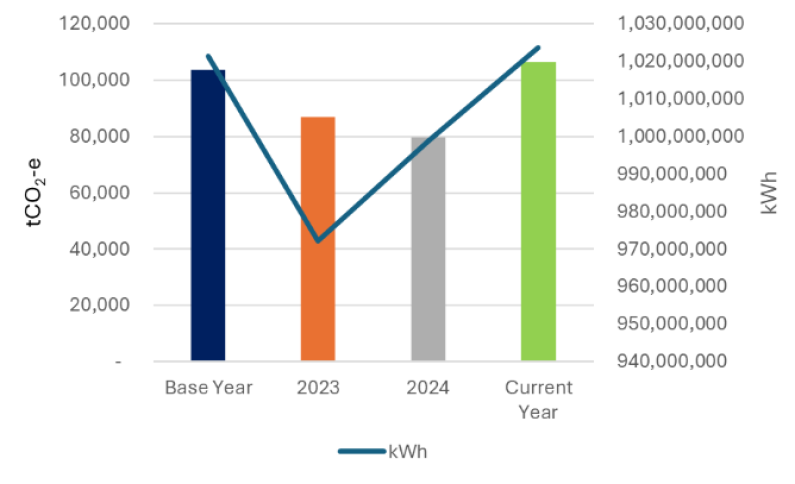
No material change in electricity consumption (kWh) has occurred since base year demonstrated by a 0.2% increase since respective base years. This reflects efficiency improvements given the displacement of fossil fuels. We expect to see electricity increase over coming years as electrification of buildings and fleets progress. Electricity emissions have increased slightly by 3% (2,853 tCO2-e) across the programme, largely reflecting the New Zealand electricity grid and resulting changes in the emissions factor. Emissions were relatively low in 2022 and 2023 due to favourable weather and strong hydro inflows but increased in 2024 as the proportion of fossil-based generation increased.  

See further information on Reducing emissions in government office buildings (New Zealand Government Procurement)

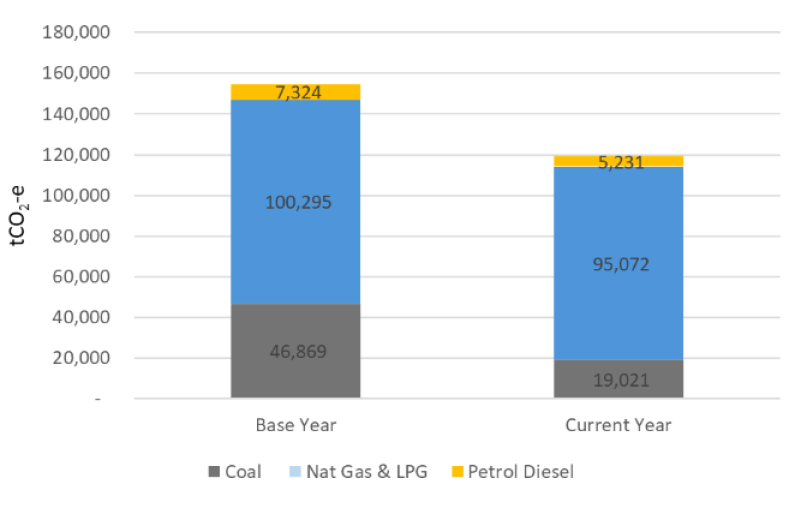
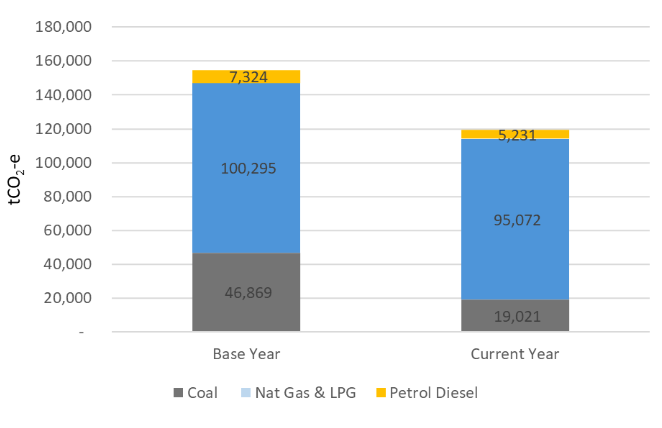
Stationary Combustion/Building Energy Use 

Graph showing CNGP organisations' stationary combustion/building energy usage by category of coal, natural gas & LPG and petrol/diesel.
CNGP energy use

  Base year 2023 2024
Stationary combustion - Natural Gas 95090.31759 90534.7607 88197.08
Stationary combustion - Coal 34485.98513 32788.9502 19819.86
Stationary combustion - LPG 8019.764703 9711.28039 8895.67
Stationary combustion - Other (eg. Diesel, Petrol, etc) 7782.991829 7670.200391 7528.62
Total tCO2-e 145379.0592 140705.1917 124441.23
       
Electricity use (kWh) 1051354946 1033383442 1055699954
Graph showing CNGP organisations' stationary combustion/building energy usage by category of coal, natural gas & LPG and petrol/diesel.
CNGP energy use

  Base year 2023 2024
Stationary combustion - Natural Gas 95090.31759 90534.7607 88197.08
Stationary combustion - Coal 34485.98513 32788.9502 19819.86
Stationary combustion - LPG 8019.764703 9711.28039 8895.67
Stationary combustion - Other (eg. Diesel, Petrol, etc) 7782.991829 7670.200391 7528.62
Total tCO2-e 145379.0592 140705.1917 124441.23
       
Electricity use (kWh) 1051354946 1033383442 1055699954

Electricity Emissions and Usage (kWh) 

Graph showing  CNGP organisations' electricity usage by emissions and kWh

Cost savings  

Approximately 43% of organisations have identified savings or anticipate cost savings associated with emission reduction initiatives. For example, the Ministry of Justice (MoJ), Te Tāhū o te Ture, is seeing notable achievements in the energy and cost saving space. Between FY24 and FY25, MoJ saw reductions of $371,000 in electricity costs and $263,000 in gas costs. 

Some organisations are exploring ways to significantly reduce their energy consumption while also generating their own energy. This includes a combination of energy-efficiency initiatives and the installation of solar PV systems, which directly offset energy use and emissions across their operations. 

The Department of Internal Affairs, Te Tari Taiwhena, has completed its highly successful sustainability project at the National Library. As a result of the project, the current energy savings are almost entirely offsetting the additional energy demand from the new archives building, Te Rua, which came online July 2025. Energy savings came from the following initiatives: sealing of air leaks, demand-controlled ventilation and installing energy monitoring infrastructure. Additionally, the investment in solar energy will provide long-term reductions in carbon emissions and operating costs. The Department is looking to expand this pilot to the rest of its Collection sites, pending the outcomes of feasibility reviews.   

Another example of energy production is the solar installation at Lincoln University, Te Whare Wānaka o Aoraki, as part of “the Energy farm” initiative. It comprises of 3,000 photovoltaic panels and will have a peak production capability of 1.5MW or an average annual generating capacity of ~2.8 million kWh. This will offset an estimated 331 tCO2-e per year, demonstrating how capital investments in on‑site generation can deliver sustained emissions reductions and operating cost savings for institutions with large energy loads.   

Data Improvements 

The first of the 1.5-degree aligned target years offers a reflection on the progress organisations have individually made and that the programme has made. The CNGP began with organisations primarily reporting on mandatory emissions: scopes 1, 2 and mandatory 3. Over the past few years of reporting, organisations’ data quality, confidence and reporting have matured. This is reflected in greater accuracy and expansion of reporting and of significant value‑chain (non-mandatory scope 3) emissions categories becoming an increasing focus.  

For example, commuting emissions are now being more widely measured as organisational data maturity improves. In 2025, 42 organisations reported commuting emissions, up from 22 in 2023. For some organisations, commuting has emerged as their largest or second largest source of emissions source, with total reported commuting emissions of 118,337 tCO2-e in 2025.  

Other organisations have improved and implemented new record keeping software enabling more automated and accurate data gathering and forecasting. For example, ACC has migrated sustainability data to Oracle Sustainability EPM to improve data quality, reporting, and forecasting. This enables more informed decisions and supports the effective rollout of new emissions reduction policies and initiatives. The Ministry of Foreign Affairs & Trade procured emissions-specific software that now holds both the Ministry’s emissions data and facilitates analyses. They have 59 sites and approximately 340 properties in 53 countries; they anticipate the software will allow easier identification of opportunities to reduce emissions and costs. 

Further information