Issue 3: Our activities at sea are affecting the marine environment

Many of our activities at sea affect the health of marine ecosystems and its social, cultural, and economic value to us. Understanding the effects of these activities is crucial for managing our activities and minimising their effects.

Image: “Mickrick”, istock photos
Report focus: fishing, shipping, coastal development. (See Environment Aotearoa 2019 for more detail on fishing and the impacts from fishing).
Almost all of the marine environment. Coastal areas are most affected because of the intensity of overlapping activities.
Marine biodiversity is reduced and parts of the seabed and coastline are profoundly modified since European settlement.
Long-lived species may recover slowly from fishing, mining, and dredging. Trawled seabeds are slow to recover.
Activities threaten protected species and can degrade ecosystems. They affect social and economic values, iwi relationships with rohe moana, and cultural practices.

Read the long description for What is the current state of this issue and what has changed?
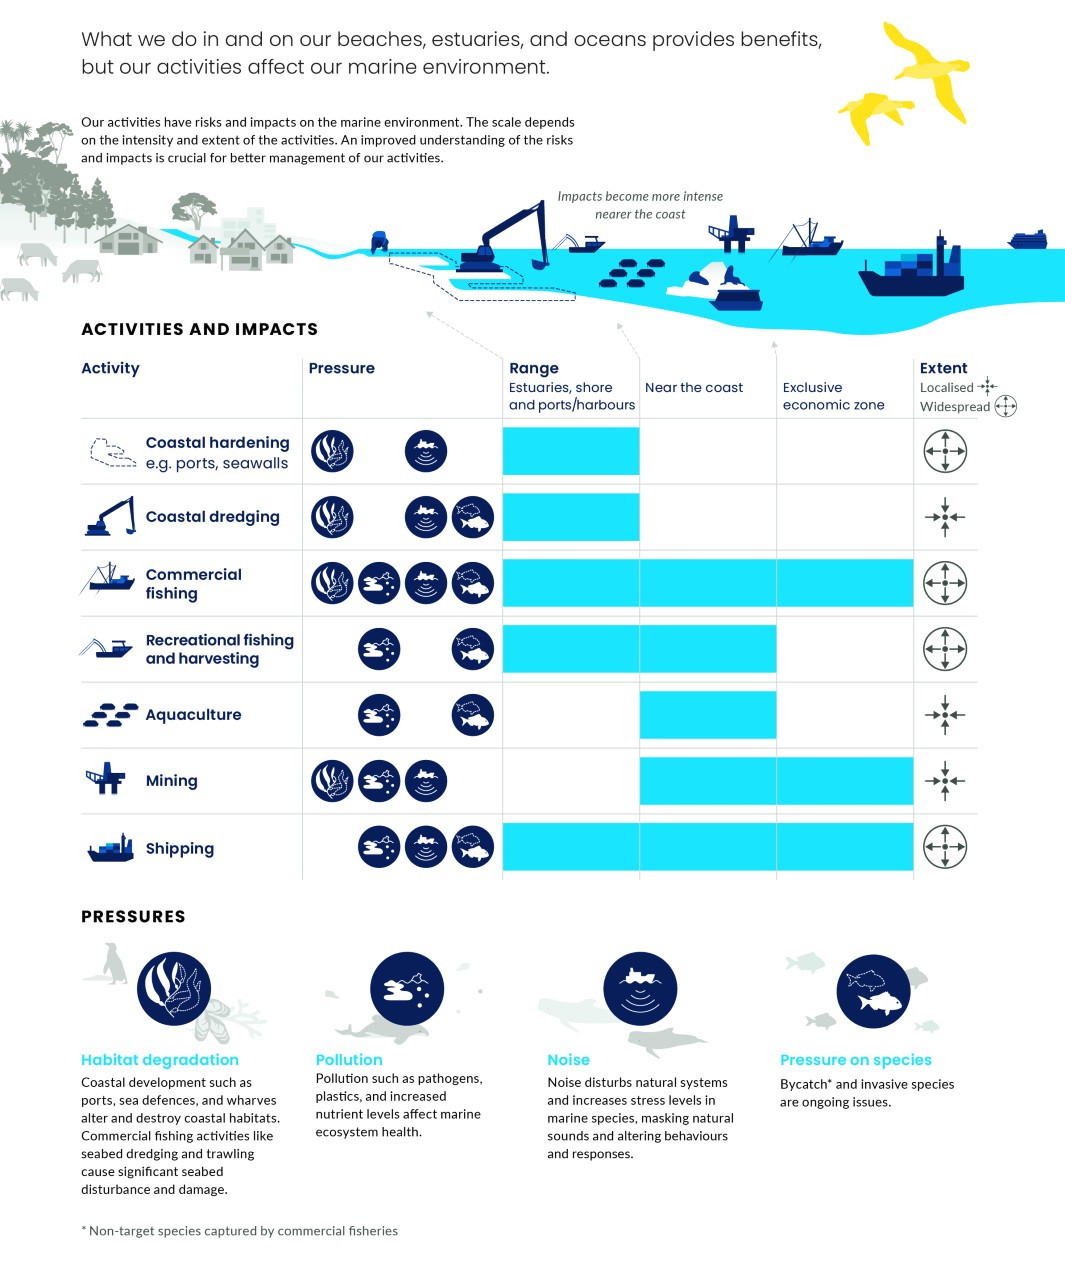
What we do in and on our beaches, estuaries, and oceans provides benefits, but our activities affect our marine environment.
Our activities have risks and impacts on the marine environment. The scale depends on the intensity and extent of the activities. An improved understanding of the risks and impacts is crucial for better management of our activities.
Impacts become more intense nearer the coast.
Coastal development such as ports, sea defences, and wharves alter and destroy coastal habitats. Commercial fishing activities like seabed dredging and trawling cause significant seabed disturbance and damage.
Pollution such as pathogens, plastics, and increased nutrient levels affect marine ecosystem health.
Noise disturbs natural systems and increases stress levels in marine species, making natural sounds and altering behaviours and responses.
Bycatch* and invasive species are ongoing issues.
*Non-target species captured by commercial fisheries
Activity: Coastal hardening e,g, ports, seawalls.
Pressure/s: Habitat degradation and Noise
Range: Estuaries, shore and ports/harbours
Extent: Widespread
Activity: Coastal dredging
Pressure/s: Habitat degradation, Noise, Pressure on species
Range: Estuaries, shore and ports/harbours
Extent: Localised
Activity: Commercial fishing
Pressure/s: Habitat degradation, Pollution, Noise, Pressure on species
Range: Estuaries, shore and ports, Near the coast, Exclusive economic zone
Extent: Widespread
Activity: Recreational fishing and harvesting
Pressure/s: Pollution, Pressure on species
Range: Estuaries, shore and ports, Near the coast
Extent: Widespread
Activity: Aquaculture
Pressure/s: Pollution, Pressure on species
Range: Near the coast
Extent: Localised
Activity: Mining
Pressure/s: Habitat degradation, Pollution, Noise, Pressure on species
Range: Near the coast, Exclusive economic zone
Extent: Localised
Activity: Shipping
Pressure/s: Pollution, Noise, Pressure on species
Range: Estuaries, shore and ports, Near the coast, Exclusive economic zone
Extent: Widespread
Updated data on fish stocks and impacts of fishing from the Aquatic Environment and Biodiversity Annual Review, updated indicators for bycatch of protected species: Hector’s and Māui dolphins, and the marine economy.
New Zealand’s total marine catch peaked at nearly 650,000 tonnes in 1997 and 1998. Since 2009, the catch has remained stable at less than 450,000 tonnes per year (FAO, 2018, 2019).
Fish stocks are managed under Aotearoa New Zealand’s quota management system where a stock is defined as a species of fish, shellfish, or seaweed in a particular area. In 2018, the quota management system included 642 stocks (685 including substocks) of which 169 were scientifically evaluated (representing 68 percent of catch) and 219 were not assessed (representing 32 percent of catch). The remaining stocks are regarded as nominal (representing less than 1 percent of catch) (Fisheries New Zealand, 2019a, 2019b).
In 2018, 84 percent of routinely assessed stocks were considered to be fished within safe limits, an improvement from 81 percent in 2009 (Fisheries New Zealand, 2019a). Of the 16 percent that are considered overfished, 9 stocks were collapsed, meaning that closure should be considered to rebuild the stock as quickly as possible (Fisheries New Zealand, 2019b).
Stock assessments apply to individual fish stocks so they do not account for interactions between different stocks or interactions with the broader marine environment.
During fishing, protected species like seabirds, marine mammals, and some sharks and rays, and other non-commercial fish and invertebrates are caught unintentionally. Deaths caused by fishing can have consequences for a population (Carrier et al, 2010; Robertson & Chilvers, 2011; Schreiber & Burger, 2001). Bycatch can have a particular impact on our protected species because they generally have long life spans, mature at a late age, and have low fertility.
Bycatch is decreasing but remains a serious pressure on some populations (table 4). It is the main threat to seabirds, especially albatrosses and petrels (Ministry for Primary Industries, 2013).
| What is affected | What is changing? | Latest figures |
|---|---|---|
| Seabirds | Decrease in bycatch in the last 20 years but not for all species | 4,186 estimated seabird deaths in the 2016/17 fishing year compared to 8,192 in the 2002/03 fishing year |
| Sea lions | Decrease in observed captures in trawl fisheries since 2003, but variable between years | 3 observed captures of sea lions in the 2016/17 fishing year compared to 12 in the 2002/03 fishing year |
| Fur seals | Observed captures are variable but there is a decrease in overall estimated captures between the 2002/03 and the 2016/17 fishing years | 111 observed captures across trawl and longline fisheries in the 2016/17 fishing year compared to 125 in the 2002/03 fishing year |
| Māui and Hector’s dolphins | Decrease in bycatch of Māui and Hector’s dolphin in the last 20 years (see indicator: Bycatch of protected species: Hector’s and Māui dolphins) | 1 Māui and 29 Hector’s dolphins were reported as entangled or potentially entangled in 2009—2018, compared to 4 and 60 respectively for 1999–2008 |
Note: Numbers for seabirds, sea lion and fur seal are from Protected species bycatch in New Zealand fisheries, Ministry for Primary Industries Dragonfly data science. Numbers for Māui and Hector’s dolphin bycatch are from the Department of Conservation’s Hector’s and Māui dolphin incident database (see indicator: Bycatch of protected species: Hector’s and Māui dolphins).
Bycatch also affects non-protected species but those without commercial value are discarded and the number caught is not usually recorded. Bycatch of dolphins (other than Māui and Hector’s), turtles, and protected sharks also occurs (see Environment Aotearoa 2019).
In addition to fishing, Hector’s and Māui dolphin deaths can have other causes like boat strikes, maternal separation, or disease. Toxoplasmosis has been identified as a potentially serious threat, particularly to female Māui and Hector’s dolphins. The disease has negative consequences for reproduction, behaviour, and mortality, and has been confirmed in nine dolphins that died between 2007 and 2018. The infection is caused by the parasite Toxoplasma gondii, which reproduces in cats, is emitted in their faeces, and carried to the sea (Roberts et al, 2019).
The number of commercial trawl and dredge tows has decreased in the past two decades, and the area that is trawled is decreasing (Ministry for Primary Industries, 2019). The total trawled area in deepwater fisheries for 1990–2016 was estimated as 335,812 square kilometres. This corresponds to 24 percent of the fishable area (Baird & Wood, 2018). Fishable area represents seabed that is shallower than 1,600 metres, the current maximum depth that trawlers can reach, where there are no seabed trawling restrictions like benthic protection areas.
The shallow seabed is trawled more extensively than deeper areas. Between 1990 and 2016, trawling occurred over approximately 28 percent of the seabed where the water depth was less than 200 metres, 40 percent of the seabed where water depth was 200–400 metres, and 35 percent of the seabed where water depth was 400–600 metres (Baird & Wood, 2018).
Almost all (99.5 percent) of our imports and exports are transported by sea. The volume of exports grew steadily from 2004 to 2014 then levelled off. Imports and exports in containers continue to grow (Deloitte, 2016, 2018).
Vessel traffic data from July 2014 to June 2015 recorded the highest shipping traffic densities off the east coast of New Zealand, especially off Canterbury and the north-east coast of the North Island (Riding et al, 2016) (see figure 7).
The number of cruise ships coming to New Zealand and the number of passengers per ship grew five-fold between 2004 and 2015 (Ministry of Business Innovation and Employment, 2016). Annual reports from Maritime New Zealand show a general increase in New Zealand port visits by cruise ships since 2005. The average number of passengers and consequently the size of cruise ship has also grown.
Coastal development around the world has increased and involves physically altering coastal habitats and coastal hardening (the replacement of natural coastal environments with hard surfaces). Developments include engineering for coastal protection works, dredging, building ports, wharfs and jetties, residential development, and reclaiming land from the sea (GESAMP, 2001). Before humans arrived in New Zealand, forests grew to the water’s edge. After settlement, and European settlement in particular, much of this vegetation was removed (Brake & Peart, 2013).
Understanding the extent of coastal development is limited by a lack of data and analysis.
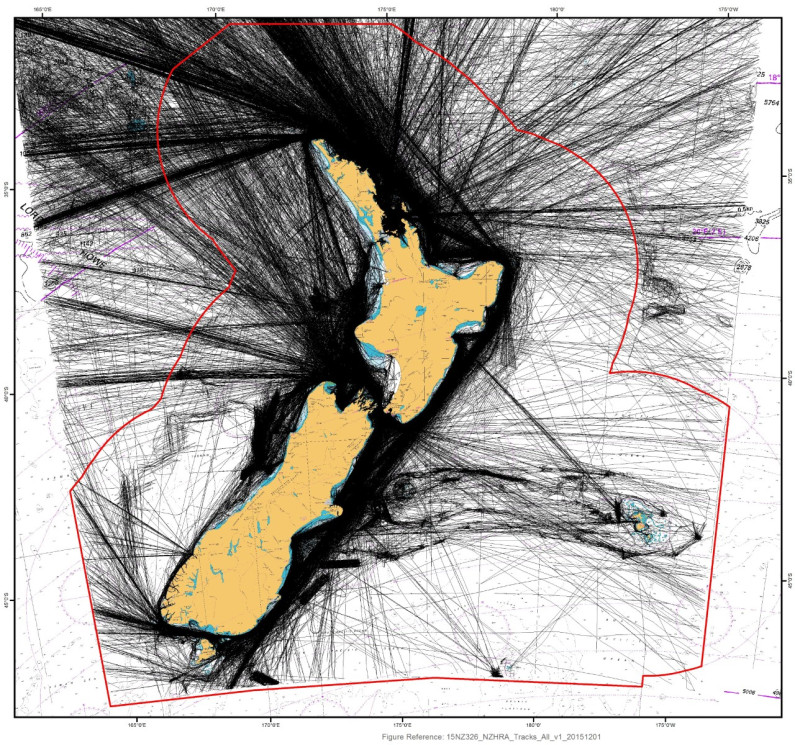
Image: Figure courtesy of LINZ (Land Information New Zealand)

Image: Figure courtesy of LINZ (Land Information New Zealand)
Our activities at sea support economic and population growth. In the year ended March 2017, the marine economy was estimated to contribute $3.8 billion directly to New Zealand’s economy and a further $3.2 billon indirectly (Stats NZ, 2019b).
At 37 percent, shipping is now the biggest contributor to our marine economy, surpassing offshore minerals as the highest-earning economic activity (see indicator: Marine economy). Shipping includes ship and boat building and repair services, water freight and water passenger transport, and port and water transport terminal operations (see indicator: Marine economy and figure 8).
For comparison, in 2017, fisheries and aquaculture contributed 29 percent and offshore minerals contributed 27 percent to the marine economy. The value of cruise ship activity has increased by 13 percent per year since 2010. However, this is not measured as a contribution to our marine economy as vessels are operated by overseas companies. An estimated $411.8 million was generated during the 2011/12 season from port visits, of which about 63 percent remained in the New Zealand economy (Worley, 2012).
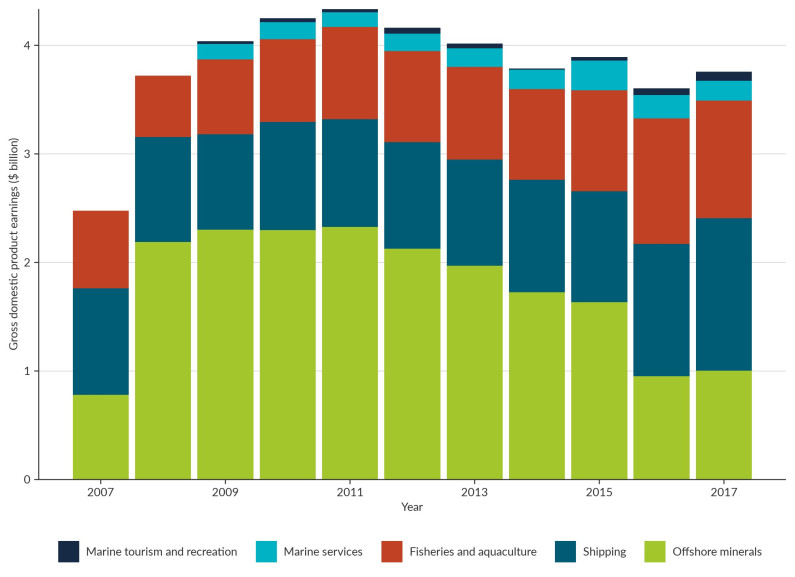
Image: Stats NZ (Data source)

Image: Stats NZ (Data source)
See accessible version of Figure 8 on StatsNZ website
Commercial fishing has become more industrialised. Fishing vessels are now larger and more powerful than when trawling began more than 100 years ago – this change is occurring worldwide. A small number of vessels today can have the same impact as a larger fleet would have had in previous decades (See Environment Aotearoa 2019).
In many parts of New Zealand, an increasing population and demand for new houses close to the sea is driving coastal development and encroachment of coastal habitat. Structures like seawalls and groynes are built to protect property and infrastructure from storms and waves (Brake and Peart, 2013). Ultimately, this results in an increased area of hard surfaces.
Fishing changes the population structure of a species as well as reducing the overall number of fish. Fishing changes behaviour, leads to different size or sex ratios, and can affect population genetics (See Environment Aotearoa 2019). Population changes can have cascading effects through the food web by affecting the dynamics of predation, food availability, and competition for food and habitat.
The way we fish matters too. Seabed trawling and dredging alter the structure of the seabed, damage habitats, and re-suspend sediment. Some ecosystems show few signs of recovery and may remain damaged for long periods of time after the activities stop (Clark et al, 2019). For example, reef-forming bryozoans are found in areas of our continental shelf where fishing occurs. Bryozoans are fragile and activities like dredging and bottom trawling have caused loss of bryozoan habitat in some areas. Benthic fishing is a significant threat to bryozoans, especially where fishing activity is high (Anderson et al, 2019).
Shipping and boat traffic have direct and indirect effects on the marine environment. Indirect effects include shipping-related activities such as development of supporting coastal infrastructure that is associated with impacts from dredging, and construction of piers and other hard structures (GESAMP 2001).
Most non-native, marine species in New Zealand arrived via visiting vessels. Increased shipping and boating enables them to spread more readily throughout the marine environment (Clarke Murray et al, 2011; Darling et al, 2012; Seebens et al, 2016).
Pollution, like oil spills and accidental cargo release from ships, also has environmental impacts. For example, the wrecking of MV Rena in 2011 released cargo, ship debris, and oil that covered seabirds and little blue penguins (Schiel et al, 2016). Shipping is also a significant source of noise pollution (Walker et al, 2018) and air pollution, with sulphur dioxide, nitrogen oxides, carbon monoxide, and particulate matter being released (see Our air 2018).
Hauraki Gulf is home to a small, semi-resident population of Bryde’s whales and has the highest number of reported sightings of the species in New Zealand. Bryde’s whale has a threatened – nationally critical conservation status.
The gulf is also a major shipping route for freight, cruises, and recreational boat traffic. Increased boat traffic is associated with an increased risk of collision with marine mammals (Behrens & Constantine, 2008).
Shipping can affect the whale’s communication (Putland et al, 2018). Vessel strike was identified as a major threat to the population (Baker et al, 2010; Constantine et al, 2015). Between 1996 and 2014, an average of two Bryde’s whales were killed per year as a result of vessel strike (Constantine et al, 2015). In recent years, fewer deaths have been reported after management measures, including reducing vessel speed, were introduced (Baker et al, 2019).
Physical changes to coastal habitats can affect local coastal water flow and wave action. This causes localised erosion and the deposit of sediments, and can alter the shape of beaches and estuaries (GESAMP, 2001; Larned et al, 2018). Changes to the coastline alter the way waves and sediment move and can result in intertidal habitats being lost (Gittman et al, 2016). Coastal environments will also be affected by sea-level rise (see issue 4).
Most of our activities in the marine environment tend to increase in intensity towards the coast and these pressures, on top of coastal development, result in coastal environments being most impacted. This is significant as shallower coastal environments hold the greatest diversity and turnover of species (Zintzen et al, 2017). Coastal development also affects the breeding habitats of birds and continues to put pressure on seabird and shorebird populations (see Our marine environment 2016).
Our reliance on the marine environment for food, tourism, transport, recreation, cultural activities, and to make a living, may be compromised if our activities continue to degrade marine ecosystems.
Our ability to fish and harvest seafood could be affected by the degradation of the marine environment and the impacts of climate change. In 2017, commercial fishing and aquaculture provided employment for more than 14,000 people and earned $2.0 billion in seafood exports, leading to a direct contribution to GDP from this sector of $1.1 billion (0.4 percent) (Stats NZ, 2019b). About 700,000 people in New Zealand fish in the sea every year and recreational fishing also contributes to economic activity (Holdsworth et al, 2016).
The activities that generate this significant revenue also put pressure on the marine environment. The cost of their impacts is not accounted for, which makes it difficult to weigh up the true cost and value of these activities. The decline of the endemic toheroa (New Zealand’s largest shellfish) at many New Zealand sites in the second half of last century was due to commercial and recreational harvesting in equal measure. Climate, disease, changes in land use, and driving on beaches have also contributed to toheroa populations failing to recover (Ross et al, 2018).
Changes in commercial and customary activities in the marine environment also damage connections between tangata whenua (local or indigenous people from the land) and the sea. A loss of biodiversity erodes mauri and restricts opportunities to express kaitiakitanga. Although kaitiakitanga is often used to mean guardianship, it can also mean conservation and protecting. Most importantly, it refers to active, collective, and knowledge-based decision-making that fits local conditions (Rout et al, 2018).
Damage to the marine environment transgresses the basic concepts of te ao Māori in ways that undermine cultural, community, and individual identity. The Māori customary knowledge that exists today is highly valued, and in some cases, is a direct result of a scarcity and loss of knowledge. Customary knowledge is considered taonga tuku iho (treasures handed down by the ancestors) (Forster, 2012).

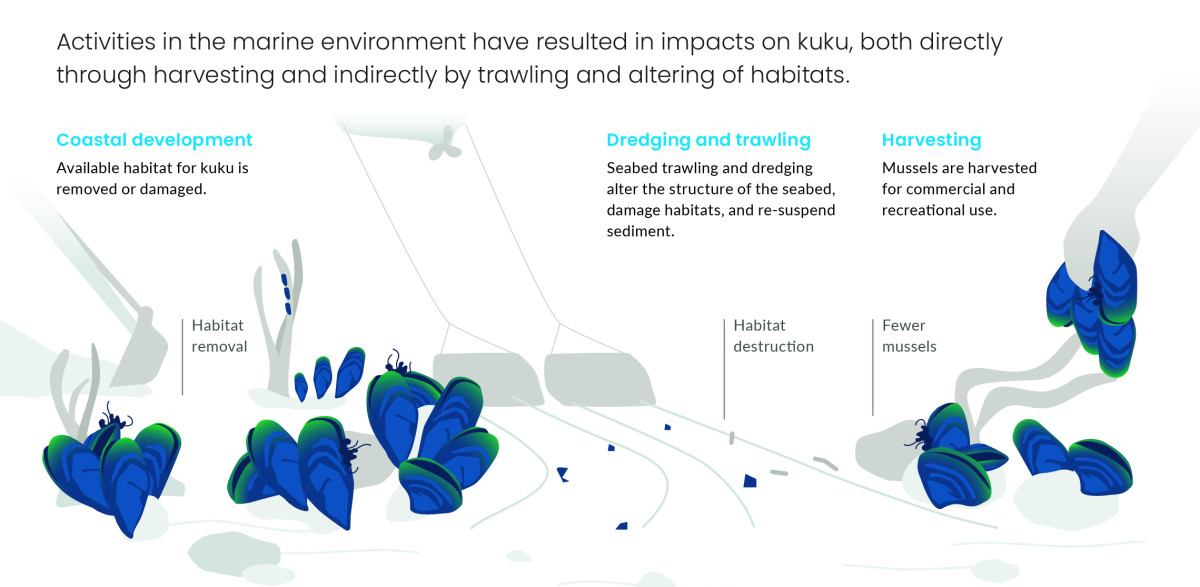
Read the long description for How marine-based pressures affect kuku
Activities in the marine environment have resulted in impacts on kuku, both directly through harvesting and indirectly by trawling and altering of habitats.
Coastal development - Available habitat for kuku is removed or damaged.
Dredging and trawling - Seabed trawling and dredging alter the structure of the seabed, damage habitats, and re-suspend sediment.
Harvesting - Mussels are harvested for commercial and recreational use.
Issue 3: Our activities at sea are affecting the marine environment
October 2019
© Ministry for the Environment