Issue 4: Climate change is affecting marine ecosystems, taonga species, and us

Climate change is already causing unprecedented and enduring change in our oceans. The consequences of climate change on the marine environment are not fully understood. For example, we benefit from the role oceans have in regulating our climate and storing carbon but these benefits may be compromised by climate change.

Image: T Whittaker
Report focus: sea-surface temperatures, marine heatwaves, sea-level rise, extreme wave events, ocean acidification, and primary productivity.
Marine species and people experience the effects of climate change across New Zealand, but effects vary by region.
Some changes are not well understood. Others show unprecedented rates of change and differ significantly from pre-industrial conditions.
Many impacts are irreversible on a human timescale.
Our culture, environment, and economy are already being affected. We can expect these effects to continue.
Satellite monitoring for coastal sea-surface temperatures, and coastal primary productivity.
Updated data on relative sea-level rise, coastal and ocean acidification, ocean primary productivity, and extreme waves.
Measurements of the sea-surface temperatures in New Zealand’s coastal and ocean areas have been recorded by satellite from 1981 to 2018. This data provides a comprehensive record of change.
On average, coastal waters have warmed by 0.2 degrees Celsius per decade. Also, there are now more years when the average temperature of the sea around New Zealand was greater than the long-term average temperature (see annual deviation from average temperature 1981–2018) (figure 9). Ocean waters throughout our EEZ showed significant warming between 1981 and 2018 (see indicator: Sea-surface temperature).
The rate of warming varies but higher rates have been observed off the South Island’s west coast between 2002 and 2018 (Chiswell & Grant, 2018) and east of the Wairarapa coast since 1981 (Sutton & Bowen, 2019).
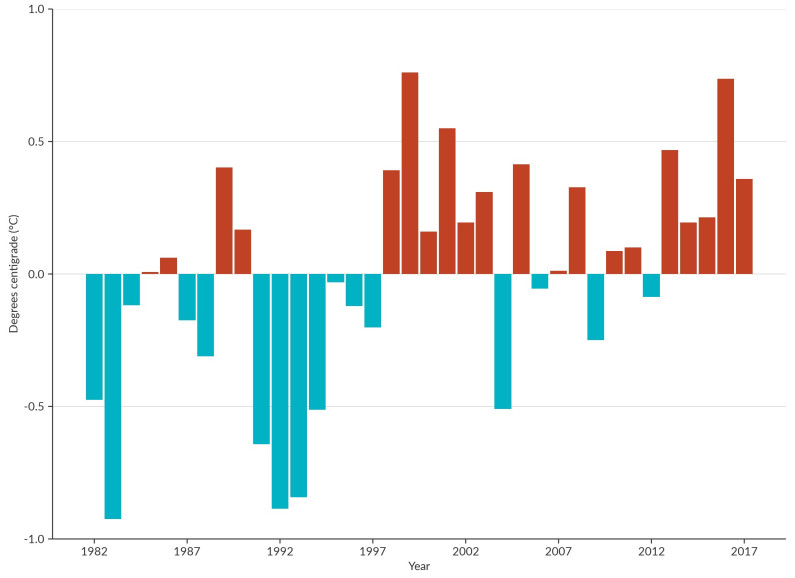
Image: NIWA (Data source)
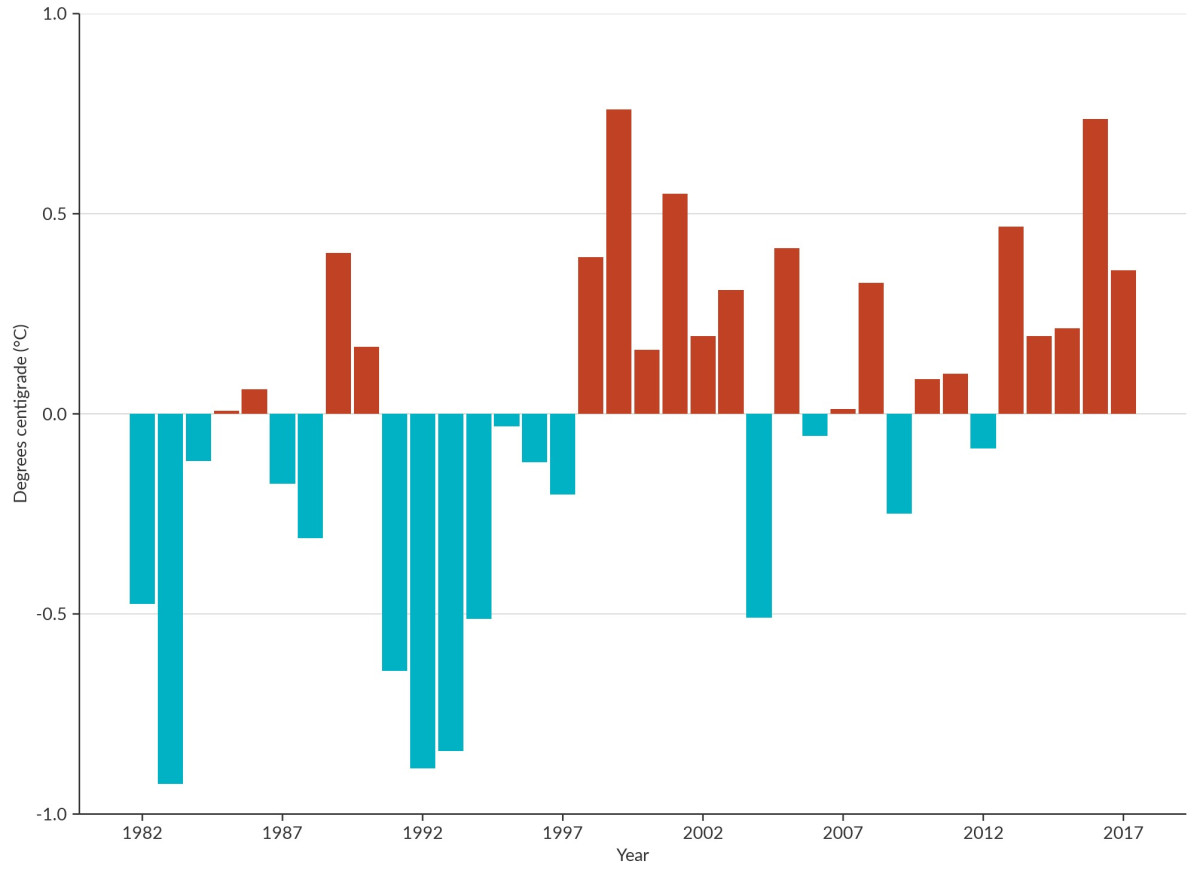
Image: NIWA (Data source)
See accessible version of Figure 9 on StatsNZ website
Not only are average temperatures increasing, but marine heatwaves are becoming more frequent because of human-induced warming. Marine heatwaves are periods of extremely high sea-surface temperatures that last for days to months and occur in areas of up to thousands of kilometres (Frölicher et al, 2018).
A marine heatwave occurred in the Tasman Sea and south of the Chatham Rise from November 2017 to February 2018 during New Zealand’s hottest summer on record (Pinkerton et al, 2019). Short-term changes in sea-surface temperature occur naturally, but this event was unprecedented (based on the satellite data recorded since 1981) (see indicator: Sea-surface temperature).
Sea-surface warming trends in New Zealand were consistent with global averages between 1981 and 2015 (Pinkerton et al, 2019).
Climate projections suggest that sea-surface temperatures will increase 0.8–2.5 degrees Celsius by 2100 (Law et al, 2018a). The ocean has an important role in removing carbon dioxide from the atmosphere, but as oceans warm, they lose their capacity to absorb as much carbon dioxide, which may result in further increases in atmospheric carbon dioxide concentrations.
Coastal sea levels are rising as ice melts, and because water expands when it warms (see Our marine environment 2016).
The mean sea-level has increased relative to the baseline (figure 10). The 1986–2005 baseline is used by the Intergovernmental Panel on Climate Change (IPCC) as a reference period to compare future change against. It is long enough to cover the range of tidal combinations and longer-term climate variability. New Zealand’s mean relative sea-level has risen by 1.81 (±0.05) millimetres per year on average since records began. The national mean and trends in annual sea-level rise are based on four long-term monitoring sites (Auckland, Wellington, Lyttelton, and Dunedin). Regional measurements show consistent patterns but the increasing trend is most pronounced in Wellington due partly to land subsidence as well as rising seas (see indicator: Coastal sea-level rise).
Relative sea-level rise is a measure of the absolute change in sea level combined with local uplift, subsidence, or vertical land movement caused by tectonic activity. This measure is more useful for understanding local and regional implications than the absolute change in sea level (which does not account for land movement).
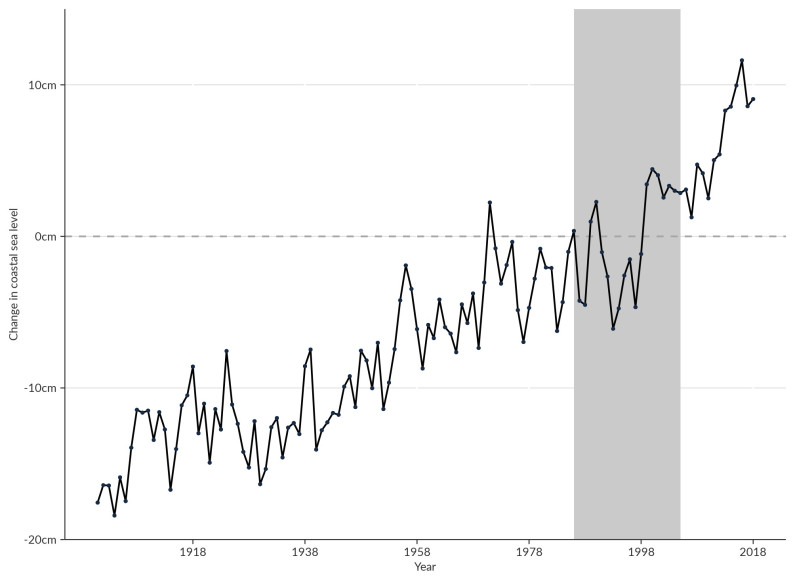
Image: NIWA (Data source)
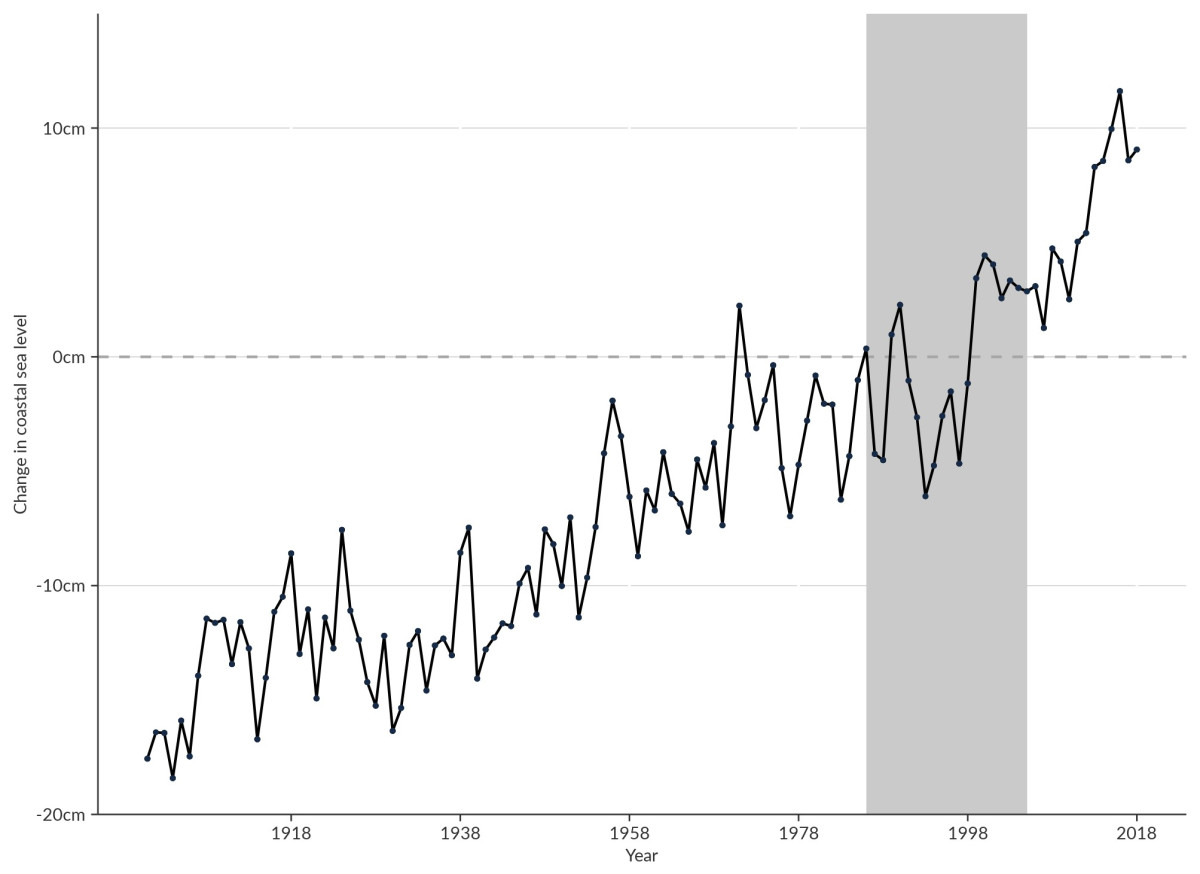
Image: NIWA (Data source)
See accessible version of Figure 10 on StatsNZ website
Not only are sea levels rising, but they are rising faster than before. Between 1961 and 2018, the average rate of sea-level rise across 4 long-term monitoring sites was 2.44 (±0.10) millimetres per year. This is twice the average rate that occurred between the start of New Zealand records and 1960 (1.22 (±0.12) millimetres per year).
In addition, trend calculations that incorporate data from 2016 to 2018 show even faster rates of relative sea-level rise than those reported in Our marine environment 2016. This indicates an increased rate in relative sea-level rise, but it is too early to separate this trend from shorter-term oceanic cycles (Bell & Hannah, 2019) (see indicator: Coastal sea-level rise).
Global satellite data has recorded a rise in global mean sea level of more than 7 centimetres in the last 25 years. Global sea-level estimates may also indicate an acceleration in sea-level rise (Dangendorf et al, 2019).
Climate projections suggest that on average globally, we can expect a rise of 0.2–0.4 metres by 2060 and 0.3–1.0 metres by 2100, depending on global greenhouse gas emissions (Climate Change Adaptation Technical Working Group, 2017).
Changes in ocean wave patterns are occurring, and these affect our coastal environment. Extreme wave events can disturb marine ecosystems and affect coastal infrastructure, ocean-based industries, and other human activities (see Our marine environment 2016). An extreme wave event is defined as a continuous 12-hour period when the wave height equals or exceeds 1 of 3 thresholds: 4, 6, or 8 metres (see indicator: Oceanic and coastal extreme waves for more detailed definitions).
In 2017, 17 extreme wave events exceeded the 8-metre threshold in coastal regions – 15 of these were around the South Island. In oceanic regions in the same year, 16 extreme wave events exceeded the 8-metre threshold.
Preliminary trends indicate the frequency of extreme wave events is increasing to the east and south of New Zealand, and decreasing on the North Island’s west coast and to the north of the Bay of Plenty (figure 11). The short time period for which data is available makes it too early to definitively separate this trend from longer-term climate cycles, such as the Interdecadal Pacific Oscillation (see indicator: Oceanic and coastal extreme waves).
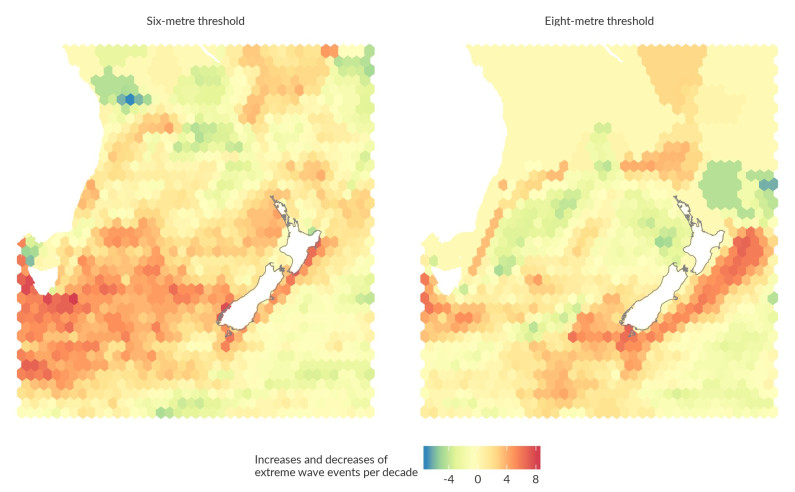
Image: NIWA (Data source)

Image: NIWA (Data source)
See accessible version of Figure 11 on StatsNZ website
Oceans absorbed about 30 percent of global human-emitted carbon dioxide between 1994 and 2007 (Gruber et al, 2019). When carbon dioxide from the atmosphere is absorbed by seawater, chemical reactions occur, producing hydrogen ions that acidify the water and decrease seawater pH. This is called ocean acidification.
Subantarctic waters off the coast of Otago show an increase in acidity of 7.1 percent in the past 20 years (figure 12). This the longest-standing ocean acidification record in the southern hemisphere and is based on samples taken from the Munida Transect.
Very small changes in pH represent substantial differences in acidity: pH 4 is 10 times more acidic than pH 5 and 100 times more acidic than pH 6.
A new dataset for coastal water pH is used in this report, using the same method for nine sites across New Zealand. Fresh and coastal waters tend to be more naturally acidic than open ocean water. The highest acidity was observed at the Auckland monitoring site (Chelsea Point). More data is needed before the role of climate change can be separated from other factors that may be affecting the acidity of coastal waters (see indicator: Ocean acidification).
Since the beginning of the industrial era, the pH of ocean surface water has decreased by 0.1 pH units, which represents a 26 percent increase in acidity (IPCC, 2013).
Climate projections suggest the pH of waters around New Zealand will decrease by 0.3 to 0.4 pH units by the end of this century (Orr et al, 2005). Oceans will continue to become more acidic as they absorb more carbon dioxide, and reversing this profound change will take tens of thousands of years (IPCC, 2014).
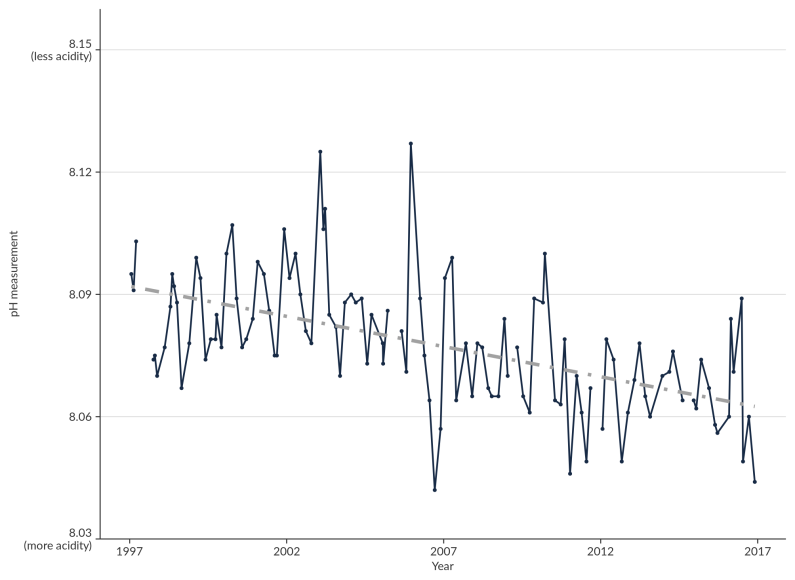
Image: Data source - NIWA, (Kim Currie)
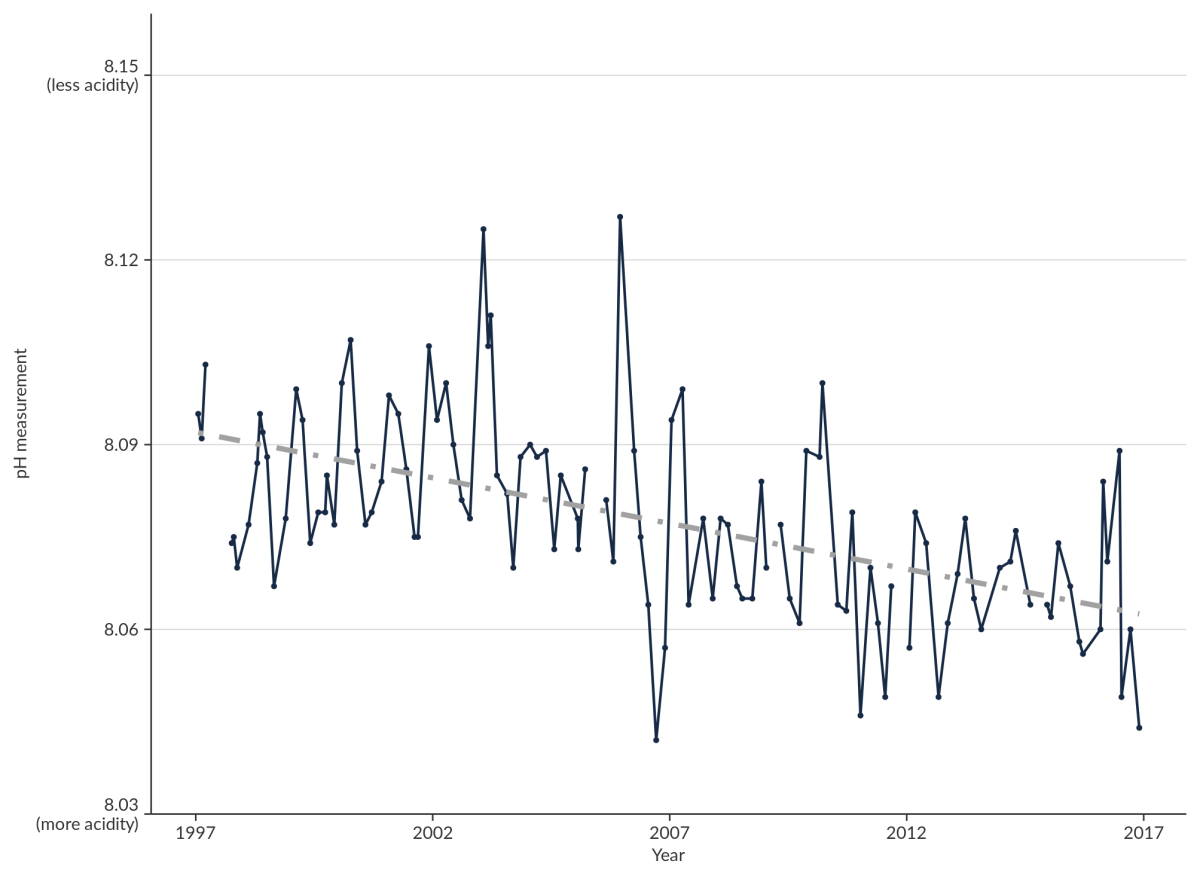
Image: Data source - NIWA, (Kim Currie)
See accessible version of Figure 12 on StatsNZ website
Phytoplankton abundance indicates ocean primary productivity at broad scales. Primary productivity is the creation of energy by living organisms, and it provides the energy that supports most marine food webs. Satellite data is used to measure the abundance of phytoplankton in the surface waters.
The abundance of phytoplankton has increased and decreased in different New Zealand waters in the past 20 years (see indicator: Primary productivity). Offshore ocean phytoplankton abundance has:
In inshore waters (territorial sea), patterns of coastal phytoplankton abundance are affected by climate variation and changes to land use (for example, the levels of nutrients in rivers). Decreasing phytoplankton abundance was observed around:
Increasing phytoplankton abundance was observed:
The power to determine whether these trends are statistically significant is limited by the length of the dataset. The consequences of changing oceanic productivity is specific to the location in which it occurs; an increase or decrease in one area may not have the same impacts as the same increase or decrease in another area. Net primary production is projected to decrease globally. Primary production in New Zealand is projected to follow these patterns but in a less pronounced way (see indicator: Primary productivity) (Law et al, 2018a).
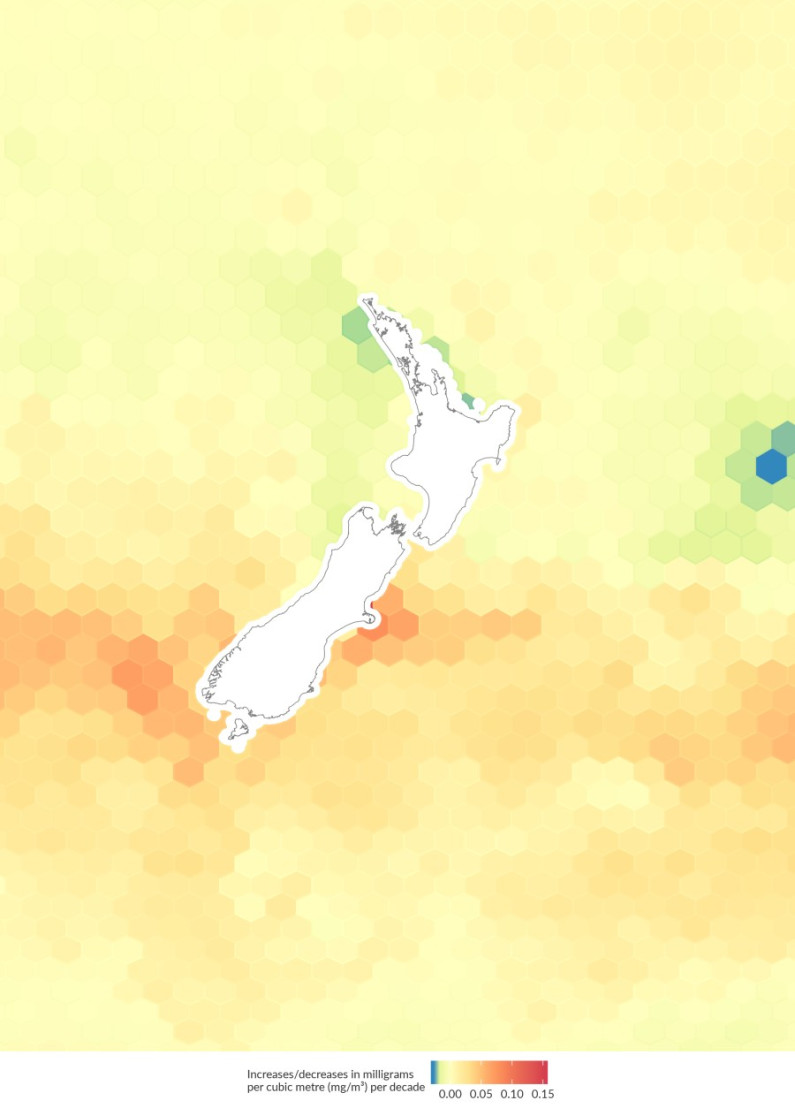
Image: NIWA (Data source)
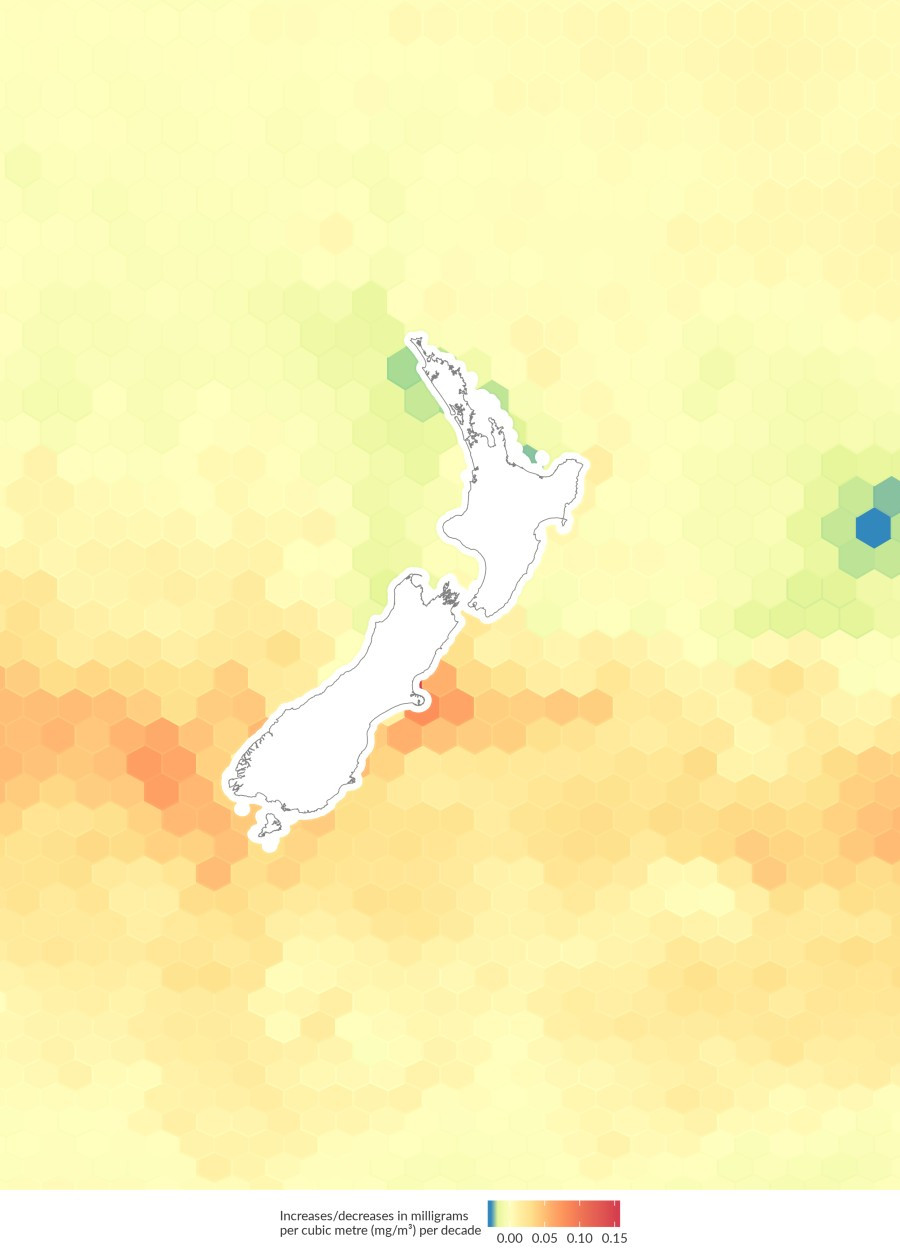
Image: NIWA (Data source)
Changes in the ocean are hard to track because of the high natural variation and long-term cycles in the marine environment. Long-term time series and observations are needed to be able to separate signals from climate change from natural variations.
Natural variations include:
Atmospheric greenhouse gas concentrations are increasing because of activities like burning fossil fuels for heat, transport, and electricity generation. Globally, the rate of emissions is increasing (Ministry for the Environment, 2018). This rise in atmospheric carbon dioxide has caused the observed changes in ocean acidity (Law et al, 2018a).
New Zealand’s greenhouse gas emissions are high per capita but contribute a small proportion to the total global emissions. The sources of our greenhouse emissions and changes over time were reported in Environment Aotearoa 2019 and Our atmosphere and climate 2017. Agricultural industries make the highest contribution (49.7 percent) to New Zealand’s total emissions, but household emissions increased 19.3 percent between 2007 and 2017 (Stats NZ, 2019a).
Oceans play an important role in regulating Earth’s climate and help mitigate the consequences of global emissions. The Southern Ocean and the tropics both take up more human-emitted carbon than any other ocean region (Mikaloff Fletcher et al, 2006).
New Zealand’s oceans may take up more carbon dioxide than our forests (MacDiarmid et al, 2013). Coastal marine habitats including mangroves, sea-grass meadows, and kelp forests also capture and store carbon. As sea temperatures increase, gases like carbon dioxide dissolve in the ocean less easily. This will reduce the oceans ability to take up carbon dioxide – estimates are for a 9–15 percent reduction by 2100 (Riebesell et al, 2009; Wang et al, 2014). An increase in stratification, or layering, will further reduce the ability of the ocean to take up carbon dioxide (Riebesell et al, 2009).
Warmer sea-surface temperatures affect phytoplankton abundance and therefore primary production of oceans. Near-surface stratification is a natural phenomenon, but ocean warming from climate change is expected to strengthen this effect (Capotondi et al, 2012). Stratification may reduce the supply of nutrients needed for phytoplankton growth in subtropical waters in the northern parts of New Zealand. The effect may be smaller in the south, where primary production is more limited by other factors such as light intensity (Pinkerton et al, 2019).
Changes to primary productivity have implications for the whole food web, including fish species and top predators like seabirds, marine mammals, and commercially valuable fish. Increasing abundances of phytoplankton in parts of the Chatham Rise may be positive for fisheries in this region (Pinkerton et al, 2019). Increased primary productivity can also have negative impacts on fisheries when phytoplankton blooms die off, potentially causing oxygen depletion in the water column (Morrison et al, 2009).
New species are being observed in our waters as climate change brings warmer water inshore. Gambierdiscus, the small plankton responsible for ciguatera fish poisoning, was recently observed for the first time in the subtropical northern region of New Zealand (Rhodes et al, 2017). Eating fish contaminated by this toxin triggers neurological, gastrointestinal, and cardiovascular symptoms (Armstrong et al, 2016).
Marine heatwaves can reduce the range of some species or cause others to disappear locally. During the 2017/18 marine heatwaves in the South Island, bull kelp suffered losses in Kaikōura and was completely lost from some reefs in Lyttelton (Thomsen et al, 2019). Following these losses, the empty spaces were rapidly colonised by Undaria, an introduced non-native species (Thomsen et al, 2019). Bull kelp acts as a carbon sink, dampens the effects of waves on the coastline, and provides structure and shelter for many species.
Warming waters in summer are already affecting fish. The reproduction of some fish species (like snapper and hoki) appears to be affected by sea-surface temperature. Warming and other changes to the marine environment could affect other species, and increases and decreases in stocks are possible (Ministry for Primary Industries, 2017).
Past approaches to fisheries management and catch levels may no longer work for some species and stocks. As coastal and ocean temperatures increase, wild fisheries can expect to see greater numbers, dominance, and distribution of warmer water species. Temperature-sensitive species may move south to cooler waters (Law et al, 2018a). In aquaculture, heatwaves can lead to increased mortality and an associated loss of revenue (New Zealand King Salmon, 2018; Sanford Limited, 2018).
Increased erosion and wave exposure associated with sea-level rise can impact seaweeds and animals living on exposed rocky reefs. Seaweeds may be particularly vulnerable to increased movement of sediment and reduced light levels. Local losses of large seaweeds can reduce protection from flow and reduce settlement of young seaweeds (Willis et al, 2007). Large wave forces can break or remove mussels, resulting in death if they cannot reattach. Mussel beds that are already thinned or less tightly packed are even more vulnerable (Hunt & Scheibling, 2001).
The western United States provides an example of increased ocean acidity with a natural upwelling of cold, nutrient-dense water. The incident shows what could happen as New Zealand waters increase in acidity. This observation found that periods of increased acidity limited the growth of carbonate shells in settling oyster larvae, and caused high mortalities (Clements & Chopin, 2017). Although this upwelling does not occur in New Zealand to the same extent, the acidity observed could happen here under current projections.
In 2017, the aquaculture industry’s estimated total revenue was $557 million, with 62 percent of this from mussels (Aquaculture New Zealand, 2018). Pāua, cockles, kuku, and kina are taonga species with carbonate shells that are valued for recreational and cultural reasons. All are vulnerable to increased ocean acidity.
Previous environmental reports noted gaps in our knowledge about the impacts of ocean acidification on organisms. Recent research has focused on New Zealand species and is helping to define the risks, and shows that sensitivity to higher acidity varies between species (Law et al, 2018b).
Some recent research is summarised below:
Our understanding of the indirect effects of ocean acidification, for example on primary production and food webs, remains limited.
Māori marine knowledge and practices that are passed from one generation to the next, are unique to Aotearoa New Zealand. They are deeply ingrained in our identity as a people and as a country. These long histories in kaitiakitanga may help us recognise the impacts of long-term environmental changes, although climate change may be creating a situation with no precedent.
Some traditional Māori tohu or marine indicators can no longer be used in the same way. Māori scientific knowledge is based on observation and is evolving in response to current changing seasonal patterns. This includes observations of seasonal change used to indicate harvest periods. For example, traditionally when pōhutukawa bloomed, it was time to harvest kina. Today, the reproductive period of kina occurs at a different time due to changes in sea temperatures. Kaitiakitanga and traditional management methods and commercial practices are changing because of the different environmental conditions.
Rising sea levels and extreme wave events are affecting some coastal communities, infrastructure (bridges, road, and rail), environments, and biodiversity. It is very likely that increases in sea level will result in more frequent and extreme coastal flooding by 2050 and cause the loss of habitat in coastal regions (Ministry for the Environment, 2017).
If sea level rises by 1.5 metres, as is projected to occur by 2100, more than 6,000 kilometres of drinking water, wastewater and stormwater pipes and 2,000 kilometres of roads are at risk (Simonson & Hall, 2019). The total replacement value of all of New Zealand’s potentially affected buildings could exceed $19 billion (data for the West Coast, Southland, Taranaki, Manawatu-Wanganui, and Marlborough was not included). The costs could be even higher if sea levels exceed these projections (Bell et al, 2015).
Our recreation and heritage could also be affected. A recent report estimated that 331 Department of Conservation assets (2 percent) and 119 visitor sites are potentially at risk from coastal inundation due to sea-level rise. Similarly 4,149 New Zealand Archaeological Association archaeological sites (6 percent) are considered to be at risk (Tait, 2019). Many coastal iwi and hapū have marae and other sites (like urupā) in vulnerable areas, which are important to their identity and the wellbeing of their people (see Environment Aotearoa 2019). More than half of Māori assets are in industries, including fishing, that are vulnerable to climate change impacts (Jones, 2013).
The infographic below shows the ways that warming oceans, increasing ocean acidity, and increasing storm frequency and intensity affect kuku – the green-lipped mussel.

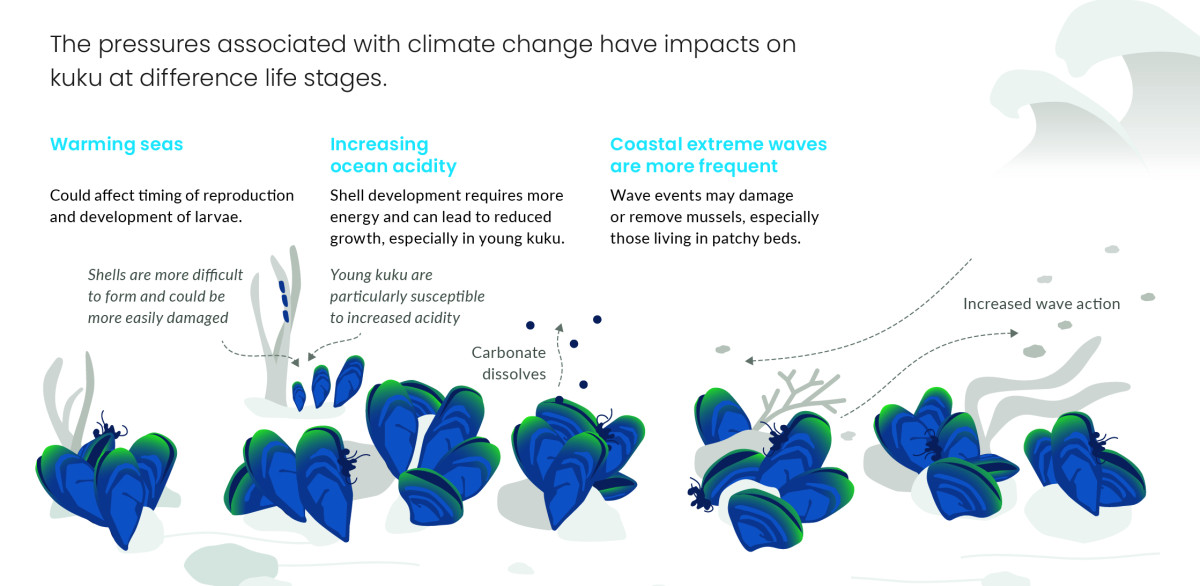
Read the long description for How climate change pressures affect kuku
The pressures associated with climate change have impacts on kuku at difference life stages.
Warming seas - Could affect timing of reproduction and development of larvae.
Increasing ocean acidity - Shell development requires more energy and can lead to reduced growth, especially in young kuku.
Coastal extreme waves are more frequent - Wave events may damage or remove mussels, especially those living in patchy beds.
Issue 4: Climate change is affecting marine ecosystems, taonga species, and us
October 2019
© Ministry for the Environment