Issue 2: Our activities on land are polluting our marine environment

Our everyday activities in cities and towns, and our use of rural areas, have altered the state of many of our coastal ecosystems.
Coasts and oceans also receive and process pollutants from the land. Most of the changes that have compromised the ecological health of coasts and estuaries occurred after European settlement. Our connection to the marine environment through mahinga kai and recreation has also been affected.

Image: Rob Suisted, Naturespic
Report focus: coastal water quality, sediment accumulation, emerging contaminants, plastics.
It affects most of our coastal waters. Pollutants are found in marine environments from estuaries to deep ocean trenches.
The concentration of pollutants is variable and some are much higher than in natural conditions. New contaminants are being discovered and their effects are unknown.
Remediating marine pollution is challenging and costly because it occurs widely over a long time, is difficult to get to, and has legacy effects.
Cultural connections with the environment are undermined, and human health and recreation are affected.
Beach litter data collected using citizen science. Broadened body of evidence for water quality and sediment.
Human settlement (and European settlement in particular) has brought large shifts in the nature of sediments in most coastal environments. These include changes in the rate of accumulation, increase in muddiness, and the type and amount of contaminants that are bound to sediments (Robertson & Stevens, 2015). Sediment accumulation is variable (see box below High natural variations complicate assessments). In this section, we focus on accumulation rate.
Sediment accumulation in estuaries is increasing in many parts of New Zealand but the accumulation rates are highly variable. The proposed guidelines for The Australia and New Zealand Guidelines for Fresh and Marine Water Quality (previously known as ANZECC) regard the health of estuaries as being affected when sedimentation rates exceed natural rates by two millimetres per year in an estuary or part of an estuary (Townsend & Lohrer, 2015). The effort required to achieve this guideline and keep our estuaries healthy will vary throughout New Zealand.
In the Pauatahanui and Onepoto arms of Te Awarua-o-Porirua Harbour, the average sedimentation rates were 9.1 millimetres per year and 5.7 millimetres per year respectively for the 35 years from 1974 to 2009 (Gibb & Cox, 2009). The largest proportion of sediment in the harbour came from pasture, followed by earthworks. Earthworks accounted for 24 percent of all sediment from the Te Awarua-o-Porirua Harbour catchment, despite accounting for just 1 percent of the land area (Greater Wellington Regional Council et al, 2015). Sediment accumulation rates across Waikato estuaries have become unstable (see Sediment accumulation rates in Waikato).
Rain and wind move soils and other material from land to the sea. The rate of this movement depends on factors in the catchment like the slope, underlying rock and soil type, vegetation, and volume and intensity of rainfall. When the amount of material (sediment) arriving in the marine environment is greater than its ecosystems can process, sediment becomes a pollutant.
Once in the sea, how sediment moves and settles is determined by waves and tides. Waves can erode and prevent sedimentation, and tidal flows can redistribute sediment (Hunt, 2016). These local factors make it difficult to compare sediment accumulation rates between regions or locations without long-term monitoring.
The water quality variables commonly used to assess ecological health are nutrients (phosphorus and nitrogen), phytoplankton, oxygen, water clarity, and pH. Faecal bacteria, an indicator of the presence of pathogens, is used to assess water quality for human health.
It is difficult to assess the overall state of coastal water quality as the state is defined by the combination of different variables, and the natural capacity to process pollutants differs between places. This means for many variables there are no national guidelines that would allow for consistent assessment of the state of a particular coastal water body or the coastal waters of New Zealand overall.
Coastal water quality around Aotearoa New Zealand is variable, as shown by median concentrations and changes over time (trends) for all monitored sites (see figure 5 and indicator: Coastal and estuarine water quality). It is difficult to measure the ecological importance of these trends for organisms without established thresholds for ecosystem health. However, further context is provided below for chlorophyll-a, dissolved oxygen, and the presence of enterococci.
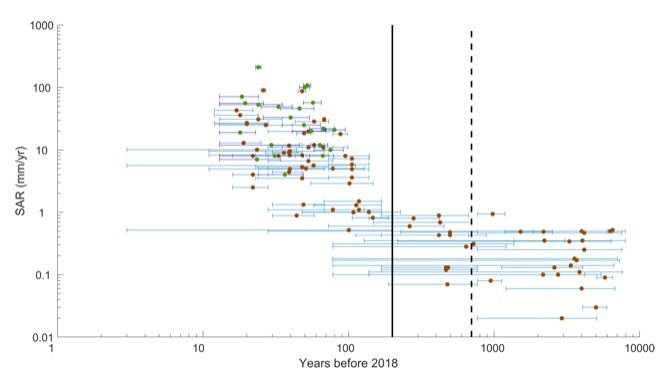
To find out how sediment accumulation rates have changed in Waikato, 61 sediment cores were taken from the intertidal areas of 7 estuaries – the cores tracked sedimentation back to 10,000 years ago.
Before the arrival of Europeans, intertidal sediment accumulation rates were 0.02–0.5 millimetres per year. In the last 100 years, sedimentation rates in Waikato have become unstable, reaching almost 200 times those of the previous 10,000 years (see figure 4) (Hunt, 2019).
Changes in the sedimentation rate corresponded with changes in the types of pollen found in sediment cores. This shows widespread changes in the vegetation in catchments.
There is high variation between estuaries. For example, compared to sedimentation rates before mid-1800s, sedimentation in the southern Firth has been increasing at rates higher than many other North Island estuaries, sometimes up to 10 times higher (Swales et al, 2016).
The sampled estuaries were in Raglan (Whaingaroa Harbour), Coromandel (Whangapoua, Whitianga, Wharekawa, Whangamata, and Coromandel harbours) and the Firth of Thames.


See accessible version of this graph on StatsNZ website
Chlorophyll-a can be used as an indicator of coastal ecosystem health and is a proxy for the amount of phytoplankton present. Trends in chlorophyll-a concentrations are shown in Figure 6. Chlorophyll-a is sensitive to nutrient and sediment inputs. High pollution loads can lead to eutrophication: an overload of nutrients that can cause algal blooms, depleted oxygen levels, and subsequent harmful effects on marine life. At 84 percent of all monitored sites across New Zealand, the median concentration of chlorophyll-a was less than 0.003 mg/L (see indicator: Coastal and estuarine water quality). At these low concentrations, the effects of pollution are considered to be minimal and ecological communities are healthy and resilient (Robertson et al, 2016).
Dissolved oxygen is essential for aquatic organisms and is an indicator of ecosystem health. At all but one monitored site, the median, dissolved oxygen concentration from 1973 to 2018 (the time period varied between sites) was greater than 6 mg/L. Long-term thresholds for oxygen concentration have not been defined. In the shorter term (weekly), mean concentrations below 6 mg/L are known to cause stress in estuarine organisms (Robertson et al, 2016).
The presence of a faecal indicator organism, enterococci, is most commonly used to assess whether coastal waters are safe for recreation. The median concentrations at monitored sites ranged from 0.85 to 210 enterococci per 100 millilitres (see indicator: Coastal and estuarine water quality). Frequent sampling for enterococci helps to assess whether coastal waters are safe for recreation: regional councils monitor popular coastal beaches over summer to manage this health risk. Under the New Zealand microbial water quality guidelines, caution is advised if a single coastal water sample has more than 140 enterococci per 100 millilitres. A second consecutive exceedance triggers a management action or red mode. The Land, Air, Water Aotearoa (LAWA) website has the most up-to-date information on local water quality.
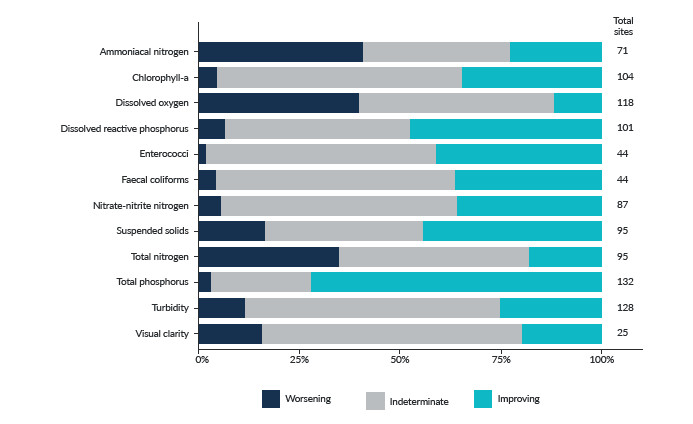
Trends in coastal and estuarine water quality between 2008 and 2017 are shown in figure 5. For 9 out of 12 variables, more sites had an improving trend than those that were worsening (figure 5). Particularly notable is that 72 percent of sites showed an improving trend for total phosphorus. This may reflect the improvements observed in river phosphorus levels (see indicator: River water quality: phosphorus). More sites showed worsening trends for total nitrogen (35 percent), ammoniacal nitrogen (41 percent), and dissolved oxygen (40 percent). Across the 12 variables, the trend was stated as indeterminate at 25 to 64 percent of sites.
Reasons for these trends are not clear. Factors that may affect these trends include the complexity of the coastal environment, limited data, and insufficient information about freshwater inputs (especially nutrient and sediment loads).
Coastal sites with large river inflows had the highest nitrogen concentrations and high levels of faecal bacteria – these areas are particularly affected by pollutants from land-based activities (Dudley et al, 2017). Deep estuaries and open coast sites had the best water quality. This may be due to mixing with ocean water where dilution makes them less susceptible to the adverse effects of pollutants (Larned et al, 2018). The effects of natural climatic variations compared with the effects of human activities on coastal water quality are also poorly understood.

Plastic debris is now found throughout the ocean, including the bottom of the Mariana Trench (Chiba et al, 2018). Sources of marine plastic are waste from industry and landfills and the waste we throw away. Over time, plastic debris is broken down into smaller and smaller pieces.
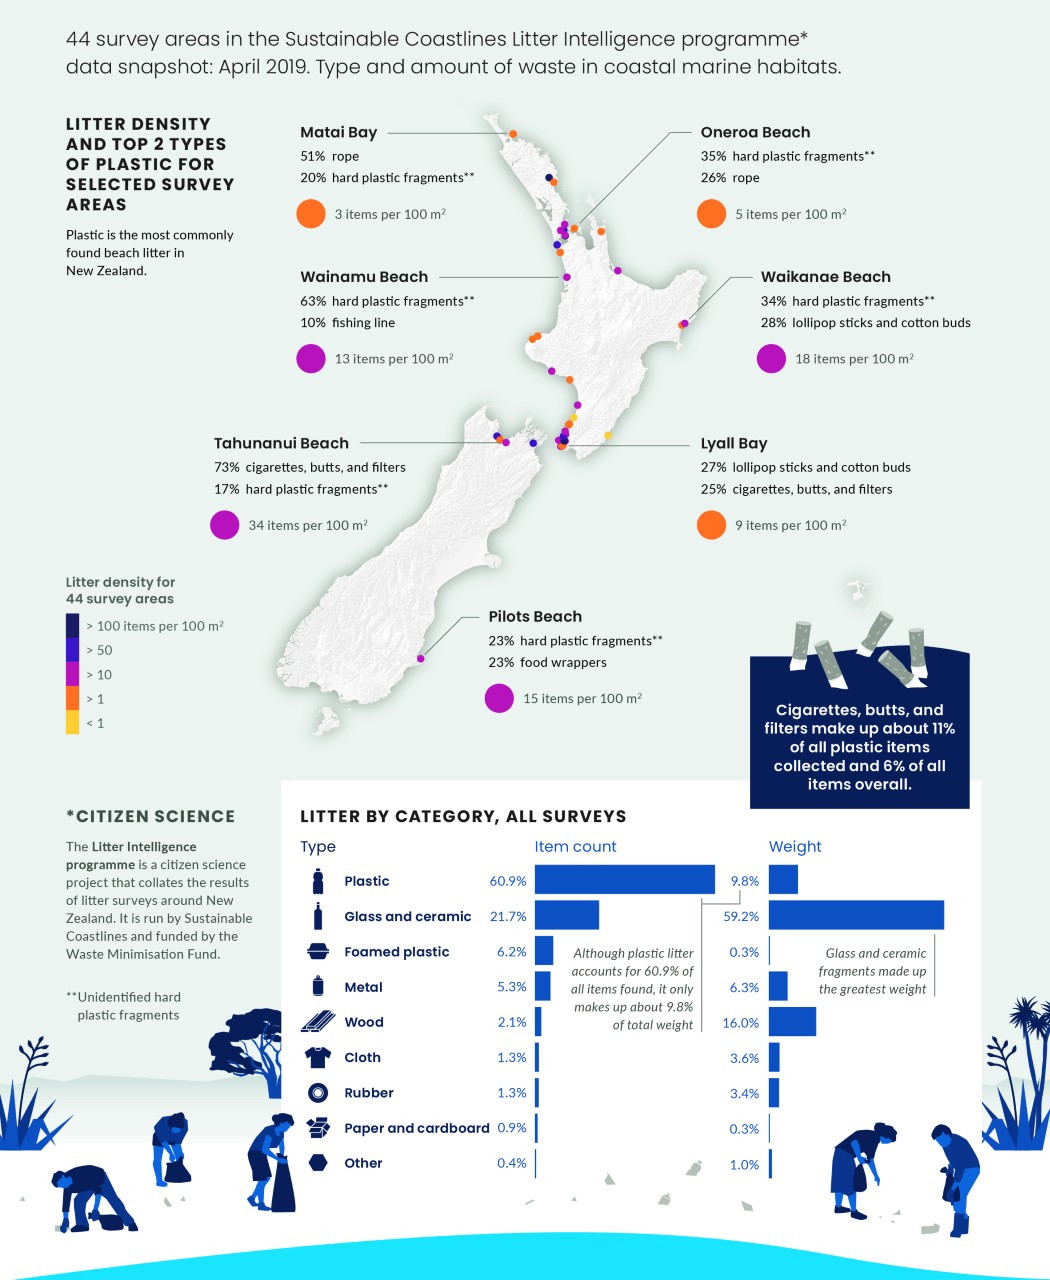
Plastic pellets have been recorded on New Zealand beaches since 1972 (Gregory, 1978). Plastic is the most common type of litter on our beaches. At six out of seven selected survey areas, hard plastics were in the top two types of plastic litter by item count (see Litter on our beaches infographic below).
Plastics are found throughout the food web. In New Zealand, plastics have been reported in fish, shellfish, and seabirds (Forrest & Hindell, 2018; Markic et al, 2018). Plastic was found in the stomachs of New Zealand prions as early as 1960. A global review of published diet data for 135 seabird species between 1962 and 2012 found 59 percent of species had eaten plastic. Furthermore, an increasing proportion of individuals had eaten plastic over time. A strong relationship between eating plastic and exposure to it was observed, indicating the potential for greater numbers of seabirds to eat plastic if its concentrations in oceans continues to increase (Wilcox et al, 2015).

Read the long description for Our understanding of new contaminants is improving
44 survey areas in the Sustainable Coastlines Litter Intelligence Programme* data snapshot: April 2019. Type and amount of waste in coastal marine habitats.
Plastic is the most commonly found beach litter in New Zealand.
Cigarettes, butts, and filters make up about 11% of all plastic items collected and 6% of all items overall.
*Citizen science
The Litter intelligence programme is a citizen science project that collates the results of litter surveys around New Zealand. It is run by Sustainable Coastlines and funded by the Waste Minimisation Fund.
**Unidentified hard plastic fragments
Type: item count, weight
Although plastic litter accounts for 60.9% of all items found, it only makes up about 9.8% of total weight.
Glass and ceramic fragments made up the greatest weight.
Rainwater can pick up contaminants as it passes over roads, moves through drains, and enters the wastewater network. Although our understanding of the adverse impacts and sources of various contaminants is improving, many contaminants are persistent in the environment and managing them can be problematic. The contaminants can be natural or human-made and include pharmaceuticals, personal care product additives, cleaning products, and industrial compounds (like flame retardants).
New Zealand does not have a national strategy for managing new or emerging contaminants, and monitoring is limited and inconsistent. Our understanding of the sources, ranges, and effects of pollutants on our marine environment and on people lags behind their introduction. This is the case in New Zealand and worldwide. Regional councils, however, are working together to develop appropriate monitoring systems.
Our activities on land – agriculture, forestry, transport, and the growth of cities and towns – create pollutants. More pollutants, like plastics and synthetic materials, are also being generated.
The amount and type of pollutants depends on the mix of land uses in a catchment as well as factors like the soil type, slope, climate, and how land is used and managed. Pollutant loads can be increased by land intensification (more livestock per hectare), creating more impenetrable surfaces (urban development), and by draining wetlands. Pollutant transport can be reduced by keeping livestock out of streams and by improving wastewater and stormwater treatment systems in urban areas.
The concentrations of nitrogen, phosphorus, fine sediment, and Escherichia coli (E. coli) in rivers increase as the area of farmland upstream increases (Larned et al, 2018). From 2013 to 2017, rivers with pastoral land cover had modelled E. coli levels that were 14.6 times higher than rivers with native land cover (see indicator: River water quality: Escherichia coli). Urban rivers can contain even higher levels of these contaminants: modelled levels of E. coli in urban rivers for 2013 to 2017 were up to 30 times higher than those with native land cover (see Environment Aotearoa 2019) (see indicator: Urban stream water quality). Urban waterways can also contain heavy metals.
Pollutants from land – such as sediments, nutrients, and chemicals – have known effects on marine species, but the scale at which these effects occur is not well understood (Larned et al, 2018; Morrison et al, 2009). Species in shallow estuaries are usually more vulnerable than those in open coastal environments (Dudley et al, 2017). The potential for harm also depends on a species’ behaviour (like feeding), habitat, and its proximity to human settlements. Broad-scale information about these impacts is not available but some local examples are presented below.
The scale of the effect that plastics have in the ocean is unknown. Much of it is microplastic (less than 5 millimetres in length).
When birds eat plastic, it can reduce their intake of nutrients, decrease reproduction, cause poisoning and internal and external wounds, and block their digestive tracts (Gregory, 2009; Wilcox et al, 2015). Fish can accumulate plastic by eating smaller fish or plankton that have ingested it (Boerger et al, 2010).
Plastics have been found in many other species and cause a variety of effects including:
Pollutants change the way we use our coastal environments for gathering kaimoana, fishing, and recreation. The presence of harmful bacteria closes beaches and reduces our enjoyment of them. We can become sick if we come into contact with contaminated seawater or kaimoana. Increased concentrations of toxins in shellfish have posed health risks for recreational harvests (Mackenzie, 2014; Malham et al, 2014). Degraded coastal environments disconnect us from these places and disempower people (Faulkner and Faulkner, 2017) (see Toxic sediment).
From a Māori perspective, sewage systems and food gathering should occur in completely separate domains. The increasing overlap of urban areas and places from where food is harvested results in a loss of integrity of mahinga kai. Interviews with kaumātua from Ngāti Awa revealed that tohu for pipi in the mouth of the Whakatāne River showed a decline in abundance and quality. Before effluent was discharged into the river, pipi had white shells and were a regular source of food. The first signs of decline in pipi mauri were the discolouration of the shells and reduced numbers. Pipi were then considered too polluted to eat (pers comms, K Paul-Burke, 2019).
Ahuriri Estuary/Te Whanganui a Orutū is a nationally significant estuary that is recognised for its wildlife and fish habitat (Hawke’s Bay Regional Council, 2012). It supported many settlements on the east coast of the North Island and was a coveted natural resource. The estuary has cultural significance for seven hapū and many people enjoy recreational activities in the area.
Industrial, urban, and rural land uses upstream have degraded the estuary and caused a disconnection of tangata whenua with the place. Even at levels within food safety limits, pollution is unacceptable to most of the Māori community who have placed an unofficial rāhui (restriction of access) upon the estuary. Such restrictions reduce social cohesiveness, customary practices, and language use. Other subtle impacts affect hapū, who have a sense of whakamā (shame and regret) that they have been unable to carry out their kaitiaki duties and protect this taonga. An inability to manaaki (host) manuhiri (guests) with food from Ahuriri estuary also brings whakamā.
Scientists (including those from Hawke’s Bay Regional Council) have been working with hapū to find out how contaminants are affecting Ahuriri estuary. Most sediment contaminants were associated with urban and industrial stormwater and some were above guideline threshold values (this included galaxolide, asynthetic musk found in cleaning and personal care products).
Evidence of acute toxicity was also found, as well as effects on the reproduction of copepods (a type of zooplankton). Copepods are a source of food for other marine species (Charry et al, 2018).

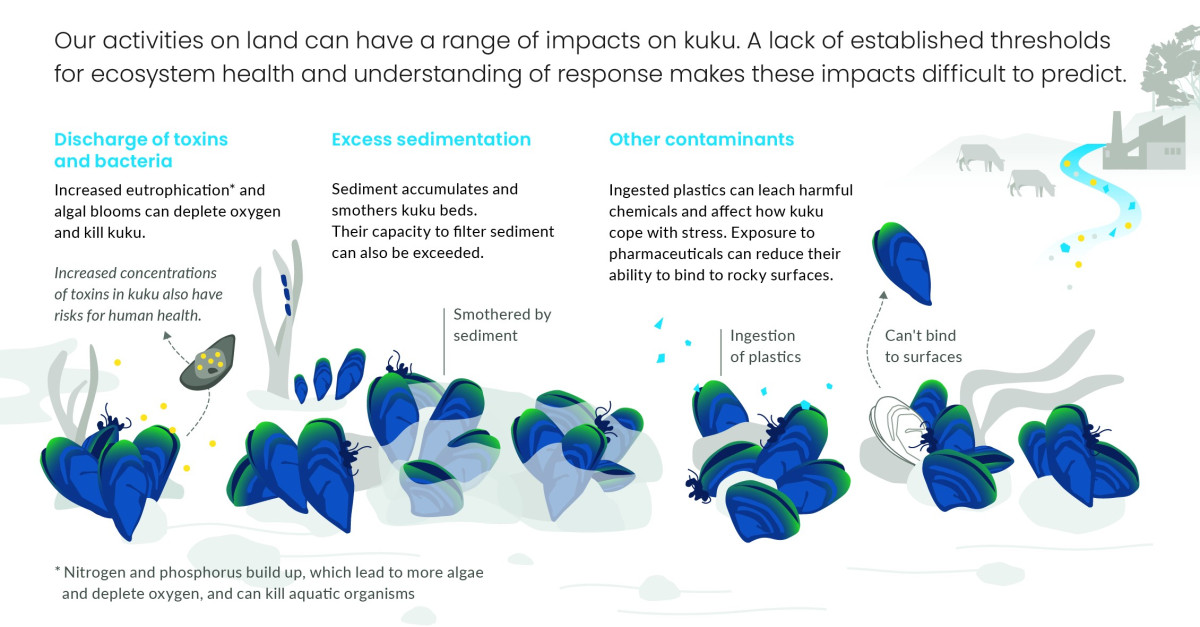
Read the long description for How land-based pressures affect kuku
Our activities on land can have a range of impacts on kuku. A lack of established thresholds for ecosystem health and understanding of response makes these impacts difficult to predict.
Discharge of toxins and bacteria - Increased eutrophication* and algal blooms can deplete oxygen and kill kuku. Increased concentrations of toxins in kuku also have risks for human health.
Excess sedimentation - Sediment accumulates and smothers kuku beds. Their capacity to filter sediment can also be exceeded.
Other contaminants - Ingested plastics can leach harmful chemicals and affect how kuku cope with stress. Exposure to pharmaceuticals can reduce their ability to bind to rocky surfaces.
* Nitrogen and phosphorus build up, which lead to more algae and deplete oxygen, and can kill aquatic organisms.
Issue 2: Our activities on land are polluting our marine environment
October 2019
© Ministry for the Environment