Chapter 3: Our activities and their effects

Half of the total land area in Aotearoa New Zealand is now used for agriculture, forestry, and housing.
Some land (15 percent) is particularly good for food production by farming animals or growing crops. This highly productive land has a good climate, suitable soil, and is flat or gently sloping. Highly productive land is often on the fringes of our cities. The area of highly productive land that was unavailable for agriculture (because it had a house on it) increased by 54 percent from 2002 to 2019.
Our exports and domestic food production currently rely on the small amount of highly productive land we have. Using land that is not highly productive for food growing, especially horticulture, results in lower yields unless more intensive land management approaches are used.
Intensive land management is about getting the most from each hectare of land – maximising the yield of milk, meat, timber, fruit, vegetables, or crops. Intensive land management risks degrading the quality and health of the soil.
No declining or improving trend in soil quality was observed for 1994–2018. However, nationwide 80 percent of monitoring sites failed to meet the targets for at least one soil quality indicator. Soil in these areas can be less productive and may need more fertiliser and irrigation to keep up production.
Land use is the modification of the natural environment for human use, such as clearing native vegetation for agriculture or forestry and building houses. Land-use change is a long-term change to the land, which can be irreversible.
Land cover is the main type of physical material covering a given area of land (Manaaki Whenua – Landcare Research, 2020). For this report, land cover is divided into three main classes: exotic land cover including agriculture and forestry, indigenous land cover including all native vegetation, and urban land cover including all built-up areas. (See indicators: Exotic land cover, Indigenous land cover, and Urban land cover.)
About half of New Zealand’s total land area is used for agriculture and forestry:
The total area of land used for agriculture and horticulture has been decreasing since 2002 and fell by 2 percent between 2017 and 2019. (See indicators: Agricultural and horticultural land use and Farm numbers and size and figure 1.) The number and size of farms has decreased since 2002 but the export income from farming products has increased during this time, suggesting that fewer farms are producing more on less land (MPI, 2012, 2015, 2020b). (See indicator: Farm numbers and size.) While part of the increase is due to higher prices for dairy products globally, higher prices also encouraged land to be used more intensively (Wynyard, 2016).
Dairy cattle numbers have more than doubled since the 1980s, rising from 3 million to almost 7 million in 2015, with more than 6 million in 2019. (See indicator: Livestock numbers and figure 1.)
Today, 40 percent of New Zealand’s land area is exotic grassland – the total area has not changed since 2012 but regional changes have occurred. (See indicator: Exotic land cover.) From 1996 to 2018, the area of exotic grassland decreased in 14 of 17 regions. During the same period, the area of exotic forest increased by 12 percent (220,922 hectares), with three quarters of the increase coming from land that was previously exotic grassland. (See indicator: Exotic land cover.)
Cropping and horticulture land made up 2 percent of New Zealand’s total area in 2018. The area of this land cover increased in 15 out of 17 regions for 1996–2018, with most of the increase coming from exotic grassland. (See indicator: Exotic land cover.)
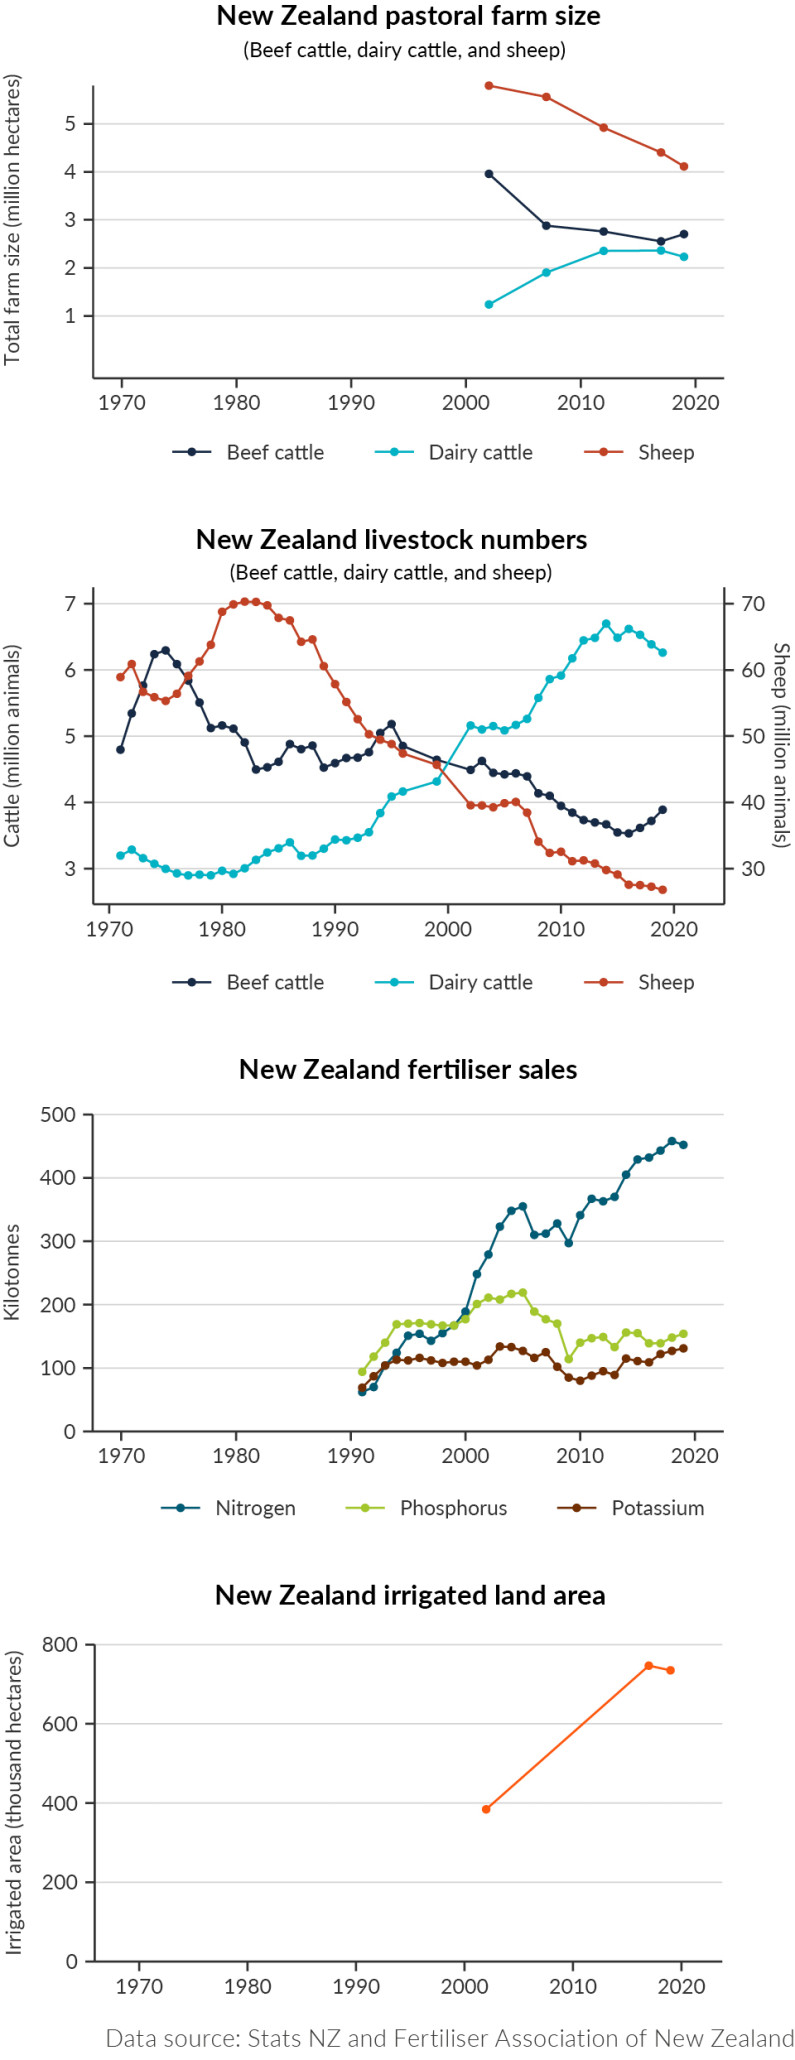
Read the long description for Figure 1: Changes in pastoral farm size, number of livestock, fertiliser sales, and irrigated land, 1970–2019
Four line graphs showing changes in:
Between 2002 and 2019, the total size of sheep farms decreased by approximately 1.6 million hectares. In the same period, the size of beef cattle farms decreased by approximately 1.2 million hectares and the total size of dairy cattle farms increased by approximately 0.9 million hectares.
Between 1970 and 2019, the number of sheep declined by approximately 54 percent and the number of cattle by approximately 19 percent while the number of dairy cattle increased by almost 49 percent. After 2002, dairy cattle outnumbered sheep and beef cattle in New Zealand.
Nitrogen fertiliser sales multiplied seven fold from 1990 to 2019. During the same period, phosphorus and potassium sales increased by approximately 64 percent and 90 percent respectively.
Total irrigated land in New Zealand has increased by approximately 90 percent between 2002 and 2019.
Some land is particularly good for food production (farming animals or growing crops). This highly productive land has a good climate, suitable soil, and is flat or gently sloping. Here, less irrigation and fertiliser is needed to grow food than in other areas. Highly productive land is often on the fringes of our cities.
Food production is most efficient on highly productive land because soil on this land needs the least fertiliser and cultivation (tilling or ploughing) to grow crops and livestock (Lynn et al., 2009). Highly productive land is also less prone to leaching fertiliser and contaminants into the environment than land with shallower or stony soil (Carrick et al., 2013; McLeod et al., 2014).
Highly productive land is important for growing food like potatoes, onions, and leafy green vegetables. Land in lower LUC classes is most suitable for grazing livestock (Lynn et al., 2009; Vogeler et al., 2014).
Using land that is not highly productive for growing food, especially horticulture, results in lower yields. Yields can be increased on some types of land by using more fertiliser and irrigation but this may affect the water quality in nearby waterways and can degrade the soil (Andrew & Dymond, 2013; MfE & Stats NZ, 2020b; Curran-Cournane, 2020; Sparling & Schipper, 2004). It also increases the cost of production.
Access to highly productive land is essential to continue food production for the domestic market and for export. Globally, the demand for dairy products is growing and the demand for horticultural and cropping products like kiwifruit remains high. In 2019, New Zealand’s land-based primary industries generated $44 billion in export revenue (MPI, 2020c).
The Government has set a target for the primary industries to increase export earnings by a further $44 billion in the next decade to support economic recovery after the COVID-19 pandemic (MPI, 2020a).
Land is classified into eight land-use capability (LUC) classes based on its potential for sustained production in the long term. The classes are based on soil properties, soil sensitivity to erosion, vegetation cover, and terrain (Lynn et al., 2009). The first four classes (LUC 1–4) are most suitable for cropping and most productive for pasture and forestry (Lynn et al., 2009; Vogeler et al., 2014). Land classified as LUC 8 is not used for agriculture and is often conservation land.
LUC class 1 land is the most versatile (it can grow the largest range of crops) and has few limitations on how it can be used. LUC class 2 is also versatile and has slight limitations. LUC class 3 land has moderate limitations. LUC classes 1–2 are known as highly versatile land and LUC classes 1–3 as highly productive land.
Highly versatile and highly productive land are scarce, finite resources – 5 percent of New Zealand’s total land area is highly versatile and 15 percent is highly productive (Ewers et al., 2006; Lynn et al., 2009; Rutledge et al., 2010).
The area of urban land in New Zealand increased by 15 percent from 1996 to 2018, and 83 percent (25,248 hectares) of the increase came from the conversion of exotic grassland to urban use. Nine percent (2,602 hectares) was converted from cropping or horticultural land. (See indicator: Urban land cover.)
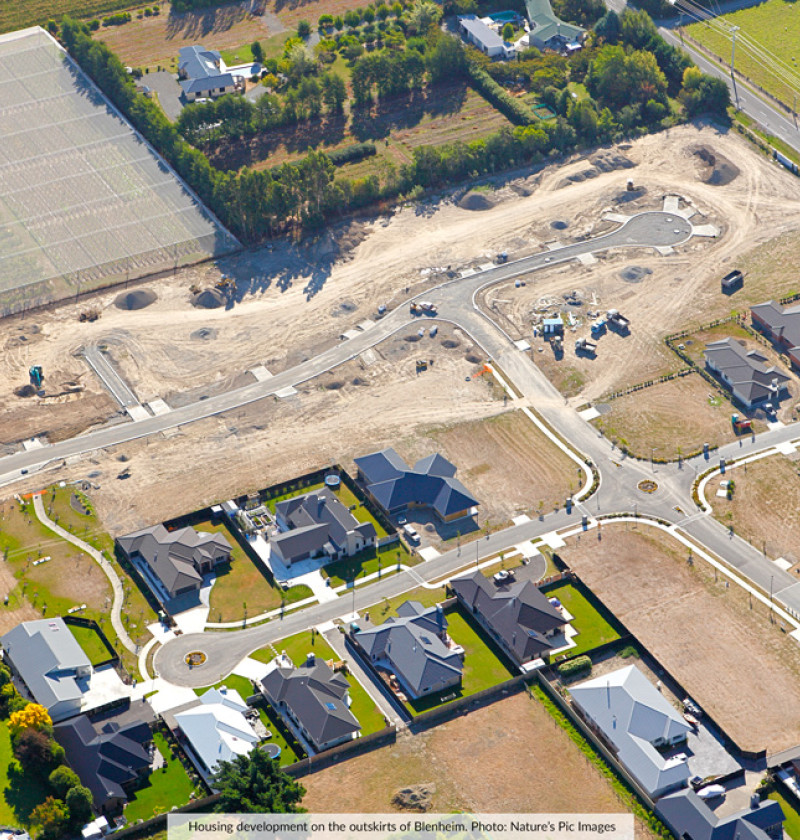
The area of highly productive land that was unavailable for agriculture (because it had a house on it) increased by 54 percent for 2002–19. (See indicator: Land fragmentation.) Urban land use increased by 31 percent on land that was potentially available for agriculture during this period. The area of residential land outside city boundaries (rural residential areas) also more than doubled in this time. (See indicator: Land fragmentation and figure 2). A large proportion of highly versatile land (LUC classes 1 and 2) nationally could be developed into urban zones in the next 50–100 years if current urbanisation trends continue (Rutledge et al., 2010).
Many of New Zealand’s cities have developed on and around food producing land, with market gardens providing a local food supply for urban dwellers. In the 1950s, urban development of market-gardening land in and around Auckland was already a concern (Hunt, 1959). Urban expansion onto that land has continued in the past 60 years. Kumeu/Riverhead, Pukekohe, and a surrounding area in the Franklin district are the main remaining areas. (See indicators: Exotic land cover and Urban land cover.) The areas in and around Pukekohe and Kumeu/Riverhead have now been rezoned for various types of development and are largely fragmented (Auckland Council, 2021; Curran-Cournane et al., 2016). (See indicator: Land fragmentation.)
The current and future development of land in the Auckland region was calculated in 2019, where development includes planned zones for urban areas and lifestyle blocks. It was found that 34 percent of LUC class 1 land, 38 percent of LUC class 2 land, and 19 percent of LUC class 3 land has been or will be developed (Environment Court of New Zealand, 2019).
Land fragmentation is the subdivision of land into smaller pieces (Hart et al., 2013; Rutledge et al., 2015). It includes subdividing agricultural land into smaller areas and building houses on agricultural land (Hart et al., 2013).
Fragmentation of highly productive land by subdivision can shift this land out of commercial production. This happens particularly with the development of lifestyle blocks, which were about 5 hectares on average in 2011 (Andrew & Dymond, 2013). These smaller blocks of land can produce food but it is generally for non-commercial consumption.
Highly productive land became more fragmented between 2002 and 2019, especially through residential development of land sized 2–8 hectares (Curran-Cournane et al., 2021). The largest increase in fragmentation (to 2–8 hectares of land with a house) occurred in Canterbury. (See indicator: Land fragmentation and figure 2.)
The way fragmentation happens can also increase the demand for further subdivision. If lifestyle blocks and rural subdivisions are scattered across an area, the agricultural land in between is also likely to become fragmented (Curran-Cournane et al., 2016; Hart et al., 2013). Land fragmentation can limit the options for land use today and in the future (Rutledge et al., 2015).
To address the demand for housing, there is a choice between building in existing residential areas (and creating denser urban areas) or building outwards onto productive land.
Our exports and domestic food production currently rely on the small amount of highly productive land we have. There are advantages to growing our food in New Zealand rather than importing it, such as being less vulnerable to disruptions in global trade. Ensuring everyone in New Zealand has access to affordable and nutritious food into the future is an important consideration in how we choose to use land today. (Fenwick Forum 2020, n.d.)
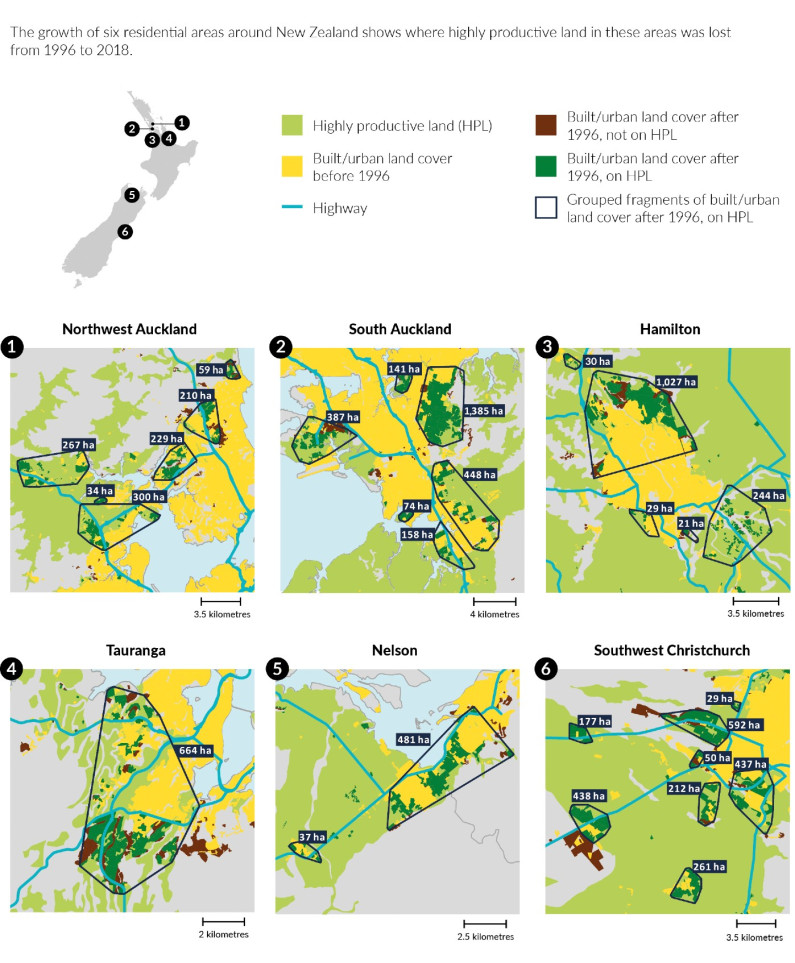
Image: Data source — Manaaki Whenua – Landcare Research
Read the long description for Figure 2: Residential expansion onto highly productive land
Maps showing six residential areas in New Zealand where a high proportion of highly productive land was converted to built or urban land cover between 1996 and 2018. These areas are around: Northwest Auckland, South Auckland, Hamilton, Tauranga, Nelson, and Southwest Christchurch. In each map, fragments of highly productive land that were converted to urban or built land cover between 1996 and 2018 and that lie within 1 km of each other are grouped together. For each set of grouped fragments, the total area of converted land (in hectares) is given.
Since 1996 the following areas of highly productive land were converted to built or urban land cover:
Soil is made up of minerals, organic material, living organisms, air, and water. Soils are not inherently good or bad, but vary through the landscape due to geology, time, and natural processes. Some naturally have higher fertility than others or are naturally more prone to erosion.
A well-functioning soil can drain excess water, retain water and important nutrients, and supply these to plants when they are needed. In these soils, processes such as carbon and nutrient cycling, structure development, biological activity, and disease suppression all take place. Reserves of carbon and nutrients are also built up (Herrick, 2000; Kibblewhite, 2018; Lilburne et al., 2020).
Land management is how the land and soil are managed for a given use. It includes how many animals are on the land, the number and type of crop cycles per year, whether the soil is tilled, irrigated or fertilised, and how much and how often. Management varies with the seasons and conditions, the effects of a drought for example can be relieved with irrigation, and a new crop may need a different type of fertiliser.
In this report, intensification refers to the use of inputs like fertiliser and irrigation to increase or maintain productivity (FAO, 2004; Moller et al., 2008). The aim of intensive land management is to increase the production of meat, milk, or crops from a specific area of land. This can be achieved by farming more animals per hectare and increasing the number of harvests from crops.
Intensification is often associated with environmental damage and concerns about soil quality and health (Houlbrooke et al., 2011; MacLeod & Moller, 2006). Agricultural intensification, however, reduces the need to convert more land to agriculture to increase production.
The use of irrigation, especially on land used for dairy farming, has nearly doubled since 2002. In 2019, 5 percent (735,073 hectares) of agricultural land in New Zealand was irrigated, with dairy farming making up 58 percent of irrigated agricultural land. Sixty-four percent of irrigated agricultural land was in Canterbury. (See indicator: Irrigated land and figure 3.)
A study of irrigated and non-irrigated pasture sites across New Zealand found that irrigated pastures had significantly less soil carbon and nitrogen than non-irrigated pastures. This finding could be due to less root growth, more decomposition of organic matter, or more release of carbon dioxide by microorganisms. An increase in the area of irrigated land may also increase the loss of carbon dioxide to the atmosphere, the loss of soil carbon, and increase nitrogen leaching (Mudge et al., 2017). Overall in New Zealand, irrigation is not thought to change soil carbon stocks in humid climates. An increase in soil carbon stocks due to irrigation could be expected at more dry sites (Whitehead et al., 2018).
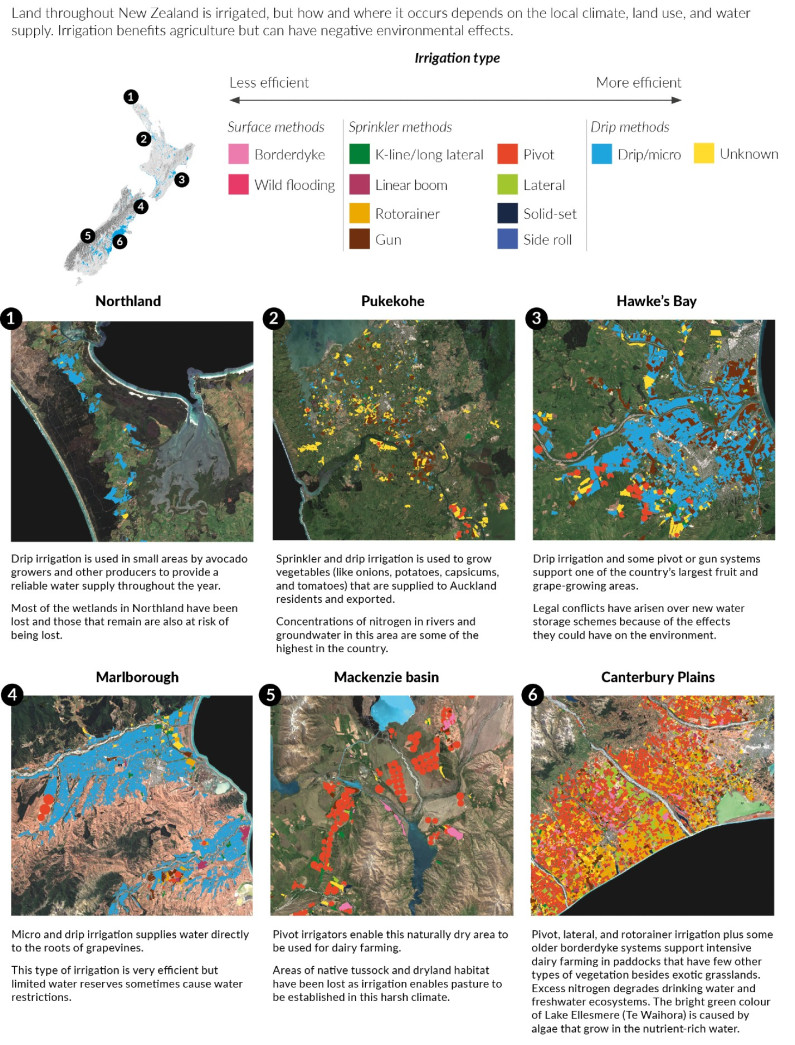
Image: Data source — Aqualinc Research Limited; Land Information New Zealand
Read the long description for Figure 3: A landscape of irrigation
Maps showing the spatial distribution of different irrigation methods in Northland, Pukekohe, Hawke’s Bay, Marlborough, Mackenzie basin, and Canterbury Plains.
Land throughout New Zealand is irrigated, but how and where it occurs depends on the local climate, land use, and water supply. Irrigation benefits agriculture but can have negative environmental effects.
In Northland drip irrigation is used in small areas by avocado growers and other producers to provide a reliable water supply throughout the year. Most of the wetlands in Northland have been lost and those that remain are also at risk of being lost.
In Pukekohe sprinkler and drip irrigation is used to grow vegetables (like onions, potatoes, capsicums, and tomatoes) that are supplied to Auckland residents and exported. Concentrations of nitrogen in rivers and groundwater in this area are some of the highest in the country.
In Hawke’s Bay drip irrigation and some pivot or gun systems support one of the country’s largest fruit and grape-growing areas. Legal conflicts have arisen over new water storage schemes because of the effects they could have on the environment.
In Marlborough micro and drip irrigation supplies water directly to the roots of grapevines. This type of irrigation is very efficient but limited water reserves sometimes cause water restrictions.
In the Mackenzie basin pivot irrigators enable this naturally dry area to be used for dairy farming. Areas of native tussock and dryland habitat have been lost as irrigation enables pasture to be established in this harsh climate.
In the Canterbury Plains pivot, lateral, and rotorainer irrigation plus some older borderdyke systems support intensive dairy farming in paddocks that have few other types of vegetation besides exotic grasslands. Excess nitrogen degrades drinking water and freshwater ecosystems. The bright green colour of Lake Ellesmere (Te Waihora) is caused by algae that grow in the nutrient-rich water.
Glaciers were the first way that water shaped Te Manahuna/Mackenzie basin in the South Island. These great rivers of ice powered through the land, leaving behind lakes and outwash (deposited sediment and gravel). This is the only place in New Zealand where the full glacier sequence from mountain to outwash plain is intact.
Low rainfall, extreme temperatures, and stony and infertile soil influenced the range of plants that developed here. Many are found nowhere else, with special features to allow them to survive in these harsh conditions, like being low growing or leafless. The basin is also home to eight threatened bird species and rare native moths, butterflies, fish, and other animals.
Early Māori visited Te Manahuna to harvest resources and food, particularly tuna and weka. Because the tall tussocks were hard to navigate, Māori lit fires to remove them from large areas.
From the 1850s, sheep were farmed in the Mackenzie basin on land that was leased perpetually from the Government.
Water drastically altered the Mackenzie landscape when this country’s largest network of hydropower stations was built from the 1950s to the 1980s. Some lakes were increased in size and a new one, Benmore, was created. Leaseholders whose land was flooded were compensated by the promise of access to water for irrigation.
Irrigation began in the 1970s to produce feed for sheep. This ‘sensitive’ irrigation had the potential to double or triple the profitability of farms, because the basin is so naturally dry. More income did support some gains for the environment like wilding pine and rabbit control and enabled farmers to keep stock off delicate native vegetation during droughts.
In the 1990s leaseholders were offered tenure review – the opportunity to buy portions of their land with the balance being set aside for conservation. Freehold land has fewer constraints on its management and can be farmed more intensively and profitably.
Large areas of land on the basin floor became freehold and by 2020, less than one tenth of the land below 800 metres had any form of protection. This, however, is where most of the threatened plants and animals are located.
Water applied slowly to large areas of land has arguably had the most profound effect on the Mackenzie basin, particularly on freehold land. In less than 15 years (2003–18) the area of intensified land more than doubled. By 2018, only one third of the 25,000 hectares with active irrigation consents had been irrigated, so there is potential for further intensification.
Economic returns have driven intensification – the total gross high country farm revenue in 2018/19 was more than twice that of 2009/10. A change from sheep to more profitable dairy farming was also supported by access to water. The basin’s first dairy farm opened near Twizel in 2003 using pivot irrigators. These machines require land to be flattened and seeded with grass, which removes all the native dry-loving plants.
In a highly controversial move, a 2009 proposal to farm 17,850 dairy cows at Ōhau Downs Station was granted separate consents from different governing agencies. This prevented all the effects being considered together, which was described by the Environment Minister at the time as “gaming” the resource consent process. The project did not go ahead – the discharge consent was called in by the Minister and the land-use consents were squashed after a legal challenge. Other landowners have since used the same tactics with more success.
The exposure of these regulatory loopholes led to changes in land management. In 2017, the Mackenzie District Plan tightened consenting requirements, which prevented land at its 56 sites of natural significance being further intensified or converted to agricultural use. In 2019, the Government ended tenure review.
Several joint initiatives to ensure landscape-scale protection have also been set up. The Mackenzie Agreement was signed in 2013 to protect and celebrate the biodiversity, landscapes, and cultural heritage of the basin. The Mackenzie Basin Agency Alignment Programme joined up the efforts of the five agencies that manage land and coordinate projects in the area. Tū Te Rakiwhānoa Drylands [Department of Conservation website] is an initiative between the Crown, mana whenua, and landholders to protect areas of lower altitude land in the Mackenzie and Waitaki Basins.
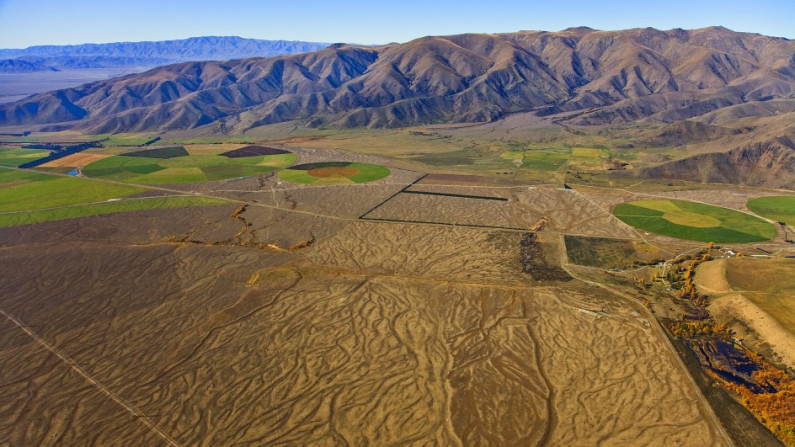
Image: Steve Bicknell
Soil quality is a measure of the condition of soil. Because different crops and animals have varying needs and interactions with the soil, soil quality is assessed according to its intended use.
Soil quality is monitored routinely by councils in New Zealand using a set of indicators. The programme began in the mid-1990s and sites are resampled every 4–5 years.
Soil quality indicators are based on the chemical and physical properties of the soil (see Monitoring soil quality) and biological indicators (like biodiversity) are not currently monitored directly (Sparling & Schipper, 2004).
Two of the indicators, mineralisable nitrogen and pH, were generally within target ranges at the tested sites and are not discussed here.
Read the long description for Monitoring soil quality
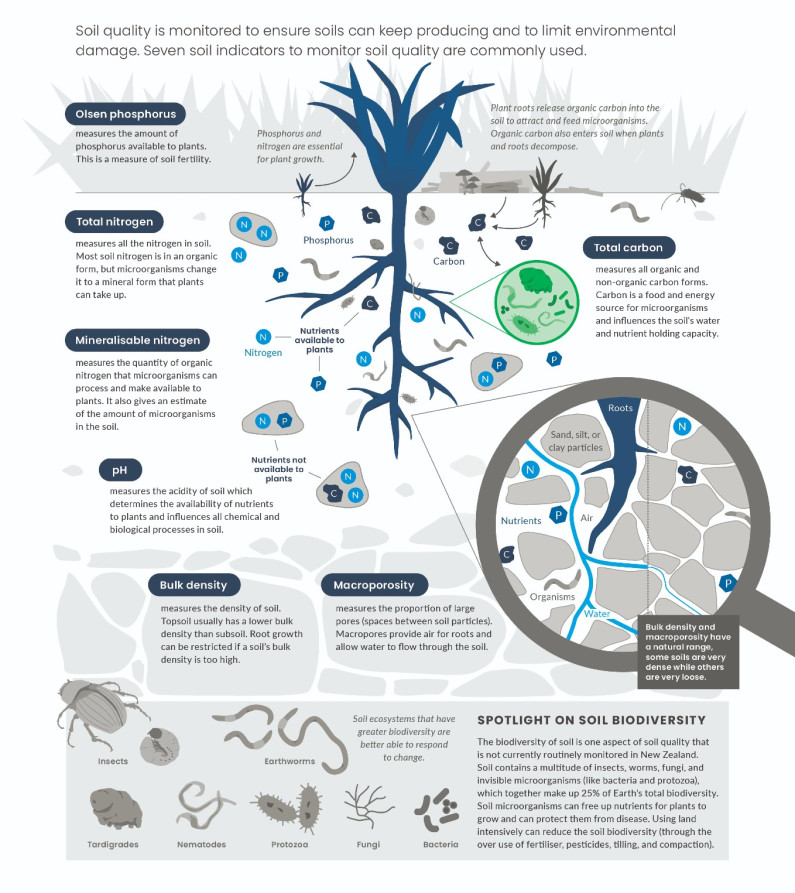
Soil quality is monitored to ensure soils can keep producing and to limit environmental damage. Seven soil indicators to monitor soil quality are commonly used.
Olsen phosphorus measures the amount of phosphorus available to plants. This is a measure of soil fertility.
Total nitrogen measures all the nitrogen in the soil. Most soil nitrogen is in an organic form, but microorganisms change it to a mineral form that plants can take up.
Phosphorus and nitrogen are essential for plant growth.
Mineralisable nitrogen measures the quantity of organic nitrogen that microorganisms can process and make available to plants. It also gives an estimate of the amount of microorganisms in the soil.
pH measures the acidity of the soil which determines the availability of nutrients to plants and influences all chemical and biological processes in the soil.
Bulk density measures the density of soil. Topsoil usually has a lower bulk density than subsoil. Root growth can be restricted if a soil’s bulk density is too high.
Macroporosity measures the proportion of large pores (spaces between soil particles). Macropores provide air for roots and allow water to flow through the soil.
Bulk density and macroporosity have a natural range, some soils are very dense while others are very loose.
Total carbon measures all organic and non-organic carbon forms. Carbon is a food and energy source for microorganisms and influences the soil’s water and nutrient holding capacity.
Spotlight on soil biodiversity – The biodiversity of soil is one aspect of soil quality that is not currently routinely monitored in New Zealand. Soil contains a multitude of insects, worms, fungi, and invisible microorganisms (like bacteria and protozoa), which together make up 25 percent of Earth’s total biodiversity. Soil microorganisms can free up nutrients for plants to grow and can protect them from disease. Using land intensively can reduce the soil biodiversity (through the over use of fertiliser, pesticides, tilling, and compaction).
Soil ecosystems that have greater biodiversity are better able to respond to change.
Each soil quality indicator has set target ranges to ensure the best crop yields and the least environmental damage (Sparling et al., 2008). Values that fall above or below a target range can limit production from the soil or indicate negative effects on the wider environment (Sparling et al., 2008; Stevenson et al., 2020).
Soil quality target ranges are established for the combination of each indicator, land use, and soil order (Sparling et al., 2008; Stevenson et al., 2020). Not all soil quality indicators have target ranges for every land use. Total nitrogen target ranges are not available for cropping and orchard/vineyard. Total carbon does not have an upper limit as more carbon is considered better (Sparling et al., 2008).
Target ranges have been established for the following land uses:
Soil quality target ranges are provisional and incomplete, and are updated as new research on production requirements or environmental effects becomes available.
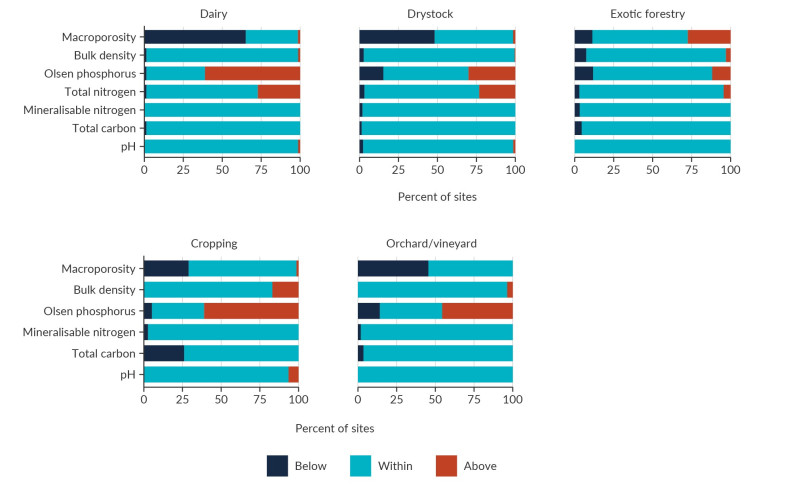
Image: Data source — Manaaki Whenua – Landcare Research
Read the long description for Figure 4: Sites within target range of soil quality indicators by land use, 2014–18
Five bar graphs showing the percentage of sites that are within, below and above soil quality indicator target ranges for five land uses (dairy, drystock, exotic forestry, cropping, orchard/vineyard) between 2014 and 2018.
For all land uses, the following indicators are presented: macroporosity, bulk density, Olsen phosphorus, mineralisable nitrogen, total carbon, and pH. In addition, for dairy, drystock and exotic forestry a bar for total nitogen is also presented.
Approximately half of the sites in dairy, cropping and orchard/vineyard are above the target range for Olsen phosphorus. Around 60 percent of the sites in dairy and half of the sites in drystock and orchard/vineyard are below the target range for macroporosity.
Approximately one quarter of the sites in dairy and drystock are above the target range for total nitrogen. Over 90 percent of the sites in dairy, drystock, exotic forestry and orchard/vineyard are within the target range for total carbon, and over 70 percent of cropping sites are within the target range for total carbon.
Macroporosity (the number of pore spaces in the soil) was below the target range in 65 percent of dairy farming sites, 48 percent of drystock farming sites, and 46 percent of orchard/vineyard sites sampled between 2014 and 2018. No decreasing trend or improvement in macroporosity was found in drystock farming or in dairy farming from 1995 to 2018 (Stevenson & McNeill, 2020).
Low macroporosity can indicate that soil is compacted, with few large pores and a restricted flow of water and air. This can reduce the growth of plants and the yield from pastures, especially in wet conditions (Drewry et al., 2004, 2008; Mackay et al., 1996). Also, water can pond on the surface then run off, which causes erosion and moves topsoil and nutrients into waterways.
Soil compaction can be caused by heavy machinery (like tractors), high animal stocking rates, or stock damaging the soil when it is wet. Low macroporosity in orchards and vineyards can be caused by the use of heavy machinery for harvesting, pruning, and applying fertilisers and pesticides. The expansion of dairy farming since the 1980s is likely to have contributed to low macroporosity and increased compaction of soils with this land use (Drewry et al., 2008; Wynyard, 2016). (See indicator: Livestock numbers.)
Levels of total carbon at most sites were within the target range, but soil carbon was below the target range at 26 percent of cropping sites. (See indicator: Soil quality and land use.)
Cropping – growing cereals, seeds, and vegetables – requires soil to be used intensively. This often involves several crop cycles per year, preparing the soil with tilling, adding fertiliser, pesticides, and irrigation, and harvesting with heavy machinery. The frequent tilling in cropping systems can cause soil carbon to decrease (Whitehead et al., 2018).
Levels of Olsen phosphorus were above the recommended target range for 61 percent of the dairy farming and cropping sites, and 46 percent of orchard/vineyard sites sampled between 2014 and 2018. (See indicator: Soil quality and land use and figure 4.) Olsen phosphorus levels provide an indication of soil fertility.
The top of the target range for Olsen phosphorous is 50 milligrammes per kilogramme for volcanic soils used for dairy farming, and the average concentration for monitored dairy sites was 67 milligrammes per kilogramme. (See indicator: Soil quality and land use.) Olsen phosphorus was also above the target range at 30 percent of drystock sites. (See indicator: Soil quality and land use and figure 4.) Also, a trend of increasing Olsen phosphorus was observed at cropping and drystock sites for 1996–2018 (Stevenson & McNeill, 2020).
Phosphorus becomes chemically unavailable soon after it is applied and only 15–30 percent of phosphorus fertiliser is taken up by crops (Cordell et al., 2009; Roy et al., 2006). High levels of Olsen phosphorus in the soil therefore indicate that too much has been applied. Also, phosphorus fertiliser is costly, so its overuse is an unnecessary expense.
Phosphorus fertiliser is produced from rock phosphate, a type of rock that contains high levels of phosphorus. It is only found in a few places worldwide and its supply is becoming increasingly scarce (Cordell & White, 2014).
Until the 1960s, New Zealand sourced rock phosphate from Nauru, where phosphate mining devastated the Pacific Island’s environment (Wynyard, 2016). Today, approximately 70 percent of our rock phosphate comes from Western Sahara (Fertiliser Association of New Zealand, 2021). Geopolitics in this region may threaten a sustainable supply, which is a cause for concern (Cordell & White, 2014; Powers et al., 2019).
Recycling phosphorus from waste streams can be part of a circular economy. Manure, wastewater sludge, and waste from fisheries and the food industry are all possible sources (Ahuja et al., 2020; Powers et al., 2019). Fish waste has been used traditionally as a fertiliser and fertiliser made from fish waste can be commercially viable (Ahuja et al., 2020).
The phosphorus exceedance footprint (PEF) calculates the use of phosphorus from a consumption perspective. It takes into account a country’s imports and exports of phosphorus as fertiliser and in goods that used this fertiliser in their production. PEF also takes the global environmental risk of phosphorus to freshwater and oceans into account (Li et al., 2019; Steffen et al., 2015).
In New Zealand, the use of phosphorus fertiliser peaked in 2005 and has reduced since then but the PEF per capita of this country is the largest in the world. (See indicator: Fertilisers – nitrogen and phosphorus.) New Zealand is a net exporter of phosphorus because of the exports of agricultural products that required phosphorus in their production (Li et al., 2019).
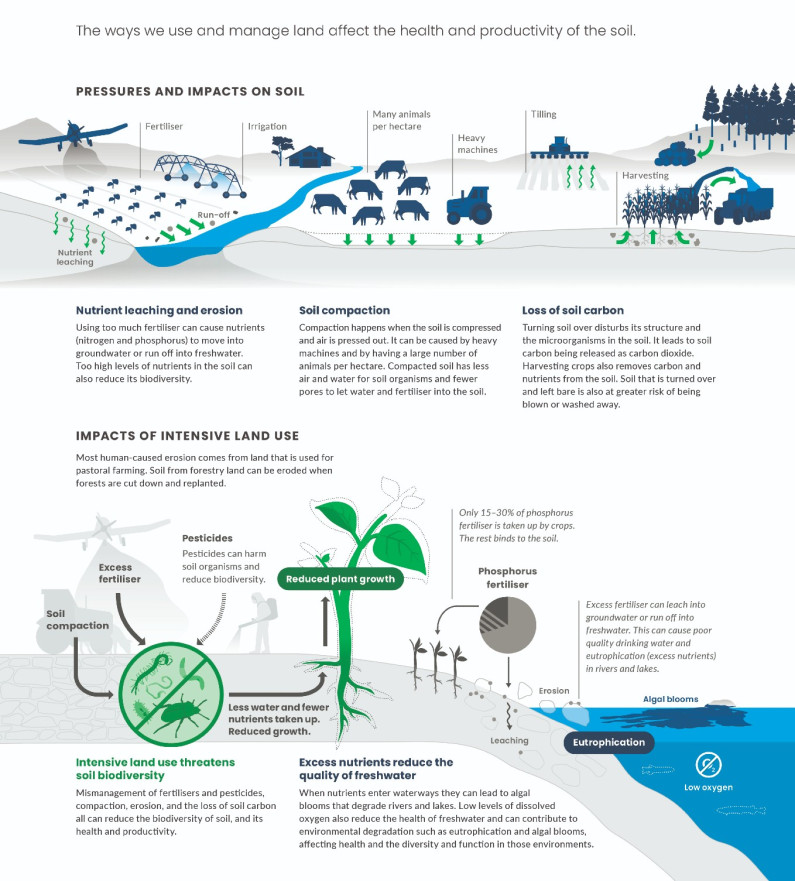
Read the long description for Land-use effects on soil quality
[Examples of the pressures and impacts on soil are shown – these include fertiliser (which can cause nutrient leaching and run-off), irrigation, animals per hectare, heavy machines, tilling, and harvesting.]
Nutrient leaching and erosion – using too much fertiliser can cause nutrients (nitrogen and phosphorus) to move into groundwater or run off into freshwater. Too high levels of nutrients in the soil can also reduce its biodiversity.
Soil compaction – compaction happens when the soil is compressed and air is pressed out. It can be caused by heavy machines and by having a large number of animals per hectare. Compacted soil has less air and water for soil organisms and fewer pores to let water and fertiliser into the soil.
Loss of soil carbon – turning over soil disturbs its structure and the microorganisms in the soil. It leads to soil carbon being released as carbon dioxide. Harvesting crops also removes carbon and nutrients from the soil. Soil that is turned over and left bare is also at greater risk of being blown or washed away.
The impacts of intensive land use mainly through reduced plant growth and eutrophication are shown. Pesticides, excess fertiliser, and soil compaction can result in less water and fewer nutrients being taken up which reduces plant growth. Only 15-30 percent of phosphorus fertiliser is taken up by crops with the rest binding to the soil. Excess fertiliser can leach into groundwater or run off into freshwater. This can cause poor quality drinking water and eutrophication (excess nutrients) in rivers and lakes.
Intensive land use threatens soil biodiversity – mismanagement of fertilisers and pesticides, compaction, erosion, and the loss of soil carbon all can reduce the biodiversity of soil, and its health and productivity.
Excess nutrients reduce the quality of freshwater – when nutrients enter waterways they can lead to algal blooms that degrade rivers and lakes. Low levels of dissolved oxygen also reduce the health of freshwater and can contribute to environmental degradation such as eutrophication and algal blooms, affecting health and the diversity and function in those environments.
Total nitrogen levels were within the target range for more than 72 percent of sites for dairy, drystock, and forestry. (See indicator: Soil quality and land use and figure 4.)
Cropping and orchard/vineyards sites do not currently have target ranges for total nitrogen because of the large variations in the amount of nitrogen required by different crops. Concern about nutrients leaching from land with these uses has been raised, particularly where vegetables are grown intensively (Drewry et al., 2015).
Despite most sites being within the target range, many rivers are polluted with excess nitrogen (MfE & Stats NZ, 2020b). The total nitrogen target range therefore does not appear to adequately capture the issues around its use and environmental impacts. While more nitrogen is considered to be better for agriculture (to enhance plant growth, crop yield, and production), less nitrogen is better for environmental outcomes like freshwater quality (Sparling et al., 2008).
Some dairy and drystock sites have relatively high levels of cadmium and zinc compared to natural soil background concentrations. A decrease in cadmium at these sites has been observed since 1995. Some cropping and horticulture soils have relatively high levels of arsenic and cadmium compared to natural soil background concentrations (see figure 5).
While there is no soil quality target range for trace elements, heavy metals such as arsenic, cadmium, copper, lead, and zinc can be toxic for soil organisms, plants, and animals if their concentrations become too high. Levels of trace elements in New Zealand soils are generally within the provisional ecological soil guideline values that have been established to protect soil life, plants, and animals from toxicity (see figure 5) ( Cavanagh & Munir, 2019).
Cadmium can be present in some types of phosphorus fertiliser. Rock phosphate from Nauru was high in cadmium and as a result, soil cadmium concentrations have increased on most land used for agriculture, particularly dairy farms in Waikato and Taranaki (Longhurst et al., 2004; Taylor et al., 2010; Wynyard, 2016; Cavanagh et al., 2015; Drewry et al., 2021; Fertiliser Association of New Zealand, 2019; Abraham, 2020).
Cadmium levels in agricultural soils are managed through the tiered fertiliser management system that ensures they remain within acceptable limits for human health, soil health, and agricultural production (Abraham, 2020; Fertiliser Association of New Zealand, 2019).
The concept of soil health is more holistic than soil quality. Soil health is a soil’s ongoing capacity to function as a living ecosystem that sustains plant, animal, and human health (Lehmann et al., 2020).
A healthy soil supports high biodiversity, with myriads of microorganisms forming complex, intricate networks and interacting to process carbon and nutrients. Soils contain more than 25 percent of the world’s total biodiversity mostly as microorganisms (FAO et al., 2020). These microorganisms contribute to nutrient cycling, plant growth, and defending plants against pathogens (disease-causing organisms) (Bardgett & Van Der Putten, 2014).
Soil biodiversity is essential for a functioning and resilient soil ecosystem (FAO et al., 2020). Many different organisms in the soil have similar functions so if some are attacked by a pathogen or cannot tolerate a drought, other organisms will be able to carry on the same processes.
Intensive management – tilling, fertiliser use, pesticides, and compaction – has negative effects on soil biodiversity (Bardgett & Van Der Putten, 2014; Leahy et al., 2019; Tamburini et al., 2020; Wakelin et al., 2021). In degraded soil, soil organisms cannot process carbon and nutrients sufficiently and it is harder for plant roots to access the water, air, and nutrients needed for growth.
Adding fertilisers affects which microorganisms live in the soil and the functions they perform (Hermans et al., 2017; Wakelin et al., 2021). Using land for pasture can affect soil biodiversity for decades. It can also have ongoing effects on how soil ecosystems are able to respond to further changes in land use (Addison et al., 2019).
At 50 pasture sites across New Zealand, the complexity of networks and interactions in groups of microorganisms with different functions were compared. Pastures that were managed less intensively had more soil complexity than those managed as highly intensive dairy pastures. The higher complexity may indicate that the soil processes are more resilient and better able to tolerate disturbance (Dignam et al., 2018; Bardgett & Van Der Putten, 2014).
Despite some progress to identify suitable indicators of soil biodiversity in New Zealand, regular sampling and measurement of soil biodiversity is yet to be established as part of long-term soil quality monitoring (Hermans et al., 2020).
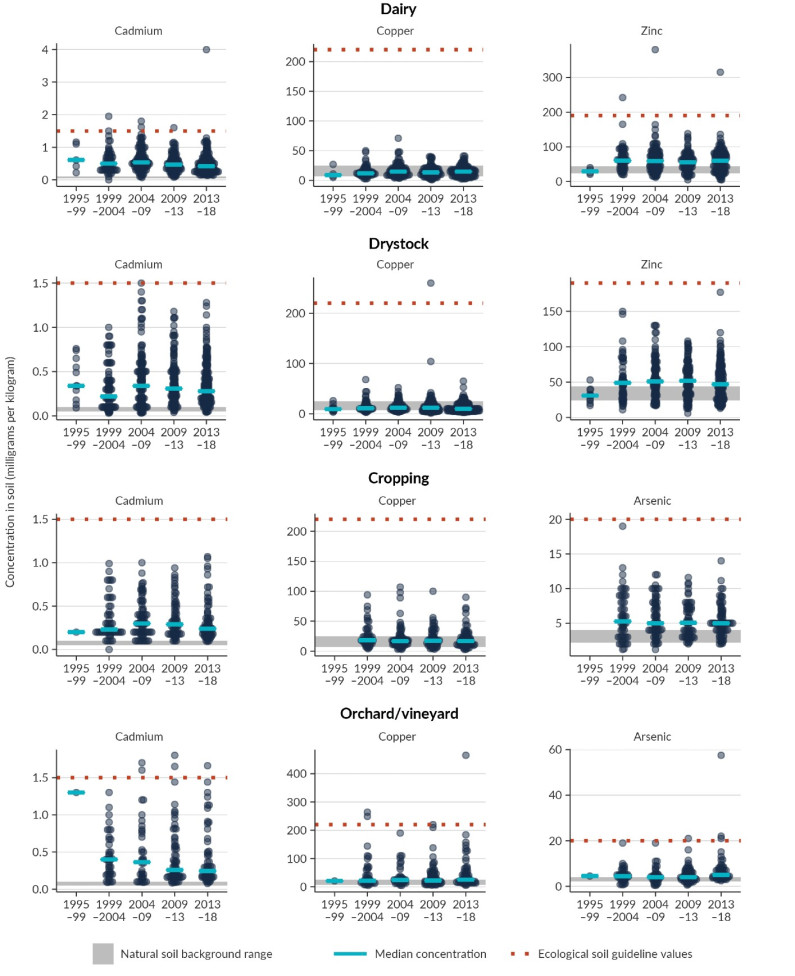
Image: Data source — Manaaki Whenua – Landcare Research
Read the long description for Figure 5: Trace elements in monitoring sites, 1995–2018
Twelve beeswarm graphs showing the concentrations of trace elements in monitoring sites for dairy, drystock, cropping and orchard/vineyard from 1995 to 2018. Individual graphs are shown for each trace element and land-use combination.
There are graphs on cadmium and copper concentrations for all land covers, graphs on zinc concentrations for dairy and drystock, and graphs on arsenic for cropping and orchard/vineyard. In each graph, the median concentration, natural background concentration range, and ecological soil guideline values are also marked. Individual beeswarms are shown for trace element concentrations in each graph at each of the following time steps: 1995–99, 1999–2004, 2004–09, 2009–13 and 2013–18.
In all land covers, more than half the monitoring sites have cadmium concentrations above the natural soil background levels in all time steps. After 1999, more than half of the monitoring sites have zinc concentrations in dairy and drystock and arsenic concentrations in cropping above natural soil background levels. For all land covers and trace elements, there are only very few sites that have concentrations above the ecological soil guideline values. Orchard/vineyard has the greatest number of sites above the ecological soil guidelines for cadmium (5 sites) and copper (3 sites).
Chapter 3: Our activities and their effects
April 2021
© Ministry for the Environment