Our Freshwater 2026 Tō Tātou Wai Māori

Our Freshwater 2026 examines the most pressing issues in our groundwater, lakes and rivers, with a focus on the role of groundwater in our freshwater environments.
The report is produced jointly by the Ministry for the Environment and Stats NZ.
Our Freshwater 2026 examines the most pressing issues in our groundwater, lakes and rivers, with a focus on the role of groundwater in our freshwater environments.
The report is produced jointly by the Ministry for the Environment and Stats NZ.
Our Freshwater 2026 examines the most pressing issues in our groundwater, lakes and rivers, with a focus on the role of groundwater in our freshwater environments.
Tēnā koutou katoa
Freshwater is essential to life in Aotearoa New Zealand. It supports our health and wellbeing, enables food and energy production, sustains ecosystems and underpins almost every part of our economy. When freshwater is degraded or becomes less reliable, the costs are felt by households, communities, businesses and infrastructure.
Our Freshwater 2026 shows how this interconnected system is changing. Pressures from land use, contamination, water abstraction and climate change are altering the quality and movement of water across rivers, lakes, wetlands and aquifers. These changes affect drinking water security, ecosystem health, recreation, cultural practices and economic activity in many regions.
A central focus of this report is groundwater. Although mostly unseen and slow to change, it sustains river flows, supplies drinking water to many New Zealanders and reflects the legacy of past land use. Because groundwater responds over years or decades, the consequences of today’s actions endure long into the future.
Environmental reporting exists to help New Zealand understand these changes and their implications. Produced independently under the Environmental Reporting Act 2015, this report brings together the best available indicators, scientific evidence and mātauranga Māori (Māori knowledge) to provide a trusted national picture. It does not evaluate policy or recommend solutions. Instead, it provides the foundation of evidence needed for informed decisions by communities, iwi and Māori, local and central government, businesses and households.
The challenges facing freshwater are complex and long term. Meeting them will require shared understanding, sustained attention and collaborative effort. We hope this report supports that work and contributes to protecting and restoring freshwater for the benefit of people, nature and future generations.
| Sam Buckle Secretary for the Environment (Acting) |
Colin Lynch Government Statistician |
Freshwater supports every aspect of life. It underpins our health and wellbeing, our cultural identity and recreation, and our communities, economy and livelihoods. The water that moves through our landscapes is part of one interconnected system: falling as rain or snow, travelling through soils and groundwater, flowing through streams, rivers, lakes and wetlands, and eventually reaching estuaries and the sea. Changes in any part of this system affect the others.
Te ao Māori (Māori worldview) perspectives reinforce this understanding of connectedness. Some Māori describe freshwater through whakapapa (ancestral ties) and pūrākau (ancient narratives) that emphasise the relationships between different forms of water and the environments they move through. In these accounts, Wainui ātea is identified as the personification of clear, mighty waters, associated with the origins of water bodies (Whaanga & Roa, 2021). Narratives involving Ranginui (Sky Father) and Papatūānuku (Earth Mother) describe the movement of water between sky, land and waterways (Reed & Calman, 2021; Salmond et al., 2019). These perspectives highlight the long‑recognised knowledge that water is connected ki uta ki tai (from the mountains to the sea), which can work together with scientific evidence of hydrological and ecological connectivity to enhance our overall understanding.
The Environmental Reporting Act 2015 (the Act) requires an assessment of the state of this whole freshwater system and how human activities influence it. Integrating te ao Māori perspectives supports a fuller and more place‑based understanding of how pressures accumulate and interact across connected environments over time (PCE, 2022).
We tend to think of freshwater as only the water we can see, in rivers, lakes and wetlands. But surface water and groundwater are interconnected in complex ways. Groundwater is a unifying theme in this report. Groundwater is the freshwater found beneath the Earth’s surface, stored in soil pores, rock fractures and aquifers. It is replenished primarily by rainfall and snowmelt and moves slowly through underground pathways, feeding rivers, lakes and wetlands, and sustaining flows during dry periods.
Human activities and land use affect how much freshwater is available and how it moves through the environment. Water use for agriculture, towns and cities, and electricity generation influences groundwater levels and the flow of rivers and lakes. Climate change is also reshaping freshwater systems by altering rainfall patterns, flow rates and sea levels. Natural processes such as erosion and sedimentation can increase with changes in climate and land use.
In te ao Māori, freshwater is understood as having mauri (life force), which refers to its essential quality and integrity (Durie, 1998; Mead, 2003; Morgan, 2006). Mauri is used in environmental practice to describe the condition and resilience of ecosystems, including freshwater (Morgan, 2006) (see Environment Aotearoa 2022). Considering mauri alongside scientific assessments provides an additional way to understand the state of freshwater and how pressures affect both ecosystems and people.
Activities on land can have cumulative and long‑lasting effects on groundwater and surface water. Water can take days to decades to move through groundwater systems before emerging in springs, rivers or wetlands. As a result, the impacts of human activities may persist long after pressures are first introduced, influencing the state and mauri of freshwater systems for many years.
Our Freshwater 2026 is the latest in a series of environmental reports produced by the Ministry for the Environment and Stats NZ. It is the fourth report in the series dedicated to the freshwater environment, following reports in 2017, 2020 and 2023.
This report first looks at freshwater levels, flows and connections, and how changes to land and what is in the water reverberate across the whole system. It then looks at how these changes affect water quality, and the impacts of this on ecosystems and people.
The Act requires us to report on environmental pressures, state and impacts, as well as on specific topics set out in the Act. We do this through a set of environmental indicators. Where indicators are not available or do not fully describe an issue, we use a broader body of evidence to ensure the report provides a comprehensive and authoritative picture of the state of Aotearoa New Zealand’s freshwater.
The indicator data in this report draws on many sources, including public research organisations and central and local government. The body of evidence brings together peer‑reviewed scientific literature, government reports and other grey literature, mātauranga Māori (Māori knowledge), and observational information on ecosystem changes. All data and evidence used in this report were corroborated and checked for consistency with their original sources, and a panel of independent scientists reviewed the report. This approach means the report remains robust and trustworthy, even where indicators are still developing. Indicator definitions and update dates are available on the Stats NZ indicators web pages.
Evaluating specific policies and providing advice on responses is out of scope for reports prepared under the Act. Reports under this Act are produced independently of ministers.
Of the 15 indicators included in this report, 10 are freshwater indicators that have been updated since Our freshwater 2023 (see Stats NZ environment indicators). These updates strengthen the underlying data and provide a clearer picture of how freshwater systems are changing across New Zealand. Two key methodological improvements support this:
Recent updates from Stats NZ show a mix of improving and worsening trends in the water quality measured in rivers, lakes and groundwater.
Modelled indicators of river and lake ecosystem health recently updated by Stats NZ estimate conditions for freshwater health for all rivers, and all lakes larger than 1 hectare, to help understand these conditions where they are not directly measured.
Recent updates to Stats NZ indicators for Escherichia coli (E. coli) and nitrate-nitrogen show that many rivers and groundwaters are affected by pathogens or nitrate levels that could pose risks to human health.
Together, the updated indicators show that while some aspects of freshwater quality and ecosystem health are good and improving, others are deteriorating. This reinforces the need to view freshwater as an interconnected system where multiple pressures accumulate and interact over time.
Research published since Our freshwater 2023 continues to deepen our understanding of how freshwater systems are changing. Several consistent themes are emerging across the literature.
Climate change is reshaping freshwater processes. Studies show increasing influence on rainfall patterns, river flows and water temperatures, as well as salinity in coastal areas. This research highlights the growing role of climate change in amplifying existing pressures and shaping future freshwater conditions.
Groundwater processes are becoming more visible. New research has strengthened our understanding of how groundwater interacts with land use, surface water and ecosystems. Studies show that groundwater age, flows and lag times mean that past activities can influence water quality and flows for many years.
The role of extreme events is clearer. There is increasing evidence that storms and floods are major drivers of contaminant transport. Many contaminants, including nutrients and pathogens, and contaminants stored in sediment, peak during high‑flow events that can be missed by routine monitoring.
Emerging contaminants remain a growing concern. Research on pesticides, pharmaceuticals, per- and polyfluoroalkyl substances (PFAS) and microplastics continues to expand. While concentrations can be low, many of these substances are persistent, mobile or poorly understood, leading to uncertainty about long‑term ecological and human health impacts.
Freshwater ecosystems are under increasing pressure. Studies document how nutrient enrichment, invasive species, altered flows and warming water temperatures are affecting species distributions, ecological function and habitat quality. Climate‑driven changes compound these stresses.
Coastal and groundwater interactions are changing. Research shows that sea‑level rise is pushing saltwater further inland in some locations, affecting coastal aquifers, wetlands and estuarine habitats.
Together, these developments provide a fuller picture of how freshwater is responding to long‑term pressures, and they help explain patterns seen in indicator data, particularly where cumulative and delayed effects are involved.
Our freshwater.
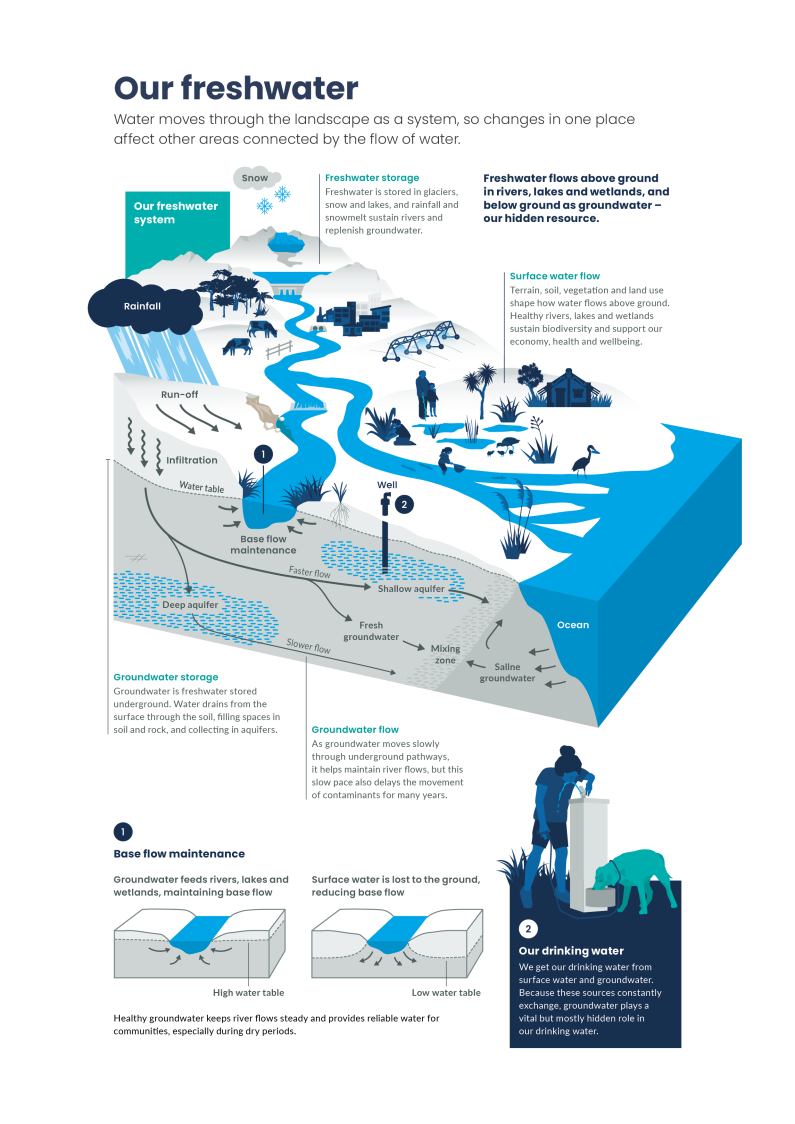
Water moves through the landscape as a system, so changes in one place affect other areas connected by the flow of water.
Freshwater flows above ground in rivers, lakes and wetlands, and below ground as groundwater – our hidden resource.
Freshwater is stored in glaciers, snow and lakes, and rainfall and snowmelt sustain rivers and replenish groundwater.
Terrain, soil, vegetation and land use shape how water flows above ground. Healthy rivers, lakes and wetlands sustain biodiversity and support our economy, health and wellbeing.
Groundwater is freshwater stored underground. Water drains from the surface through the soil, filling spaces in soil and rock, and collecting in aquifers.
As groundwater moves slowly through underground pathways, it helps maintain river flows, but this slow pace also delays the movement of contaminants for many years.
Groundwater feeds rivers, lakes and wetlands, maintaining base flow.
Surface water is lost to the ground, reducing base flow.
Healthy groundwater keeps river flows steady and provides reliable water for communities, especially during dry periods.
We get our drinking water from surface water and groundwater. Because these sources constantly exchange, groundwater plays a vital but mostly hidden role in our drinking water.

Our freshwater.
Water moves through the landscape as a system, so changes in one place affect other areas connected by the flow of water.
Freshwater flows above ground in rivers, lakes and wetlands, and below ground as groundwater – our hidden resource.
Freshwater is stored in glaciers, snow and lakes, and rainfall and snowmelt sustain rivers and replenish groundwater.
Terrain, soil, vegetation and land use shape how water flows above ground. Healthy rivers, lakes and wetlands sustain biodiversity and support our economy, health and wellbeing.
Groundwater is freshwater stored underground. Water drains from the surface through the soil, filling spaces in soil and rock, and collecting in aquifers.
As groundwater moves slowly through underground pathways, it helps maintain river flows, but this slow pace also delays the movement of contaminants for many years.
Groundwater feeds rivers, lakes and wetlands, maintaining base flow.
Surface water is lost to the ground, reducing base flow.
Healthy groundwater keeps river flows steady and provides reliable water for communities, especially during dry periods.
We get our drinking water from surface water and groundwater. Because these sources constantly exchange, groundwater plays a vital but mostly hidden role in our drinking water.
The water that moves through our landscape is part of one large, interconnected system. From its source as rain or snowfall, freshwater flows across and into the ground, into streams and rivers, and into lakes and wetlands, until it reaches the sea. Changes to one part of this system will affect the others as the water flows between them (Salmond et al., 2019).
The journey of water can be rapid, or it can take years or even decades to move through the system. Pressures on the landscape from human activities can affect freshwater sources and flows for long periods of time.
Human activities are affecting how much freshwater is available and how it moves through the environment. Water use for agriculture, towns and cities, and electricity generation influences the levels and flow of groundwater and surface water. Sedimentation and erosion can increase with changes in land use. Climate change is also reshaping the freshwater system through changing rainfall patterns and flow rates.
The connections between different parts of the freshwater system mean that pressures in one part can affect the others. Changes to water stores such as glaciers and groundwater can alter the amount of water flowing down our streams and rivers. These upstream changes affect the mauri (life force) and flow of downstream environments.
Human activities – including land-use intensification, irrigation, water takes and river engineering – are changing levels and flows in groundwater and surface waters. Water extraction for agricultural and urban use reduces the amount of water in rivers, lakes and groundwater. More intensive use of agricultural land often requires increased irrigation, with most of this water taken from rivers and lakes. Hydroelectric generation, dams, diversions and stopbanks change the natural flow of rivers, which has impacts on freshwater ecosystems.

Image: Data source: Stats NZ
A grouped bar chart that shows the total irrigated land area in thousands of hectares for 2002, 2017 and 2022. The bars are coloured to show years, and grouped according to dominant farm type, including ‘dairy, sheep, beef and other livestock’; ‘fruit, grain and vegetable’; and ‘other’. The scale ranges from 0 to 400,000 hectares. More information is available from the Stats NZ indicator page Irrigated land: Data to 2022.
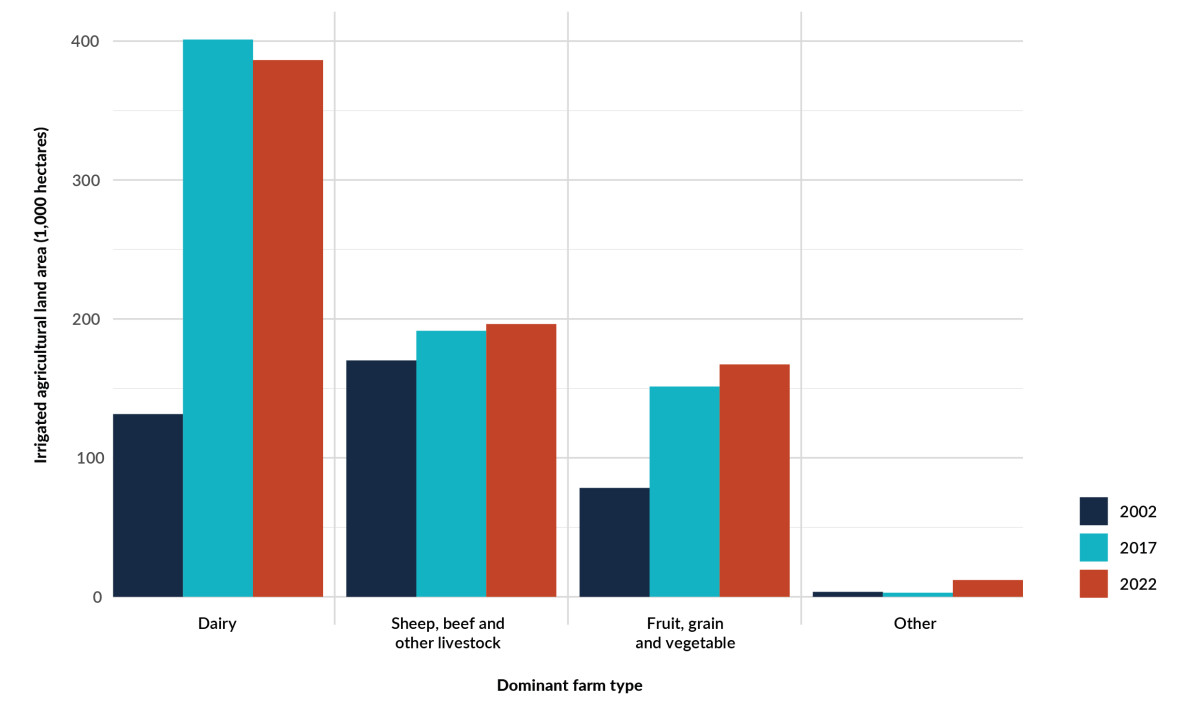
The way water moves through a catchment is shaped by the physical features of the landscape, such as slope, geology, soils and rainfall patterns. These characteristics determine how fast water runs off, how much water is absorbed into the ground and how easily sediment is mobilised. Human activities such as farming, forestry, and urban development interact with these natural features and can accelerate or reduce the movement of water and sediment.
The climate strongly influences the freshwater system. Global weather patterns drive how much rain we get, and when and where it falls. Climate change is altering the sources and the flows of freshwater, both above and below ground. The resulting changes to the freshwater system will have wide-ranging impacts. More extreme rainfall and flooding, along with higher temperatures and drier conditions, will alter flow rates and freshwater environments. Sealevel rise can result in saltwater pushing into coastal aquifers.

Image: Data source: Stats NZ, using data from regional councils, unitary authorities and Earth Sciences New Zealand
A map of New Zealand showing the average rate of change in chloride concentrations in groundwater across three different aquifer types, from 2004 to 2024. The aquifer types include basement infill, coastal, and inland. Points on the map are coloured according to a scale representing the change in chloride concentrations in milligrams per litre per year. The scale ranges from -24.3600 mg/L per year (blue) to 42.2210 mg/L per year (red). More information is available from the Stats NZ indicator page Groundwater quality: Data to 2024.
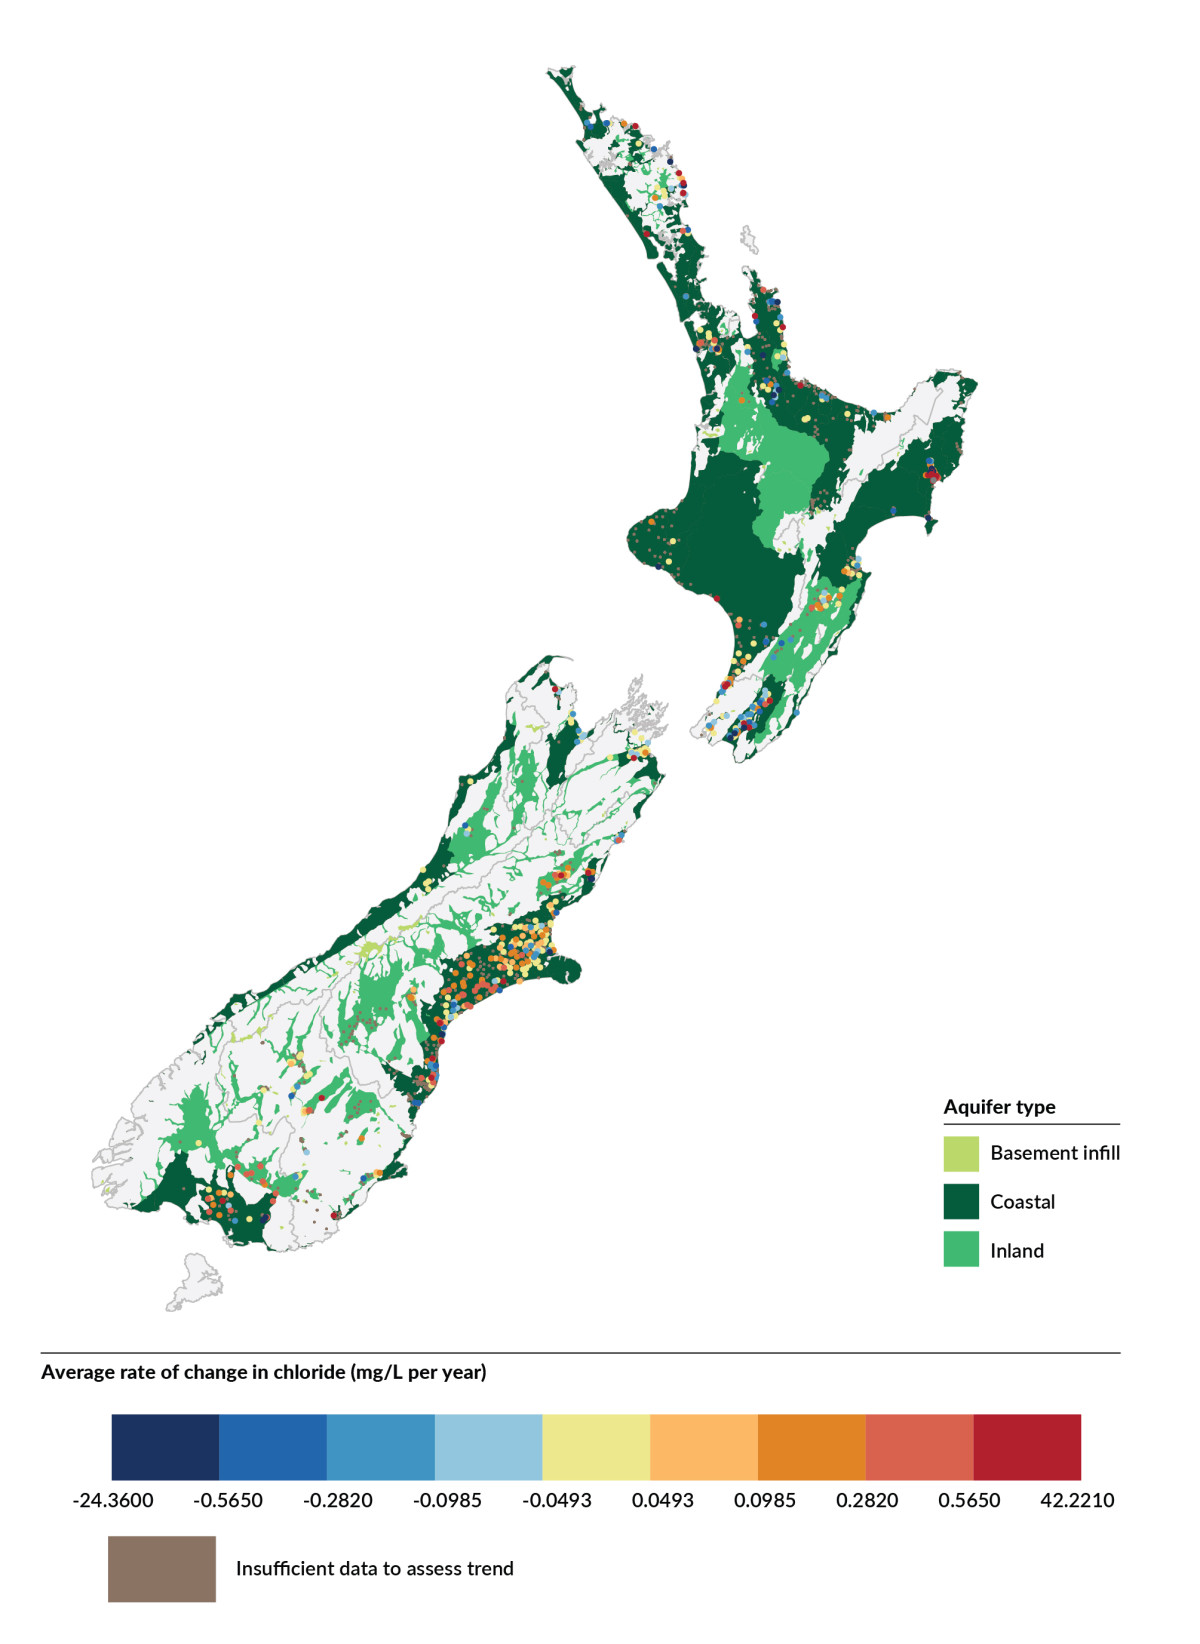
The interconnected nature of the freshwater system means that impacts on water quality in one domain can be felt in others. The slow-moving nature of groundwater also results in effects that can be seen for long time periods.
As freshwater flows ki uta ki tai (from the mountains to the sea), passing through rivers and wetlands, its mauri (life force) is carried along this journey, reflecting the health of the catchment. Disturbance to mauri at any point – through pollution, degradation or overuse – can affect the wider catchment system and overall health of the water.
The major impacts on freshwater quality come from run-off and leaching (draining) of nutrients and contaminants, and from sediment. Excess nutrients originate mainly from agricultural land use, and contaminants and waste come from both urban and rural areas. These wash from the land into our waterways, sometimes attached to sediment, and can accumulate in groundwater. The impacts of some of these processes may be intensified by climate change.
Nitrogen and phosphorus are naturally occurring nutrients, but excess amounts from fertiliser use and livestock can wash into waterways and degrade water quality. Long‑term trends show that phosphorus levels in rivers and lakes are improving in more places than they are worsening, while nitrogen trends are more mixed, with similar numbers of sites improving and worsening. One form of nitrogen, nitrate, can leach into groundwater and persist for many years, continuing to affect connected surface waters. Elevated nutrient levels can transform freshwater ecosystems, degrading habitats and directly and indirectly harming species (see section 3 for detail on how excess nutrients affect ecosystems). Excess nutrients can also pose risks to human health (see section 4 for detail on how nitrate affects drinking water quality).

Image: Data source: Stats NZ, using data from regional councils, unitary authorities and Earth Sciences New Zealand
A map of New Zealand showing the average rate of change in nitrate concentrations in groundwater across three different aquifer types, from 2004 to 2024. The aquifer types include basement infill, coastal, and inland. Points on the map are coloured according to a scale representing the change in nitrate concentrations in milligrams per litre per year. The scale ranges from -0.6410 mg/L per year (blue) to 0.9410 mg/L per year (red). More information is available from the Stats NZ indicator page Groundwater quality: Data to 2024.
Contaminants and waste from human activities in both urban and rural areas flow from the land into rivers, lakes and groundwater. These can include harmful chemicals (including pharmaceuticals), heavy metals, litter and microplastics (very small plastic particles). Water treatment does not always remove all contaminants effectively from wastewater, and this is often a pathway for contaminants to enter freshwater.
When soil or rock washes off the land, it enters waterways as sediment. Although sedimentation is a natural process, it can be increased by human activities and land uses. Excess sediment affects freshwater environments, and it also carries nutrients and contaminants into waterways, which can degrade water quality.
Freshwater gives life to the land. Changes in water sources, flows and quality affect the species, habitats and ecosystems that depend on the freshwater system (including humans, as discussed in section 4). Because water moves through rivers, lakes, wetlands and groundwater as one connected network, changes in one part of the system can have far-reaching ecological effects elsewhere.
Groundwater is an important part of this freshwater system. Its condition influences the health of connected rivers, lakes and wetlands, and it also supports unique ecosystems of its own. Most ecological data, however, relate to surface water ecosystems, as they are more accessible for monitoring.
To help us understand this system-wide view, many cultural monitoring frameworks use mātauranga Māori (Māori knowledge) of certain tohu (environmental indicators), such as mauri (life force) or the health of tuna (eels), as an indicator for wider ecosystem health. Through Māori monitoring frameworks, we can see how changes to one aspect of a catchment can have flow-on effects on the wider ecosystem (Hopkins, 2018).
River and lake ecosystems can be transformed by excess nutrients and invasions of pest species. The habitats that native species depend on are also altered by erosion, sediment and land-use change. On top of this, a changing climate is bringing further changes to flow rates and water temperature, and sea-level rise is pushing saltwater further inland. Indigenous species and the unique habitats they depend on for survival are under threat from these changes.
Human impacts can disrupt the life cycles of species that live in and around freshwater, as well as disrupting the interactions between them. Nutrients such as nitrogen and phosphorus that wash into waterways can degrade water quality, affecting ecosystems in many of our lakes, rivers, wetlands and estuaries. Introduced species also affect freshwater ecosystems, leading to declines in some native species.
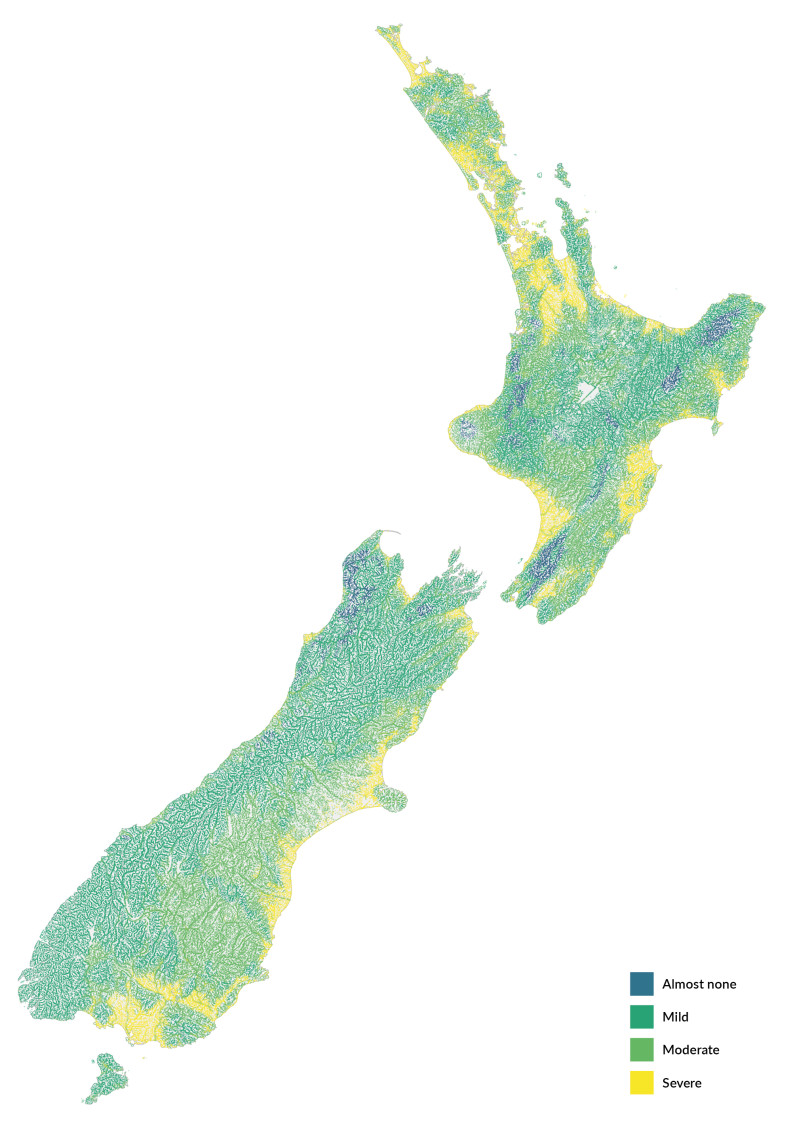
A map of New Zealand showing modelled macroinvertebrate community index (MCI) scores for rivers, in 2020-2024. The map is coloured according to the amount of nutrient enrichment and organic pollution indicated by the MCI scores. The scale ranges from Almost none (blue) to Severe (yellow). More information is available from the Stats NZ indicator page River water quality – macroinvertebrate community index: Data to 2024.

A map of New Zealand showing modelled macroinvertebrate community index (MCI) scores for rivers, in 2020-2024. The map is coloured according to the amount of nutrient enrichment and organic pollution indicated by the MCI scores. The scale ranges from Almost none (blue) to Severe (yellow). More information is available from the Stats NZ indicator page River water quality – macroinvertebrate community index: Data to 2024.
Native freshwater species depend on specific habitats to survive and flourish. Human modification of the landscape has increased the amount of sediment washing into our waterways (see section 2). Climate change is projected to increase the amount of overall sedimentation (see section 1). In most of our rivers, sediment poses a low or moderate risk to freshwater life, and river habitat condition remains good, though many areas, including wetlands, are under pressure.
1 Eveleens et al. (2025) updates the information in the current version of the Stats NZ Freshwater physical habitat indicator, published in April 2020. The data from Eveleens et al. will be incorporated into the next indicator update, but the statistics published in the updated web page may differ due to methodological (or other) differences.
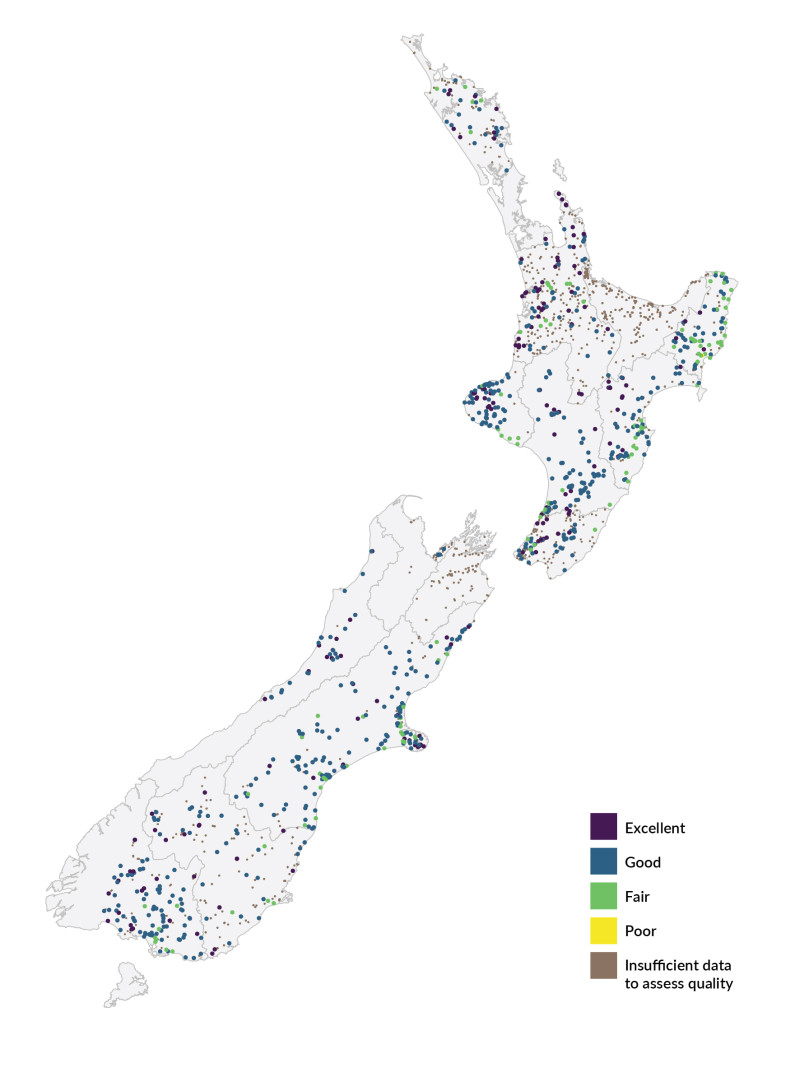
Image: Data source: Cawthron Institute, via regional councils and unitary authorities
A map of New Zealand showing measured river habitat quality scores for sites across the country. Sites are represented by points coloured according to quality scores. The scale ranges from Excellent (purple) to Poor (yellow), also displaying sites that had Insufficient data to assess quality (brown).
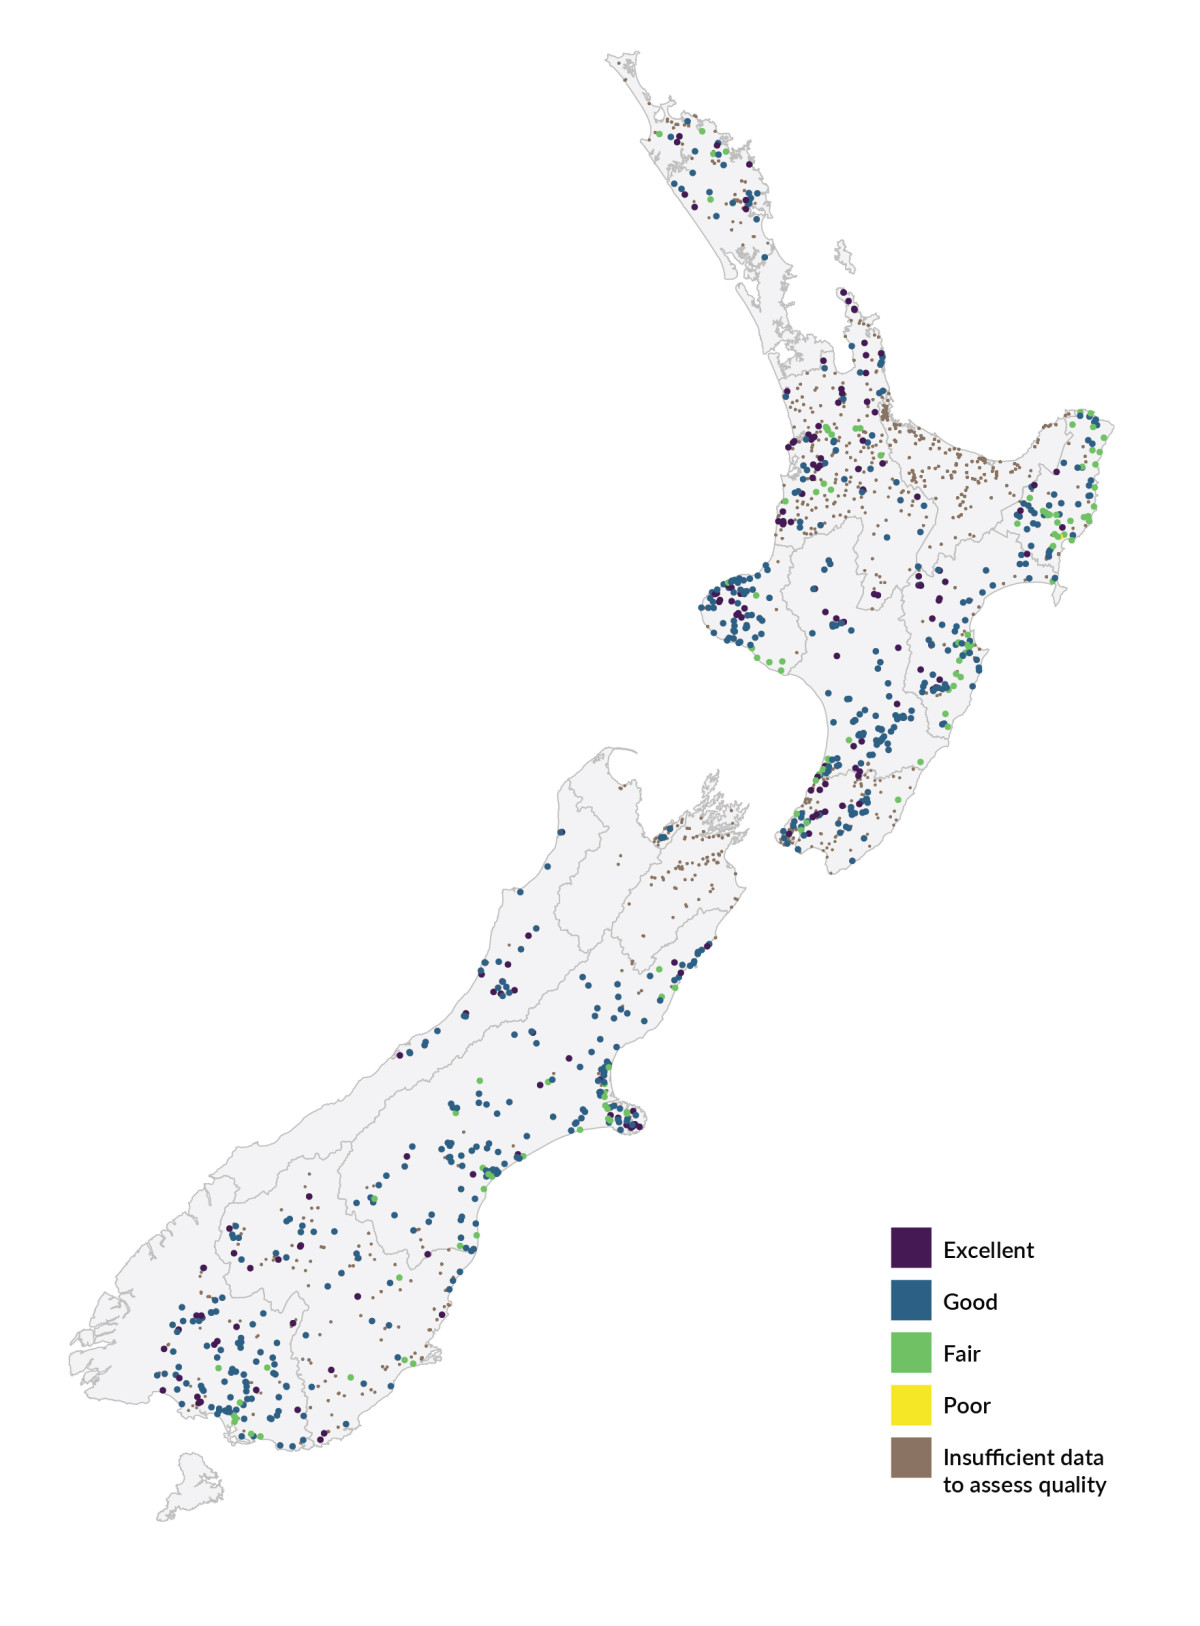

Image: Data source: Stats NZ, using data from Bioeconomy Science Institute
A map of New Zealand showing the change in wetland area for areas across the country, between 1996 and 2023. 4,320-hectare areas are represented by hexagons coloured to show the amount of wetland area lost. The scale ranges from 0-1 hectares lost (yellow) to greater than 100 hectares lost (dark orange). More information is available from the Stats NZ indicator page Wetland area: Data to 2023.
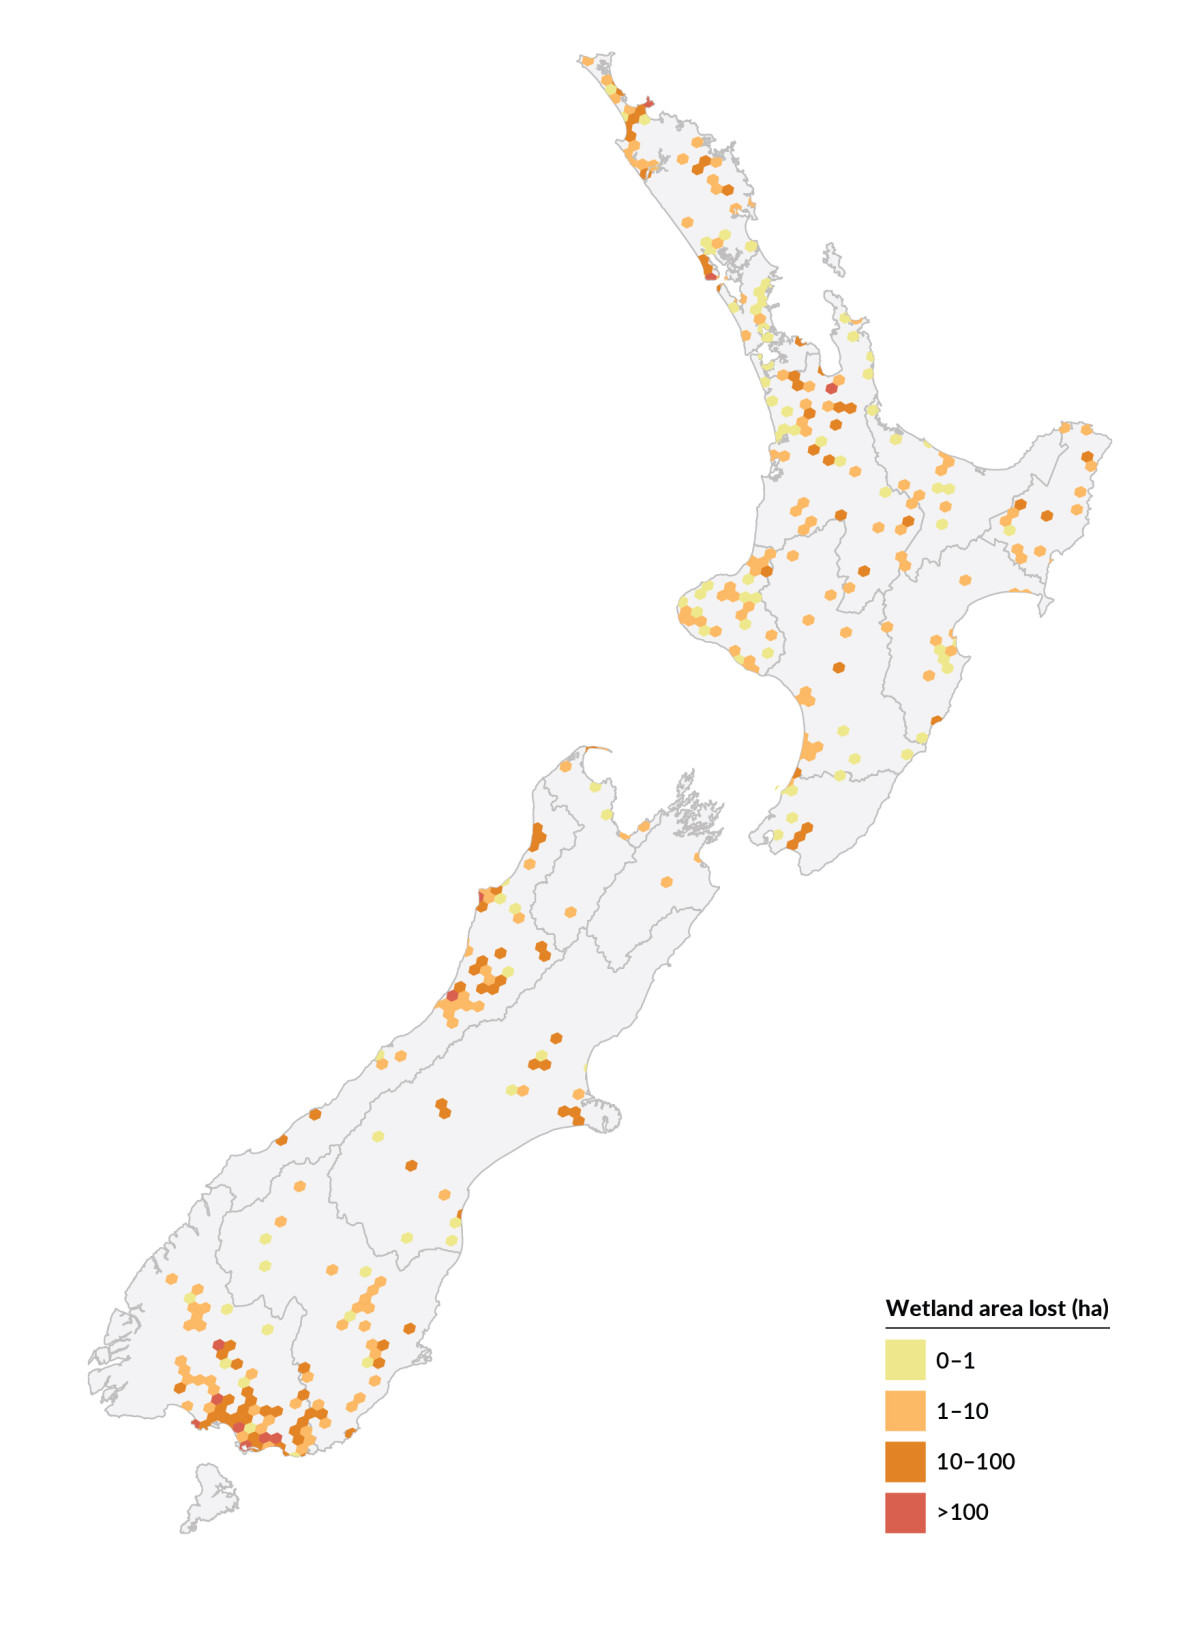
Freshwater ecosystems are home to many unique native plants and animals. Many of these species are classified as threatened with extinction or at risk of becoming threatened. Groundwater supports thriving ecosystems, with unique species living in our aquifers. The health of these ecosystems underpins the functioning of lake and river environments, where many species of fish, birds, invertebrates and plants are under threat.
The impacts of climate change on the freshwater system will make things more difficult for many of our indigenous species. Changes to water flows, along with higher temperatures, may cause native species to lose more of their habitats. Sea-level rise will push saltwater further inland, reducing freshwater habitats and reshaping tidal zones.
Our health, wellbeing and livelihoods are closely tied to the health of our freshwater. People and communities rely on freshwater for drinking, household supply, recreation and cultural practice. Water quality directly affects whether freshwater can be safely used for these purposes.
In te ao Māori (the Māori worldview), water with healthy mauri (life force) – such as wai ora (life-giving water) and wai māori (freshwater) – supports life, connection and identity. When mauri is degraded to states such as wai kino (polluted water) or wai mate (dead water), many activities that sustain cultural practice, intergenerational knowledge and community are disrupted.
Freshwater also underpins much of Aotearoa New Zealand’s economy. Agriculture, energy generation, tourism and many local industries depend on reliable flows and good water quality. When freshwater systems change, these sectors can face reduced productivity, increased costs or interruptions to essential services.
Nearly half the New Zealand population relies on groundwater for drinking. This creates health risks when groundwater becomes contaminated by nitrate, chemicals or pathogens. Public supplies are treated and typically show low contaminant concentrations, but private selfsupplies, shallow bores and small schemes face higher risk where protection and treatment are limited. More frequent extreme weather events and rising temperatures from climate change are expected to increase contamination risks.
Clean, safe water underpins recreation and community wellbeing. Pathogens and toxic algae can cause illness through recreational contact and eating contaminated food. Unsafe contamination levels and degraded ecosystems mean swimming sites close and food gathering is constrained, with health, amenity and cultural consequences.

A map of New Zealand showing modelled river suitability for swimming based on E. coli National Objective Framework (NOF) bands indicating average Campylobacter infection risk for rivers, in 2020-2024. The map is coloured according to the predicted average Campylobacter infection risk. The scale ranges from less than or equal to 1 percent (purple) to greater than 7 percent (yellow). Predicted risks less than or equal to 3 percent are indicated as suitable, and above 3 percent are indicated as not suitable. More information is available from the Stats NZ indicator page River water quality – E. coli: Data to 2024, and National Policy Statement for Freshwater Management 2020 Amended December 2025.
A map of New Zealand showing modelled river suitability for swimming based on E. coli National Objective Framework (NOF) bands indicating average Campylobacter infection risk for rivers, in 2020-2024. The map is coloured according to the predicted average Campylobacter infection risk. The scale ranges from less than or equal to 1 percent (purple) to greater than 7 percent (yellow). Predicted risks less than or equal to 3 percent are indicated as suitable, and above 3 percent are indicated as not suitable. More information is available from the Stats NZ indicator page River water quality – E. coli: Data to 2024, and National Policy Statement for Freshwater Management 2020 Amended December 2025.
Degraded ecosystems and the threatened loss of native species impact wellbeing and the intrinsic connection many Māori have with te taiao (the environment) and associated mātauranga Māori (Māori knowledge). When freshwater environments are degraded and species are lost, the knowledge and cultural practices associated with them are also put at risk. An inability to gather food, practice traditional healing or connect with te taiao means that the language, knowledge and tikanga (customs and protocols) associated with these activities can be hard to access and at risk of being lost. The need to protect freshwater environments is leading to a revitalisation of some cultural monitoring practices.
Freshwater underpins drinking water supply, agriculture, industrial processes, hydropower generation and tourism. When water quality declines or becomes more variable, the economic costs can be substantial. These costs arise from higher treatment requirements, infrastructure failures, constraints on supply and production, and lost recreational or tourism opportunities. Climate change magnifies these pressures by altering water flows and affecting quality, and rising seas can increase flood risk and impact coastal groundwater supplies and infrastructure.
This section summarises the key areas where there is a need for better information, clearer visibility and more joined-up tools to support long-term freshwater stewardship. The themes reflect where evidence gaps currently limit understanding, where pressures are hard to detect and where better data or modelling would materially improve environmental reporting across Aotearoa New Zealand.
Many of the pressures affecting freshwater are not visible without targeted monitoring. Groundwater – despite supplying a large share of drinking water and sustaining rivers, wetlands and springs – remains the least understood part of the system. We also lack visibility of contaminant peaks that occur during storms or shortly after land-use changes (United Nations, 2022).
Several insights emerged, as outlined below.
A clearer view of these ‘invisible’ parts of the system would help New Zealand describe environmental change more accurately and understand linkages across rivers, lakes, wetlands and aquifers.
There are several high-value gaps where limited evidence constrains national reporting and understanding – particularly related to groundwater. These are not exhaustive but represent the areas most frequently highlighted across the sections of this report.
System-wide challenges exist in freshwater modelling, data access and consistency, concerns also raised by the Parliamentary Commissioner for the Environment (PCE, 2024, 2025), with the following key insights.
There are opportunities to improve coherence through standardisation of inputs and outputs, shared comparison metrics, and better coordination between local government, researchers, iwi and national agencies (Dost et al., 2026).
Tools such as OVERSEER® continue to support engagement and scenario exploration at farm scale, but catchment-scale modelling would benefit from more consistent foundations (PCE, 2024; Wheeler et al., 2006).
Monitoring programmes are essential for understanding how freshwater is changing. Across this report, several priorities emerged for strengthening national evidence.
One consistent theme in the report is that water availability and water quality pressures are shifting, driven by climate change, land use and coastal processes. The following key insights have emerged.
Describing these hydrological changes more systematically would improve how New Zealand interprets environmental trends and plans for future reporting.
Resilience depends on understanding the processes that produce, store and move water, not just on the volume available today. Changes in recharge, temperature, extreme rainfall, inland flooding, salinity intrusion and contaminant mobility all shape the security of future supplies and the health of freshwater ecosystems (Mourot et al., 2025; University of Auckland, n.d.).
Groundwater provides delayed but essential signals of long-term pressure. Reductions in aquifer levels, rising nitrate, and emerging contaminants can take years to affect connected waters at the surface. Making these pressures visible is critical for environment reporting and for maintaining the resilience of communities, water infrastructure and ecosystems (Madani, 2026).
Listed below are the environmental indicators incorporated in this report, including 12 indicators updated since the release of Our freshwater 2023 shown in bold.
This report was compiled by the Ministry for the Environment and Stats NZ’s Environmental Reporting team.
We would like to thank the following for providing data and advice in the development of indicators used in this report:
We would like to thank the following people and organisations for providing advice and helping to shape this report:
We would like to thank the following people and organisations for providing advice and critical review of this report:
The infographic (page 11) was created by Dumpark Information Design.
Alderton, I., Palmer, B. R., Heinemann, J. A., Pattis, I., Weaver, L., Gutiérrez-Ginés, M. J., Horswell, J., & Tremblay, L. A. (2021). The role of emerging organic contaminants in the development of antimicrobial resistance. Emerging Contaminants, 7, 160–171. https://doi.org/10.1016/j.emcon.2021.07.001
Avendaño, F., Horne, D., Singh, R., Palmer, A., Cichota, R., & Bloomer, D. (2025). Quantification of nitrate-N losses under intensive vegetable production systems in New Zealand. New Zealand Journal of Crop and Horticultural Science, 53(5), 3091–3112. https://doi.org/10.1080/01140671.2025.2526836
Aves, A., Ruffell, H., Evangeliou, N., Gaw, S., & Revell, L. E. (2024). Modelled sources of airborne microplastics collected at a remote Southern Hemisphere site. Atmospheric Environment, 325, 120437. https://doi.org/10.1016/J.ATMOSENV.2024.120437
Awatere, S., King, D. N., Reid, J., Williams, L., Masters-Awatere, B., Harris, P., Tassell-Matamua, N., Jones, R., Eastwood, K., Pirker, J., & Jackson, A.-M. (2021). He huringa āhuarangi, he huringa ao: a changing climate, a changing world. Manaaki Whenua – Landcare Research. https://www.landcareresearch.co.nz/assets/researchpubs/He-huringa-ahuarangi-he-huringa-ao-a-changing-climate-a-changing-world.pdf
Awatere, S. I., Harmsworth, G., Harcourt, N., Taura, Y., Taylor, L., Wilcox, M., & Hyslop, J. (2023). Whakamana te tangata – ka whai oranga te taiao: Indigenous led approaches for catchment health in Aotearoa-New Zealand. PLOS Water, 2(12), e0000170. https://doi.org/10.1371/journal.pwat.0000170
Ayele, G. T., Yu, B., Bruere, A., & Hamilton, D. P. (2023). Response of streamflow and nutrient loads in a small temperate catchment subject to land use change. Environmental Monitoring and Assessment, 195, 1418. https://doi.org/10.1007/s10661-023-11828-z
Baker C. F., Jowett I. G., & Allibone R. M. (2003). Habitat use by non-migratory Otago galaxiids and implications for water management (Science for Conservation 221). Department of Conservation. https://www.doc.govt.nz/globalassets/documents/science-and-technical/sfc221.pdf
Banasiak, L., & Close, M. (2025). 2022 National Survey of Emerging Organic Contaminants (EOCs) in Groundwater. New Zealand Institute for Public Health and Forensic Science. https://contentapi.datacomsphere.com.au/v1/h%3Aes/repository/libraries/
id:26gi9ayo517q9stt81sd/files/id:2uuuiyxow1cxbyf3t0su
Basher, L. R. (2013). Erosion processes and their control in New Zealand. In J. R. Dymond (Ed.), Ecosystem Services in New Zealand: Conditions and Trends (pp. 363–374). Manaaki Whenua Press. https://www.landcareresearch.co.nz/assets/Publications/Ecosystem-services-in-New-Zealand/2_7_Basher.pdf
Basher, L. R., & Ross, C. W. (2002). Soil erosion rates under intensive vegetable production on clay loam, strongly structured soils at Pukekohe, New Zealand. Australian Journal of Soil Research, 40(6), 947–961. https://doi.org/10.1071/SR01116
Basher, L. R., Hicks, D. M., Clapp, B., & Hewitt, T. (2011). Sediment yield response to large storm events and forest harvesting, Motueka River, New Zealand. New Zealand Journal of Marine and Freshwater Research, 45(3), 333–356. https://doi.org/10.1080/00288330.2011.570350
Baso, N. C., Bownes, A., Hill, M., & Coetzee, J. A. (2025). Modelling the distribution of a submerged invasive macrophyte and its potential biological control agent in invaded ranges. Hydrobiologia, 852, 3661–3672. https://doi.org/10.1007/s10750-025-05835-z
Bennett, A. (2025). Te Mana o Te Wai: new concept, old words for governing freshwater in Aotearoa New Zealand. MAI Journal, 14(2), 238–250. https://doi.org/10.20507/MAIJOURNAL.2025.14.2.10
Bioeconomy Science Institute. (n.d.). Braided riverbeds. Retrieved March 20, 2026, from https://www.landcareresearch.co.nz/publications/naturally-uncommon-ecosystems/inland-and-alpine/braided-riverbeds
Bloomberg, M., Cairns, E., Du, D., Palmer, H., & Perry, C. (2019). Alternatives to clearfelling for harvesting of radiata pine plantations on erosion-susceptible land. New Zealand Journal of Forestry, 64(3), 33–39. https://nzif.org.nz/nzif-journal/publications/downloadfulltext/23029
Boahen, E., Owusu, L., & Adjei-Anim, S. O. (2025). A comprehensive review of emerging environmental contaminants of global concern. Discover Environment, 3, 144. https://doi.org/10.1007/s44274-025-00259-x
Bodeker, G., Cullen, N., Katurji, M., McDonald, A., Morgenstern, O., Noone, D., Renwick, J., Revell, L., & Tait, A. (2022). Aotearoa New Zealand climate change projections guidance: Interpreting the latest IPCC WG1 report findings. Ministry for the Environment. https://environment.govt.nz/assets/publications/Climate-Change-Projections-Guidance-FINAL.pdf
Boehler, S., Strecker, R., Heinrich, P., Prochazka, E., Northcott, G. L., Ataria, J. M., Leusch, F. D. L., Braunbeck, T., & Tremblay, L. A. (2017). Assessment of urban stream sediment pollutants entering estuaries using chemical analysis and multiple bioassays to characterise biological activities. Science of the Total Environment, 593–594, 498–507. https://doi.org/10.1016/j.scitotenv.2017.03.209
Booker, D. J., & Whitehead, A. L. (2022). River water temperatures are higher during lower flows after accounting for meteorological variability. River Research and Applications, 38(1), 3–22. https://doi.org/10.1002/RRA.3870
Booker, D. J., Rajanayaka, C., Smith, R., Yang, J., & Kees, L. (2024). Assessment of freshwater quantity allocation and use: Analysis of current state, stocktake of data availability, and recommendations as of 2024. Ministry for the Environment. https://environment.govt.nz/assets/publications/Freshwater/assessment-of-freshwater-quantity-allocation-and-use.pdf
Bosserelle, A. L., & Hughes, M. W. (2024a). Groundwater monitoring infrastructure: Evaluation of the shallow urban and coastal network in Ōtautahi Christchurch. Journal of Hydrology: Regional Studies, 55, 101934. https://doi.org/10.1016/J.EJRH.2024.101934
Bosserelle, A. L., & Hughes, M. W. (2024b). Practitioner perspectives on sea-level rise impacts on shallow groundwater: Implications for infrastructure asset management and climate adaptation. Urban Climate, 58, 102195. https://doi.org/10.1016/J.UCLIM.2024.102195
Brierley, G., Fuller, I., Williams, G., Hikuroa, D., & Tilley, A. (2022). Re-imagining wild rivers in Aotearoa New Zealand. Land, 11(8), 1272. https://doi.org/10.3390/land11081272
Brierley, G. J., Hikuroa, D., Fuller, I. C., Tunnicliffe, J., Allen, K., Brasington, J., Friedrich, H., Hoyle, J., & Measures, R. (2023). Reanimating the strangled rivers of Aotearoa New Zealand. Wiley Interdisciplinary Reviews: Water, 10(2) e1624. https://doi.org/10.1002/wat2.1624
Burge, O. R., Law, R., & Wakefield, S. (2025). A spatial layer of human terrestrial pressures for New Zealand. New Zealand Journal of Ecology, 49(1), 3580. https://doi.org/10.20417/nzjecol.49.3580
Burge, O. R., Price, R., Wilmshurst, J. M., Blyth, J. M., & Robertson, H. A. (2023). LiDAR reveals drainage risks to wetlands have been under-estimated. New Zealand Journal of Ecology, 47(1), 3523. https://doi.org/10.20417/nzjecol.47.3523
Burns, C. W., Rees, A., & Wood, S. A. (2024). Predicting distribution and establishment of two invasive alien Daphnia species in diverse lakes in New Zealand–Aotearoa. Biological Invasions, 26, 2723–2736. https://doi.org/10.1007/S10530-024-03342-1
Cameron, N. A., & Peer, R. A. M. (2025). Quantifying water use in New Zealand’s dairy food system: A baseline for future sustainability. Agricultural Systems, 225, 104272. https://doi.org/10.1016/J.AGSY.2025.104272
Canning, A. D., & Death, R. G. (2023). Establishing riverine nutrient criteria using individual taxa thresholds. Water Research, 246, 120731. https://doi.org/10.1016/J.WATRES.2023.120731
Canning, A. D., Zammit, C., & Death, R. G. (2025). The implications of climate change for New Zealand’s freshwater fish. Canadian Journal of Fisheries and Aquatic Sciences, 82, 1–15. https://doi.org/10.1139/CJFAS-2024-0127
Carr, E., Stevens, S., Kay, T., & Joy, M. (2024). Too many cows? An exploration of relationships between livestock density and river water quality in Aotearoa New Zealand. Policy Quarterly, 20(4), 131–138. https://doi.org/10.26686/PQ.V20I4.9630
Chakravarthy, K., Charters, F., & Cochrane, T. A. (2019). The impact of urbanisation on New Zealand Freshwater Quality. Policy Quarterly, 15(3), 17–21. https://doi.org/10.26686/pq.v15i3.5683
Challies, E., Fragaszy, S., & Rouillard, J. (2022). Water allocation in Aotearoa New Zealand: societal values and ecological bottom lines. In J. Rouillard, C. Babbitt, E. Challies, & J.-D. Rinaudo (Eds.), Water Resources Allocation and Agriculture: Transitioning from Open to Regulated Access (pp. 129–141). IWA Publishing. https://doi.org/10.2166/9781789062786_0129
Chambers, L. A., Hemmings, B., Cox, S. C., Moore, C., Knowling, M. J., Hayley, K., Rekker, J., Mourot, F. M., Glassey, P., & Levy, R. (2023). Quantifying uncertainty in the temporal disposition of groundwater inundation under sea level rise projections. Frontiers in Earth Science, 11, 1111065. https://doi.org/10.3389/feart.2023.1111065
Chambers, T., Douwes, J., Mannetje, A., Woodward, A., Baker, M., Wilson, N., & Hales, S. (2022). Nitrate in drinking water and cancer risk: the biological mechanism, epidemiological evidence and future research. Australian and New Zealand Journal of Public Health, 46(2), 105–108. https://doi.org/10.1111/1753-6405.13222
Christchurch City Council. (2023). Groundwater quality and quantity annual report 2022. https://ccc.govt.nz/assets/Documents/Environment/Water/CSNDC-Annual-Reports/2023/Appendix-E-Annual-Groundwater-Report-July-2023.PDF
Clapcott, J., Hoani-Waaka, A., Kitson, J., Baker, M., Eveleens, R. A., & Tadaki, M. (2025). Out of sync: Transforming environmental monitoring through Indigenous perspectives of time. Earth Stewardship, 2(3), e70021. https://doi.org/10.1002/EAS2.70021
Clarkson, B., Ausseil, A.-G., & Gerbeaux, P. (2013). Wetland ecosystem services. In J. R. Dymond (Ed.), Ecosystem Services in New Zealand: Conditions and Trends (pp. 192–202). Manaaki Whenua Press. http://www.researchgate.net/profile/Anne-Gaelle_Ausseil/publication/260436894_Wetland_ecosystem_services/links/00b495314e583617c5000000.pdf
Close, M. E., & Banasiak, L. (2023a). National survey of pesticides in groundwater 2022. Institute of Environmental Science and Research. https://www.knowledgeauckland.org.nz/publications/national-survey-of-pesticides-in-groundwater-2022/
Close, M. E., & Banasiak, L. (2023b). National survey of per- and polyfluoroalkyl substances (PFAS) in groundwater 2022. Institute of Environmental Science and Research. https://www.esr.cri.nz/digital-library/national-survey-of-per-and-polyfluoroalkyl-substances-pfas-in-groundwater-2022/
Close, M. G. (2024). Determining nitrate tolerances of Canterbury stygofauna. Master’s thesis, University of Canterbury. UC Library. https://doi.org/10.26021/15479
Collier, K., Clearwater, S., Harmsworth, G., Taura, Y., & Reihana, K. (2017). Physical and chemical attributes affecting survival and collection of freshwater mahinga kai species (ERI report 106). Environment Research Institute. https://hdl.handle.net/10289/13070
Collins, D., Henderson, R., & Fischer, L. (2021). National hydrological and water resource impacts of climate change: Compilation of outputs (J. Griffiths, Comp.; prepared for the Deep South National Science Challenge). National Institute of Water & Atmospheric Research. https://deepsouthchallenge.co.nz/wp-content/uploads/2022/03/Deep-South-Hydro-Phase-One-output-compilation-Nov2021.pdf
Collins, D., Zammit, C., Willsman, A., & Henderson, R. (2015). Surface water components of New Zealand’s National Water Accounts, 1995–2014. National Institute of Water and Atmospheric Research. https://webstatic.niwa.co.nz/library/CHC2015-013-v2.pdf
Cookson, A. L., Burgess, S., Midwinter, A. C., Marshall, J. C., Moinet, M., Rogers, L., Fayaz, A., Biggs, P. J., & Brightwell, G. (2024). New Campylobacter lineages in New Zealand freshwater: Pathogenesis and public health implications. Environmental Microbiology, 26(12), e70016. https://doi.org/10.1111/1462-2920.70016
Coxon, S. (2024a). Assessment of the presence of pharmaceuticals in, and removal from, municipal wastewater in Aotearoa New Zealand. Institute of Environmental Science and Research. https://www.phfscience.nz/digital-library/assessment-of-the-presence-of-pharmaceuticals-in-and-removal-from-municipal-wastewater-in-aotearoa-new-zealand/
Coxon, S. (2024b). Environmental health report: Review of the potential impacts of climate change on wastewater networks and treatment plants in Aotearoa New Zealand, and implications for public health. Institute of Environmental Science and Research. https://www.phfscience.nz/digital-library/environmental-health-report-review-of-the-potential-impacts-of-climate-change-on-wastewater-networks-and-treatment-plants-in-aotearoa-new-zealand-and-implications-for-public-health/
Coxon, S. (2025). Assessment of the presence of pesticides in, and removal from, municipal wastewater in Aotearoa New Zealand. New Zealand Institute for Public Health and Forensic Science. https://www.phfscience.nz/digital-library/assessment-of-the-presence-of-pesticides-in-and-removal-from-municipal-wastewater-in-aotearoa-new-zealand/
Coxon, S., & Eaton, C. (2023). Review of contaminants of potential human health concern in wastewater and stormwater. Institute of Environmental Science and Research. https://www.phfscience.nz/media/lmljcmuf/esr-environmental-health-report-wastewater-stormwater.pdf
Crawford, R. M. B., Gee, E., Hicks, B., Nolte, D., Dupont, D., & Franklin, P. A. (2025). Accounting for interspecies and intraspecies variation in swimming performance for fish passage solutions. Journal of Applied Ecology, 62(2), 231–241. https://doi.org/10.1111/1365-2664.14828
Cressey, P., & Russell, K. (2024). Health risk assessment: Supporting community recovery from Cyclone Gabrielle – Contamination resulting from flooding events. Institute of Environmental Science and Research. https://www.phfscience.nz/digital-library/health-risk-assessment-supporting-community-recovery-from-cyclone-gabrielle-contamination-resulting-from-flooding-events/
Daughney, C. J., Morgenstern, U., Moreau, M., & McDowell, R. W. (2025). Reference conditions and threshold values for nitrate-nitrogen in New Zealand groundwaters. Journal of the Royal Society of New Zealand, 55(1), 1–31. https://doi.org/10.1080/03036758.2023.2221034
Davies-Colley, R. J., Hughes, A. O., Haddadchi, A., Dymond, J. R., Vale, S. S., & Smith, H. G. (2025). Suspended sediment properties and visual clarity of the Manawatū River, New Zealand. New Zealand Journal of Marine and Freshwater Research, 59(4), 637–658. https://doi.org/10.1080/00288330.2024.2339888
Davis, N. G., Mathers, K. L., Hodson, R., & Matthaei, C. D. (2024). Monthly sampling reveals seasonal fine sediment fluctuations and riverine invertebrate community responses. Science of The Total Environment, 911, 168750. https://doi.org/10.1016/J.SCITOTENV.2023.168750
De Lange, P. J., Gosden, J., Courtney, S. P., Fergus, A. J., Barkla, J. W., Beadel, S. M., Champion, P. D., Hindmarsh-Walls, R., Makan, T., & Michel, P. (2024). Conservation status of vascular plants in Aotearoa New Zealand, 2023 (New Zealand Threat Classification Series 43). Department of Conservation. https://www.doc.govt.nz/globalassets/documents/science-and-technical/nztcs43entire.pdf
Ding, B., Zhang, J., Zheng, P., Li, Z., Wang, Y., Jia, G., & Yu, X. (2024). Water security assessment for effective water resource management based on multi-temporal blue and green water footprints. Journal of Hydrology, 632, 130761. https://doi.org/10.1016/J.JHYDROL.2024.130761
DOC (Department of Conservation). (n.d.-a). Freshwater pests. Retrieved March 20, 2026, from https://www.doc.govt.nz/nature/pests-and-threats/freshwater-pests/
DOC (Department of Conservation). (n.d.-b). Invasive clams. Retrieved March 20, 2026, from https://www.doc.govt.nz/nature/pests-and-threats/freshwater-pests/invasive-clams/
DOC (Department of Conservation). (2020). Survey of New Zealanders 2020. https://www.doc.govt.nz/globalassets/documents/about-doc/role/visitor-research/survey-of-new-zealanders-2020.pdf
Donovan, M. (2022). Modelling soil loss from surface erosion at high-resolution to better understand sources and drivers across land uses and catchments; a national-scale assessment of Aotearoa, New Zealand. Environmental Modelling and Software, 147, 105228. https://doi.org/10.1016/j.envsoft.2021.105228
Dost, K., Muraoka, K., Ausseil, A.-G., Benavidez, R., Blue, B., Conland, N., Daughney, C., Semadeni-Davies, A., Hoang, L., Hooper, A., Kpodonu, T. A., Marapara, T., McDowell, R., Nguyen, T., Nguyet, D. A., Norton, N., Özkundakci, D., Pearson, L., Rolinson, J., … Wicker, J. (2026). Freshwater modeling in Aotearoa New Zealand: Current practice and future directions. Environmental Modelling and Software, 197, 106820. https://doi.org/10.1016/j.envsoft.2025.106820
Dudley, B. D., McKenzie, A., Diamond, J. S., & Hill, A. F. (2025). Complementary precipitation isotope models reveal young and new water fractions in New Zealand rivers. Hydrological Processes, 39(9), e70265. https://doi.org/10.1002/HYP.70265
Dumont, M., Etheridge, Z., & McDowell, R. W. (2024). Determining the likelihood and cost of detecting reductions of nitrate-nitrogen concentrations in groundwater across New Zealand. Science of the Total Environment, 927, 171759. https://doi.org/10.1016/J.SCITOTENV.2024.171759
Dunn, N. R., Closs, G. P., Crow, S. K., David, B. O., Goodman, J. M., Griffiths, M., Hicks, A. S., Hickford, M. J. H., Jack, D. C., Kitson, J. C., Ling, N., Waters, J. M., Wylie, M. J., Hitchmough, R. A., & Makan, T. (2025). Conservation status of New Zealand freshwater fishes, 2023 (New Zealand Threat Classification Series 46). Department of Conservation. https://www.doc.govt.nz/globalassets/documents/science-and-technical/nztcs46.pdf
Durie, M. (1998). Whaiora: Māori health development (2nd ed.). Oxford University Press.
Dussaillant, I., Hugonnet, R., Huss, M., Berthier, E., Bannwart, J., Paul, F., & Zemp, M. (2025). Annual mass change of the world’s glaciers from 1976 to 2024 by temporal downscaling of satellite data with in situ observations. Earth System Science Data, 17(5), 1977–2006. https://doi.org/10.5194/essd-17-1977-2025
Dymond, J. R., Daigneault, A. J., Burge, O. R., Tanner, C. C., Carswell, F. E., Greenhalgh, S., Ausseil, A.-G. E., Mason, N. W. H., & Clarkson, B. R. (2023). Searching for balance between hill country pastoral farming and nature. Land, 12(8), 1482. https://doi.org/10.3390/land12081482
Dymond, J. R., Sabetizade, M., Newsome, P. F., Harmsworth, G. R., & Ausseil, A. G. (2021). Revised extent of wetlands in New Zealand. New Zealand Journal of Ecology, 45(2), 3444. https://dx.doi.org/10.20417/nzjecol.45.32
EHINZ (Environmental Health Intelligence New Zealand). (2024). Notifications of potentially waterborne diseases. Retrieved 20 March 2026, from https://ehinz.ac.nz/assets/Surveillance-reports/Released_2024/Notifications-of-potentially-waterborne-diseases.pdf
EHINZ (Environmental Health Intelligence New Zealand). (2025). Cyanobacteria at recreational bathing sites. https://ehinz.ac.nz/assets/Surveillance-reports/Released_2025/RecBathing2024_cyanobacteria-supp.pdf
Elliott, A. H., Alexander, R. B., Schwarz, G. E., Shankar, U., Sukias, J. P. S., & McBride, G. B. (2005). Estimation of nutrient sources and transport for New Zealand using the hybrid mechanistic-statistical model SPARROW. Journal of Hydrology (NZ), 44(1), 1–27. https://www.researchgate.net/publication/288704590_Estimation_of_nutrient_sources_and_
transport_for_New_Zealand_using_the_hybrid_mechanistic-statistical_model_SPARROW
Elliott, A. H., Graham, S. E., Franklin, P. A., & Larned, S. T. (2024). Predicting impacts of agricultural land use on stream and river biota: Method review, evaluation, and guidance. Environmental Reviews, 32(4), 572–591. https://doi.org/10.1139/ER-2023-0134
Elwood, J. M., & van der Werf, B. (2022). Nitrates in drinking water and cancers of the colon and rectum: A meta-analysis of epidemiological studies. Cancer Epidemiology, 78, 102148. https://doi.org/10.1016/j.canep.2022.102148
Ember, F., Ling, N., & Duggan, I. C. (2025). Common bully (Gobiomorphus cotidianus) and mosquitofish (Gambusia affinis) shift littoral zooplankton community composition to smaller bodied taxa. New Zealand Journal of Marine and Freshwater Research, 59(2), 339–355. https://doi.org/10.1080/00288330.2024.2319093
Environment Canterbury. (2025). Ground to be broken on Te Repo o Papatahora wetland project. Retrieved 20 March 2026, from https://www.ecan.govt.nz/get-involved/news-and-events/2025/ground-to-be-broken-on-te-repo-o-papatahora-wetland-project
EOS Ecology. (2025). Awhipapa: Safeguarding our whenua & awa through reducing sediment in Tamaūpoko Tupuna Rohe – wānanga proceedings, Rānana Marae, 22–23 November 2024. https://www.doc.govt.nz/globalassets/documents/our-work/nga-awa-river-restoration/whanganui-river-restoration/awhipapa-sediment-wananga-proceedings.pdf
Eveleens, R., Lee, F., Kelly, L., & Clapcott, J. (2025). Update to freshwater physical habitat statistics for environmental reporting. (Cawthron Institute Report No. 4191). Ministry for the Environment. https://environment.govt.nz/publications/update-to-freshwater-physical-habitat-statistics-for-environmental-reporting
Fenwick, G., Greenwood, M., Williams, E., Milne, J., & Watene‑Rawiri, E. (2018). Groundwater ecosystems: Functions, values, impacts and management. National Institute of Water and Atmospheric Research. https://www.envirolink.govt.nz/assets/Envirolink/Reports/1838-HZLC143-Groundwater-Ecosystems-Functions-values-impacts-and-management.pdf
Fenwick, G. D., Greenwood, M. J., Hogg, I. D., & Meyer, S. J. (2021). High diversity and local endemism in Aotearoa New Zealand’s groundwater crustacean fauna. Ecology and Evolution, 11(22), 15664–15682. https://doi.org/10.1002/ece3.8220
Franklin, P., Gee, E., Baker, C., & Bowie, S. (2018). New Zealand fish passage guidelines: For structures up to 4 metres. Ministry of Business, Innovation and Employment. https://environment.govt.nz/assets/publications/Files/New-Zealand-fish-passage-guidelines-for-structures-up-to-four-metres.pdf
Franklin, P. A., Sykes, J., Robbins, J., Booker, D. J., Bowie, S., Gee, E., & Baker, C. F. (2022). A national fish passage barrier inventory to support fish passage policy implementation and estimate river connectivity in New Zealand. Ecological Informatics, 71, 101831. https://doi.org/10.1016/j.ecoinf.2022.101831
Galvan, A., Kawana, K., Harcourt, N., & Robson‑Williams, M. (2024). The health of cultural values and mahinga kai in the Te Wairoa‑Hōpūpū‑Hōnengenenge‑Mātangirau, Wairoa River catchment and the impacts of sediment. Australian Journal of Water Resources, 28(2), 173–192. https://doi.org/10.1080/13241583.2024.2403814
Gascon, M., Zijlema, W., Vert, C., White, M. P., & Nieuwenhuijsen, M. J. (2017). Outdoor blue spaces, human health and well‑being: A systematic review of quantitative studies. International Journal of Hygiene and Environmental Health, 220(8), 1207–1221. http://dx.doi.org/10.1016/j.ijheh.2017.08.004
Gibson, P. B., Broadbent, A. M., Stuart, S. J., Lewis, H., Campbell, I., Rampal, N., Harrington, L. J., & Williams, J. (2025). Downscaled CMIP6 future climate projections for New Zealand: Climatology and extremes. Weather and Climate Extremes, 49, 100784. https://doi.org/10.1016/j.wace.2025.100784
Glavinovic, K., Eggleton, K., Davis, R., Gosman, K., & Macmillan, A. (2022). Understanding and experience of climate change in rural general practice in Aotearoa–New Zealand. Family Practice, 40(3), 442–448. https://doi.org/10.1093/fampra/cmac107
Gluckman, P., Cooper, B., Howard‑Williams, C., Larned, S., Quinn, J., Bardsley, A., Hughey, K., & Wratt, D. (2017). New Zealand’s fresh waters: Values, state, trends and human impacts. Office of the Prime Minister’s Chief Science Advisor.
https://dpmc.govt.nz/sites/default/files/2021-10/pmcsa-Freshwater-Report.pdf
https://www.gns.cri.nz/research-projects/?q=groundwater&sort=relevance&start=0&science=82
https://www.gns.cri.nz/research-projects/nitratewatch
Goodman, J. M. (2018). Conservation, ecology and management of migratory galaxiids and the whitebait fishery: A summary of current knowledge and information gaps. Department of Conservation. https://www.doc.govt.nz/globalassets/documents/conservation/land-and-freshwater/freshwater/conservation-ecology-and-management-of-migratory-galaxiids.pdf
Grout, L., Hales, S., Baker, M. G., French, N., & Wilson, N. (2024). Severe weather events and cryptosporidiosis in Aotearoa New Zealand: A case series of space-time clusters. Epidemiology & Infection, 152, e64. https://doi.org/10.1017/S095026882400058X
Hageman, K. J., Aebig, C. H. F., Luong, K. H., Kazerson, S. L., Wong, C. S., Reeks, T., Greenwood, M., Macaulay, S., & Matthaei, C. D. (2019). Current-use pesticides in New Zealand streams: Comparing results from grab samples and three types of passive samplers. Environmental Pollution, 254(A), 112973. https://doi.org/10.1016/j.envpol.2019.112973
Hamilton, A., Fountain, J., Stewart, E., & Espiner, S. (2025). Māori-led tourism and climate change impacts and adaptation: Perspectives from Westland Tai Poutini National Park, New Zealand. Australian Journal of Emergency Management, 40(2), 39–51. https://doi.org/10.47389/40.2.39
Harmsworth, G., & Awatere, S. (2013). Indigenous Māori knowledge and perspectives of ecosystems. In J. R. Dymond (Ed.), Ecosystem Services in New Zealand: Conditions and Trends (pp. 274–286). Manaaki Whenua Press. https://www.landcareresearch.co.nz/assets/Discover-Our-Research/Environment/Sustainable-society-policy/VMO/Indigenous_Maori_knowledge_perspectives_ecosystems.pdf
Harmsworth, G. R., & Warmenhoven, T. (2002). Māori community goals for enhancing ecosystem health (Contract Report LC0102/105). Landcare Research.
Hayes, J. W., Goodwin, E. O., Clapcott, J. E., & Shearer, K. A. (2019). The influence of natural flow and temperature and introduced brown trout on the temporal variation in native fish abundance in a “reference” stream. Canadian Journal of Fisheries and Aquatic Sciences, 76(5), 705–722. https://doi.org/10.1139/cjfas-2018-0033
Henry, J. (2023). Te arotake kaupapahere waimāori − Ngā kōrero a te tangata whenua | Freshwater policy review − Round 1 tangata whenua engagement feedback. Waikato Regional Council. https://subsite2.waikatoregion.govt.nz/assets/WRC/PS2306Round1TangataWhenuaEngagementFeedbackReport.pdf
Herse, M. R., Tylianakis, J. M., Scott, N. J., Brown, D., Cranwell, I., Henry, J., Pauling, C., McIntosh, A. R., Gormley, A. M., & Lyver, P. O’.B. (2021). Effects of customary egg harvest regimes on hatching success of a culturally important waterfowl species. People and Nature, 3(2), 499–512. https://doi.org/10.1002/pan3.10196
Hickford, M., & Jones, C. (Eds.). (2019). Indigenous peoples and the state: International perspectives on the Treaty of Waitangi. Routledge. https://www.routledge.com/Indigenous-Peoples-and-the-State-International-Perspectives-on-the-Treaty/Hickford-Jones/p/book/9780367895440
Hikuroa, D., Clark, J., Olsen, A., & Camp, E. (2018). Severed at the head: Towards revitalising the mauri of Te Awa o te Atua. New Zealand Journal of Marine and Freshwater Research, 52(4), 643–656. https://doi.org/10.1080/00288330.2018.1532913
Hikuroa, D. C., Slade, A., & Gravley, D. M. (2011). Implementing Māori indigenous knowledge (mātauranga) in a scientific paradigm: Restoring the mauri to Te Kete Poutama. MAI Review, 3, 1–9. https://www.journal.mai.ac.nz/system/files/maireview/433-3375-1-PB.pdf
Hoang, L., & Hughes, A. (2024). Modelling the hydrological impact of afforestation in hill country catchments in New Zealand. Journal of Hydrology: Regional Studies, 51, 101620. https://doi.org/10.1016/J.EJRH.2023.101620
Hopkins, A. (2018). Classifying the mauri of wai in the Matahuru Awa in North Waikato. New Zealand Journal of Marine and Freshwater Research, 52(4), 657–665. https://doi.org/10.1080/00288330.2018.1536670
Houghton, K. M., Fournier, M., & Tschritter, C. (2023). Saltwater intrusion impacts microbial diversity and function in groundwater ecosystems. The Open Microbiology Journal, 17(1), e187428582306190. https://doi.org/10.2174/18742858-v17-230720-2023-2
James, B. (2024). Measurements and modelling of the tidal salt intrusion along the Waihou River [Master’s thesis, University of Waikato]. https://hdl.handle.net/10289/16782
Jefferies, R., Warren, T., Berke, P., Chapman, S., Crawford, J., Ericksen, N., & Mason, G. (2011). Iwi interests and the RMA: An evaluation of the quality of first generation council plans (PUCM Maori Working Paper No.1). Kōkōmuka Consultancy Ltd.; The International Global Change Institute (IGCI), University of Waikato. https://hdl.handle.net/10289/901
Jellyman, P. G., & Jellyman, D. J. (2025). The importance of river connectivity in maintaining headwater brown trout (Salmo trutta) stocks in a New Zealand river – results from a 29-year study. Canadian Journal of Fisheries and Aquatic Sciences, 82, 1–17. https://doi.org/10.1139/CJFAS-2024-0421
Jolly, M. E., Warburton, H. J., Bowie, S., Challies, E., Jellyman, P. G., & McIntosh, A. R. (2024). Isolation management to protect threatened native galaxiid fish species: Lessons from Aotearoa New Zealand. Aquatic Conservation: Marine and Freshwater Ecosystems, 34(7), e4220. https://doi.org/10.1002/AQC.4220
Jolly, M. E., Warburton, H. J., Bowie, S., & McIntosh, A. R. (2025). Managing isolation: Implementing in-stream barriers to exclude introduced trout from fragmented native freshwater fish refuges. River Research and Applications, 41, 1347–1361. https://doi.org/10.1002/rra.4447
Joy, M. K., Rankin, D. A., Wöhler, L., Boyce, P., Canning, A., Foote, K. J., & McNie, P. M. (2022). The grey water footprint of milk due to nitrate leaching from dairy farms in Canterbury, New Zealand. Australasian Journal of Environmental Management, 29(2), 177–199. https://doi.org/10.1080/14486563.2022.2068685
Kamish, W., Hansford, J., & Cochrane, P. (2020). Water availability under climate change (Deep South National Science Challenge). National Institute of Water and Atmospheric Research. https://deepsouthchallenge.co.nz/wp-content/uploads/2021/01/Water-availability-under-climate-change-Final-Report.pdf
Keane-Tuala, K. (2015). Ngā manu – birds. Retrieved March 20, 2026, from https://teara.govt.nz/en/nga-manu-birds/print
Kennedy, P., & Sutherland, S. (2008). Urban sources of copper, lead and zinc (Technical Report 2008/023). Auckland Regional Council. http://www.aucklandcity.govt.nz/council/documents/technicalpublications/TR2008_023%20-%20Urban%20sources%20of%20copper,%20lead%20and%20zinc.pdf
Kennedy, P., Allen, G., & Wilson, N. (2016). The management of hydrocarbons in stormwater runoff: A literature review. Auckland Council. https://knowledgeauckland.org.nz/media/1275/tr2016-010-management-of-hydrocarbons-in-stormwater-runoff.pdf
Kettles, H., & Bell, R. (2016). Estuarine ecosystems. In H. Robertson, S. Bowie, R. Death, & D. Collins (Eds.), Freshwater conservation under a changing climate. Proceedings of a workshop hosted by the Department of Conservation, 10–11 December 2013, Wellington (pp. 24–30). Department of Conservation. https://www.doc.govt.nz/Documents/conservation/climate-change-proceedings.pdf
Kueh Tai, F., Northcott, G. L., Beggs, J. R., Mortensen, A. N., & Pattemore, D. E. (2025). Scarcity of pesticide data in New Zealand with a focus on neonicotinoids: A review. Science of The Total Environment, 970, 179044. https://doi.org/10.1016/J.SCITOTENV.2025.179044
Kurian, P., Munshi, D., Cretney, R., Morrison, S., & Kathlene, L. (2022). The cultural politics of climate change adaptation: An analysis of the tourism sector in Aotearoa New Zealand. Political Science, 73(2), 143–160. https://doi.org/10.1080/00323187.2021.2021803
Lake, R., Adlam, B., & Perera, S. (2009). Acute gastrointestinal illness (AGI) study: Final study report (Client Report FW0753). Institute of Environmental Science & Research Limited. https://www.mpi.govt.nz/dmsdocument/27627/direct
Larned, S. T., Moores, J., Gadd, J., Baillie, B., & Schallenberg, M. (2020). Evidence for the effects of land use on freshwater ecosystems in New Zealand. New Zealand Journal of Marine and Freshwater Research, 54(3), 551–591. https://doi.org/10.1080/00288330.2019.1695634
LAWA (Land Air Water Aotearoa). (n.d.). Can I swim here? Retrieved March 6, 2026, from https://www.lawa.org.nz/explore-data/swimming
LAWA (Land Air Water Aotearoa). (2023). Factsheet: Nitrogen. Retrieved March 20, 2026, from https://www.lawa.org.nz/learn/factsheets/nitrogen
LAWA (Land Air Water Aotearoa). (2025, September 28). Groundwater quality. Retrieved March 20, 2026, from https://www.lawa.org.nz/explore-data/groundwater-quality
Leask, J. (2025, April 1). Second person poisoned by toxic algae at Canterbury lake. TVNZ. https://www.1news.co.nz/2025/04/01/second-person-poisoned-by-toxic-algae-at-canterbury-lake/
Lee, D., & Murphy, H. M. (2020). Private wells and rural health: Groundwater contaminants of emerging concern. Current Environmental Health Reports, 7, 129–139. https://doi.org/10.1007/s40572-020-00267-4
Legg, J., Mager, S. M., & Horton, S. L. (2025). Nitrate nitrogen (NO3‑N) response domains following a large-scale rainfall event on the Hekeao Hinds Plains of Mid‑Canterbury, New Zealand. Journal of Hydrology, 659, 133123. https://doi.org/10.1016/J.JHYDROL.2025.133123
Leusch, F. D. L., Allen, H., De Silva, N. A. L., Hodson, R., Johnson, M., Neale, P. A., Stewart, M., Tremblay, L. A., Wilde, T., & Northcott, G. L. (2024). Effect‑based monitoring of two rivers under urban and agricultural influence reveals a range of biological activities in sediment and water extracts. Journal of Environmental Management, 351, 119692. https://doi.org/10.1016/j.jenvman.2023.119692
Li, X., Newnham, R., Vandergoes, M. J., van den Bos, V., Howarth, J. D., Rees, A., Reyes, L., Clowes, C., Crouch, E. M., Gregersen, R., Wood, S. A., Martin, R., Ellison, R., Cassidy, T., Smith, R., Šunde, C., Tremain, R., & Te Koha, T. A. (2024). Insights into the natural and cultural history of Typha orientalis (Raupō) in Aotearoa New Zealand. PLOS Water, 3(9), e0000240. https://doi.org/10.1371/JOURNAL.PWAT.0000240
Lin, L., St Clair, S., Gamble, G. D., Crowther, C. A., Dixon, L., Bloomfield, F. H., & Harding, J. E. (2023). Nitrate contamination in drinking water and adverse reproductive and birth outcomes: a systematic review and meta‑analysis. Scientific Reports, 13, 563. https://doi.org/10.1038/s41598-022-27345-x
Lindsay, M., & Cartwright, A. (2024). National landfill climate change exposure assessment. Ministry for the Environment. https://environment.govt.nz/assets/publications/Waste/national-landfill-climate-change-exposure-assessment.pdf
LMK Consulting Ltd. (2014). Report on hydroelectric dams in New Zealand and fish passage. Wai Māori Trustee Ltd. https://waimaori.maori.nz/wp-content/uploads/2019/06/2014-11-23-FINAL-Hydroelectric-Dam-Report.pdf
Lorrey, A. M., Vargo, L., Purdie, H., Anderson, B., Cullen, N. J., Sirguey, P., MacKintosh, A., Willsman, A., Macara, G., & Chinn, W. (2022). Southern Alps equilibrium line altitudes: Four decades of observations show coherent glacier‑climate responses and a rising snowline trend. Journal of Glaciology, 68(272), 1127–1140. https://doi.org/10.1017/jog.2022.27
Lovelock, B., Ji, Y., Carr, A., & Blye, C. J. (2022). Should tourists care more about invasive species? International and domestic visitors’ perceptions of invasive plants and their control in New Zealand. Biological Invasions, 24, 3905–3918. https://doi.org/10.1007/s10530-022-02890-8
Lyver, P. O’.B., Timoti, P., Gormley, A. M., Jones, C. J., Richardson, S. J., Tahi, B. L., & Greenhalgh, S. (2017a). Key Māori values strengthen the mapping of forest ecosystem services. Ecosystem Services, 27(A), 92–102. https://doi.org/10.1016/j.ecoser.2017.08.009
Lyver, P. O’.B., Timoti, P., Jones, C. J., Richardson, S. J., Tahi, B. L., & Greenhalgh, S. (2017b). An indigenous community‑based monitoring system for assessing forest health in New Zealand. Biodiversity and Conservation, 26, 3183–3212. https://doi.org/10.1007/s10531-016-1142-6
Lyver, P. O’.B., Timoti, P., Richardson, S. J., & Gormley, A. M. (2021). Alignment of ordinal and quantitative species abundance and size indices for the detection of shifting baseline syndrome. Ecological Applications, 31(4), e02301. https://doi.org/10.1002/eap.2301
MacNeil, C., Pande, A., Wardle, J., Growcott, A., Sinclair, S., Somerville, R., Sinclair, C., & Lee, F. (2025). The gold clams, Corbicula fluminea (Müller, 1774) and Corbicula australis (Deshayes, 1830) invade Aotearoa New Zealand; first records, biosecurity responses and potential long‑term ecological impacts. BioInvasions Records, 14(3), 597–607. https://doi.org/10.3391/bir.2025.14.3.10
Madani, K. (2026). Global water bankruptcy: Living beyond our hydrological means in the post‑crisis era. United Nations University Institute for Water, Environment and Health. https://doi.org/10.53328/INR26KAM001
Manderson, A. (2020). Scoping a national land‑use intensity indicator (Contract Report LC3688). Manaaki Whenua – Landcare Research. https://environment.govt.nz/assets/publications/Files/landcare-research-scoping-a-national-land-use-intensity-indicator-2020.pdf
Marden, M., Rowan, D., & Watson, A. (2023). Effect of changes in forest water balance and inferred root reinforcement on landslide occurrence and sediment generation following Pinus radiata harvest on Tertiary terrain, eastern North Island, New Zealand. New Zealand Journal of Forestry Science, 53. https://doi.org/10.33494/nzjfs532023x216x
Mark, G., Boulton, A., Allport, T., Kerridge, D., & Potaka‑Osborne, G. (2022). “Ko au te whenua, ko te whenua ko au: I am the land, and the land is me”: Healer/patient views on the role of rongoā Māori (traditional Māori healing) in healing the land. International Journal of Environmental Research and Public Health, 19(14), 8547. https://doi.org/10.3390/ijerph19148547
Marsh, H., Storey, R., Kusabs, I., & Smith, B. (2025). Adaption of a traditional Māori fishing method for biomonitoring: using whakaweku for sampling benthic macroinvertebrates in streams. New Zealand Journal of Marine and Freshwater Research, 59(5), 979–996. https://doi.org/10.1080/00288330.2024.2387583
Matthews, Y. (2023). A hybrid and hierarchical stated preference study of freshwater restoration in Aotearoa New Zealand. Ecological Economics, 203, 107626. https://doi.org/10.1016/J.ECOLECON.2022.107626
Mauri Compass. (2022). Mauri compass training programme: Tuna module. Retrieved March 20, 2026, from https://www.mauricompass.com/
MBIE (Ministry of Business, Innovation & Employment). (n.d.). Electricity statistics. Retrieved March 20, 2026, from https://www.mbie.govt.nz/building-and-energy/energy-and-natural-resources/energy-statistics-and-modelling/energy-statistics/electricity-statistics
McDowall, R. M. (2011). Ikawai: Freshwater fishes in Māori culture and economy. Canterbury University Press. https://www.canterbury.ac.nz/about-uc/what-we-do/canterbury-university-press/canterbury-university-press-catalogue/ikawai-freshwater-fishes-in-maori-culture-and-economy
McDowell, R. W. (2015). Relationship between sediment chemistry, equilibrium phosphorus concentrations, and phosphorus concentrations at baseflow in rivers of the New Zealand national river water quality network. Journal of Environmental Quality, 44(3), 921–929. https://doi.org/10.2134/jeq2014.08.0362
McDowell, R. W., Macintosh, K. A., & Depree, C. (2023). Linking the uptake of best management practices on dairy farms to catchment water quality improvement over a 20‑year period. Science of The Total Environment, 895, 164963. https://doi.org/10.1016/J.SCITOTENV.2023.164963
McDowell, R. W., McNeill, S. J., Drewry, J. J., Law, R., & Stevenson, B. (2024). Difficulties in using land use pressure and soil quality indicators to predict water quality. Science of The Total Environment, 935, 173445. https://doi.org/10.1016/J.SCITOTENV.2024.173445
McDowell, R. W., Meenken, E., Noble, A., Kittridge, M., Ausseil, O., Keenan, L., Snelder, T., & Doscher, C. (2025). High flows contributed a large part of annual contaminant yields in New Zealand’s rivers. Communications Earth and Environment, 6, 335. https://doi.org/10.1038/s43247-025-02238-9
McDowell, R. W., Simpson, Z. P., Ausseil, A. G., Etheridge, Z., & Law, R. (2021). The implications of lag times between nitrate leaching losses and riverine loads for water quality policy. Scientific Reports, 11, 16450. https://doi.org/10.1038/s41598-021-95302-1
Mead, H. M. (2003). Tikanga Māori: Living by Māori values. Huia.
Meijer, C. G., Hickford, M. J. H., Gray, D. P., & Schiel, D. R. (2024). Disentangling the simultaneous effects of habitat degradation and introduced species on naturally depauperate riverine fish communities. Frontiers in Freshwater Science, 2, 1398975. https://doi.org/10.3389/FFWSC.2024.1398975
MfE (Ministry for the Environment). (2006). Using the Cultural Health Index: How to assess the health of streams and waterways. Ministry for the Environment. https://environment.govt.nz/assets/Publications/Files/chi-for-streams-and-waterways-feb06-full-colour.pdf
MfE (Ministry for the Environment). (2020). National climate change risk assessment for New Zealand: Main report – Arotakenga Tūraru mō te Huringa Āhuarangai o Āotearoa: Pūrongo whakatōpū. https://environment.govt.nz/assets/Publications/Files/national-climate-change-risk-assessment-main-report.pdf
MfE (Ministry for the Environment). (2023). Addressing risks associated with nitrates in drinking water. https://environment.govt.nz/assets/publications/Freshwater/risks-associated-with-nitrates-in-drinking-water.pdf
MfE (Ministry for the Environment). (2025a). National Policy Statement for Freshwater Management 2020 Amended December 2025). https://environment.govt.nz/assets/publications/npsfm-2020-amended-december-2025.pdf
MfE (Ministry for the Environment). (2025b). New Zealand’s Greenhouse Gas Inventory 1990–2023. https://environment.govt.nz/assets/publications/GhG-Inventory/GHG-Inventory-2025/Volume-1-GHG-Inventory-2025-ME1885.pdf
Mika, J. P. (2021). Māori perspectives on the environment and wellbeing. Parliamentary Commissioner for the Environment. https://pce.parliament.nz/media/llxjl5ay/mika-maori-perspectives-on-the-environment-and-wellbeing.pdf
MOH (Ministry of Health). (2024). Health National Adaptation Plan 2024–2027. https://www.health.govt.nz/publications/health-national-adaptation-plan-2024-2027
Moore, C., Oluwunmi, P., Hemmings, B., Cameron, S., Yang, J., Taves, M., Rajanayaka, C., Woodward, S. J. R., & Moreau, M. (2025). The significance of groundwater contributions to New Zealand rivers. Frontiers in Water, 7, 1584947. https://doi.org/10.3389/frwa.2025.1584947
Moore, D., Drew, R., Davies, P., & Rippon, R. (2017). The economic costs of the Havelock North August 2016 waterborne disease outbreak. Ministry of Health. https://www.health.govt.nz/system/files/2017-09/havelock_north_outbreak_costing_final_report_-_august_2017.pdf
Morgenstern, U., & Davidson, P. (2022). Groundwater tracers for improved understanding of water and nitrate flow through Te Hoiere / Pelorus Catchment (GNS Science Report No. 2022/50). GNS Science.
Morgenstern, U., Buckthought, L., Gardner, P., & Stenger, R. (2024). Nitrate transport and transformation processes in the Pukekohe‑Bombay area (GNS Science Report 2024/31). GNS Science. https://knowledgeauckland.org.nz/publications/nitrate-transport-and-transformation-processes-in-the-pukekohe-bombay-area/
Morgenstern, U., Moreau, M., Coble, M. A., Johnson, K., & Townsend, D. B. (2023). Groundwater and surface water conceptual flow from environmental tracer signatures in the Pukekohe and Bombay area (GNS Science Report). GNS Science. https://doi.org/10.21420/VNBF-3X96
Moreau, M., Herpe, M., & Santamaria Cerrutti, M. E. (2025). 2024 update of the national groundwater quality indicator (GNS Science Consultancy Report 2024/90). GNS Science. https://environment.govt.nz/assets/publications/Freshwater/groundwater-quality-update-2024.pdf
Morgan, T. K. K. B. (2006). Decision‑support tools and the indigenous paradigm. Engineering and Sustainability, 159(4), 167–177. https://doi.org/10.1680/ensu.2006.159.4.169
Mourot, F. M., Irvine, D. J., Remenyi, T. A., Hutley, L. B., Crosbie, R. S., & Moore, C. R. (2025). Producing hydrological projections under climate change: A groundwater‑inclusive practical guide. Earth’s Future, 13(8), e2025EF006316. https://doi.org/10.1029/2025EF006316
Mourot, F. M., Westerhoff, R. S., White, P. A., & Cameron, S. G. (2022). Climate change and New Zealand’s groundwater resources: A methodology to support adaptation. Journal of Hydrology: Regional Studies, 40, 101053. https://doi.org/10.1016/j.ejrh.2022.101053
Mouton, T. L., Leprieur, F., Floury, M., Stephenson, F., Verburg, P., & Tonkin, J. D. (2022). Climate and land‑use driven reorganisation of structure and function in river macroinvertebrate communities. Ecography, 2022(3), e06148. https://doi.org/10.1111/ECOG.06148
MPI (Ministry for Primary Industries). (2023). Technical Advisory Group report: Biosecurity response to Corbicula fluminea in the Waikato River. Biosecurity New Zealand. https://www.mpi.govt.nz/dmsdocument/59086-Technical-Advisory-Group-Report-Biosecurity-Response-to-Corbicula-fluminea-in-the-Waikato-River
MPI (Ministry for Primary Industries). (2024). Freshwater pests and diseases in New Zealand. Retrieved March 20, 2026, from https://www.mpi.govt.nz/biosecurity/freshwater-pests/
MPI (Ministry for Primary Industries). (2025). Rules to stop the spread of invasive freshwater clams (Corbicula). Retrieved March 20, 2026, from https://www.mpi.govt.nz/biosecurity/exotic-pests-and-diseases-in-new-zealand/long-term-biosecurity-management-programmes/invasive-freshwater-clam-corbicula/rules-to-stop-the-spread-of-invasive-freshwater-clams-corbicula
Muaūpoko Tribal Authority & Lake Horowhenua Trust. (2025). Wetland cultural health monitoring programme for repo (FIF1049 Report).
Munsterman, F., Allan, B. J. M., & Johnson, S. L. (2025). The availability and ingestion of microplastics by an intertidal fish is dependent on urban proximity. New Zealand Journal of Marine and Freshwater Research, 59(4), 685–698. https://doi.org/10.1080/00288330.2024.2365272
Narimani, R., Murgulet, I., & Murgulet, D. (2025). Emerging contaminants in groundwater: Challenges, management, and policy perspectives. In S. Zandaryaa, A. Fares, & G. Eckstein (Eds.), Emerging Pollutants: Protecting Water Quality for the Health of People and the Environment (pp. 189–226). UNESCO and Springer Nature. https://doi.org/10.1007/978-3-031-71758-1_9
Neverman, A. J., Donovan, M., Smith, H. G., Ausseil, A.-G., & Zammit, C. (2023). Climate change impacts on erosion and suspended sediment loads in New Zealand. Geomorphology, 427, 108607. https://doi.org/10.1016/J.GEOMORPH.2023.108607
Ngata, T. (2018). Wai māori. In M. Joy (Ed.), Mountains to Sea: Solving New Zealand’s Freshwater Crisis (pp. 6–11). Bridget Williams Books. https://www.bwb.co.nz/books/mountains-sea
NIWA (National Institute of Water and Atmospheric Research). (2019). Koi / amur carp | common carp. Retrieved March 20, 2026, from https://niwa.co.nz/freshwater/nz-freshwater-fish-database/niwa-atlas-nz-freshwater-fishes/koiamur-carp-common-carp
NIWA (National Institute of Water and Atmospheric Research). (2020). Freshwater invasive species of New Zealand 2020. https://niwa.co.nz/sites/default/files/Freshwater-invasive-species-of-New-Zealand-2020_1.pdf
Noble, M., Duncan, P., Perry, D., Prosper, K., Rose, D., Schnierer, S., Tipa, G., Williams, E., Woods, R., & Pittock, J. (2016). Culturally significant fisheries: Keystones for management of freshwater social‑ecological systems. Ecology and Society, 21(2), 22. https://doi.org/10.5751/ES-08353-210222
Norhayati, A. M., Matthaei, C. D., & Ingram, T. (2024). The impact of microplastics on lake communities: A mesocosm study. Chemosphere, 367, 143600. https://doi.org/10.1016/J.CHEMOSPHERE.2024.143600
NZIER (New Zealand Institute of Economic Research). (2024). The value of freshwater angling: Assessing the economic contribution and wellbeing benefits of recreational angling in New Zealand. https://www.nzier.org.nz/hubfs/Public-Publications/Client-reports/The-value-of-freshwater-angling.pdf
Ockenden, A., Northcott, G. L., Tremblay, L. A., & Simon, K. S. (2022). Disentangling the influence of microplastics and their chemical additives on a model detritivore system. Environmental Pollution, 307, 119558. https://doi.org/10.1016/j.envpol.2022.119558
Ockenden, A., Tremblay, L. A., Dikareva, N., & Simon, K. S. (2021). Towards more ecologically relevant investigations of the impacts of microplastic pollution in freshwater ecosystems. Science of the Total Environment, 792, 148507. https://doi.org/10.1016/j.scitotenv.2021.148507
Oliveira Sarmento, I. (2023). The impact of stormwater on emerging contaminants concentrations in urban waterways: Land use and rainfall effects (Master’s thesis, University of Canterbury). https://doi.org/10.26021/15134
Orchard, S., & Wilkinson, S. (2024). Opportunistic discovery of giant kōkopu (Galaxias argenteus) spawning in a tidal reach: Site description and implications. New Zealand Journal of Marine and Freshwater Research, 58(4), 577–590. https://doi.org/10.1080/00288330.2023.2280717
Orsman, B. (2020, July 7). Auckland’s drought crisis costed at $224m for extra water. New Zealand Herald. https://www.nzherald.co.nz/nz/aucklands-drought-crisis-costed-at-224m-for-extra-water/O3VQYRJFECGOGSVIZXNEY6ITOQ/
Otago Regional Council. (2023, June 14). Joint media release: ORC and Fish and Game addressing Otago galaxiid’s “slide into extinction” [Media release]. https://www.orc.govt.nz/your-council/latest-news/news/2023/june/orc-and-fish-and-game-addressing-otago-galaxiid-s-slide-into-extinction/
Parsons, M., Fisher, K., & Crease, R. P. (2021). Decolonising Blue Spaces in the Anthropocene: Freshwater Management in Aotearoa New Zealand (Palgrave Studies in Natural Resource Management). Palgrave Macmillan. https://doi.org/10.1007/978-3-030-61071-5
Pasanen, T. P., White, M. P., Wheeler, B. W., Garrett, J. K., & Elliott, L. R. (2019). Neighbourhood blue space, health and wellbeing: The mediating role of different types of physical activity. Environment International, 131, 105016. https://doi.org/10.1016/j.envint.2019.105016
Pattis, I., Weaver, L., Burgess, S., Ussher, J. E., & Dyet, K. (2022). Antimicrobial resistance in New Zealand – a One Health perspective. Antibiotics, 11(6), 778. https://doi.org/10.3390/antibiotics11060778
Paul-Burke, K., O’Brien, T., Burke, J., & Bluett, C. (2020). Mapping Māori knowledge from the past to inform marine management futures. New Zealand Science Review, 76(1–2), 31–40. https://hdl.handle.net/10289/14324
Paulik, R., Wild, A., Stephens, S., Welsh, R., & Wadhwa, S. (2023). National assessment of extreme sea-level driven inundation under rising sea levels. Frontiers in Environmental Science, 10, 1045743. https://doi.org/10.3389/fenvs.2022.1045743
PCE (Parliamentary Commissioner for the Environment). (2012). Hydroelectricity or wild rivers? Climate change versus natural heritage. https://pce.parliament.nz/media/lealenze/wild-riversweb.pdf
PCE (Parliamentary Commissioner for the Environment). (2020). Managing our estuaries (August 2020). https://pce.parliament.nz/media/jp0h0r3l/report-managing-our-estuaries-pdf-44mb.pdf
PCE (Parliamentary Commissioner for the Environment). (2022). Environmental reporting, research and investment: Do we know if we’re making a difference? https://pce.parliament.nz/publications/environmental-reporting-research-and-investment/
PCE (Parliamentary Commissioner for the Environment). (2024). A review of freshwater models used to support the regulation and management of water in New Zealand. https://pce.parliament.nz/media/cjkkplzi/a-review-of-freshwater-models-used-in-the-management-and-regulation-of-water-final.pdf
PCE (Parliamentary Commissioner for the Environment). (2025). A federated system to improve environmental information. https://pce.parliament.nz/media/ksxlm5rj/pce-note_federated-environmental-information-system-april-2025.pdf
PHF Science (New Zealand Institute for Public Health and Forensic Science). (2025). Notifiable diseases in New Zealand: Annual report 2024 (Client Report No. FW 25025). Ministry of Health. https://www.phfscience.nz/digital-library/notifiable-diseases-annual-surveillance-summary-2024/
Phillips, C., Jackson, A.-M., & Hakopa, H. (2016). Creation narratives of mahinga kai: Māori customary food gathering sites and practices. MAI Journal: A New Zealand Journal of Indigenous Scholarship, 5(1), 63–75. https://doi.org/10.20507/maijournal.2016.5.1.5
Puddick, J., Kelly, L., & Wood, S. (2022). Climate change and toxic freshwater cyanobacteria in Aotearoa New Zealand (Cawthron Institute Report No. 3765). Ministry of Health. https://www.phfscience.nz/media/oeybh4vn/esr-environmental-health-report-climate-change-toxic-freshwater-cyanobacteria.pdf
Purdie, J. (2022). Modelling climate change impacts on inflows, lake storage and spill in snow-fed hydroelectric power catchments, Southern Alps, New Zealand. Journal of Hydrology (New Zealand), 61(2), 151–178. https://62397185-821a-4cdf-b4f7-8cc2999495c6.usrfiles.com/ugd/623971_ef9aaa8b8f434a0da2bc175892b6c2ec.pdf
Queen, L. E., Dean, S., Stone, D., Henderson, R., & Renwick, J. (2023). Spatiotemporal trends in near-natural New Zealand river flow. Journal of Hydrometeorology, 241–255. https://doi.org/10.1175/JHM-D-22
Rainforth, H., & Harmsworth, G. (2019). Kaupapa Māori freshwater assessments: A summary of iwi and hapū-based tools, frameworks and methods for assessing freshwater environments. Perception Planning Ltd. https://www.nrc.govt.nz/media/n0ip2ksp/kaupapa-maori-assessments-final-jan-2019.pdf
Reed, A. W., & Calman, R. (2021). He Atua, he Tangata: The world of Māori mythology (rev. ed.). Oratia Books. https://natlib.govt.nz/records/45833541
Rey, F. (2021). Harmonizing erosion control and flood prevention with restoration of biodiversity through ecological engineering used for co-benefits nature-based solutions. Sustainability, 13(20), 11150. https://doi.org/10.3390/su132011150
Richards, J., Chambers, T., Hales, S., Joy, M., Radu, T., Woodward, A., Humphrey, A., Randal, E., & Baker, M. G. (2022). Nitrate contamination in drinking water and colorectal cancer: Exposure assessment and estimated health burden in New Zealand. Environmental Research, 204(C), 112322. https://doi.org/10.1016/j.envres.2021.112322
Rissmann, C. W. F., Pearson, L. K., & Snelder, T. H. (2024). Physiographic Environment Classification: A controlling factor classification of landscape susceptibility to waterborne contaminant loss. Environmental Management, 74(2), 230–255. https://doi.org/10.1007/s00267-024-01950-0
Robb, C., Fenemor, A., Morris, R., Fernandes, R., Hadfield, J., Thomas, J., & Tidswell, S. (2021). Guiding groundwater resource management: Groundwater Forum (SIG) Science and Technology Strategy 2021. Groundwater Special Interest Group. https://www.envirolink.govt.nz/assets/Envirolink/2114-TSDC175-Guiding-groundwater-resource-management-a-strategy-v2.pdf
Rogers, K. M., Bradshaw, D., Scadden, P., Tschritter, C., Sanderson, S., Cooper, J., Phillips, A., Pannell, J., Thern, J., Abel, S., Joy, M. K., Liu, X., & Chambers, T. (2025). Nitrate contamination in New Zealand’s domestic drinking water with a focus on rural groundwater-sourced self-supplies. Science of The Total Environment, 1002, 180549. https://doi.org/10.1016/J.SCITOTENV.2025.180549
Rogers, K. M., van der Raaij, R., Phillips, A., & Stewart, M. (2023). A national isotope survey to define the sources of nitrate contamination in New Zealand freshwaters. Journal of Hydrology, 617(C), 129131. https://doi.org/10.1016/J.JHYDROL.2023.129131
Rout, M., Awatere, S., Reid, J., Campbell, E., Huang, A., & Warmenhoven, T. (2024). A ‘te ao Māori’ disaster risk reduction framework. Disasters, 48, e12622. https://doi.org/10.1111/disa.12622
Rowe, D. K. (2007). Exotic fish introductions and the decline of water clarity in small North Island, New Zealand lakes: A multi-species problem. Hydrobiologia, 583, 345–358. https://doi.org/10.1007/s10750-007-0646-1
Royal, H., ’t Mannetje, A., Hales, S., Douwes, J., Berry, M., & Chambers, T. (2024). Nitrate in drinking water and pregnancy outcomes: A narrative review of epidemiological evidence and proposed biological mechanisms. PLOS Water, 3(1), e0000214. https://doi.org/10.1371/journal.pwat.0000214
Ruffell, H., Pantos, O., Northcott, G., & Gaw, S. (2023). Wastewater treatment plant effluents in New Zealand are a significant source of microplastics to the environment. New Zealand Journal of Marine and Freshwater Research, 57(3), 336–352. https://doi.org/10.1080/00288330.2021.1988647
Rullens, V., Mangan, S., Stephenson, F., Clark, D. E., Bulmer, R. H., Berthelsen, A., Crawshaw, J., Gladstone-Gallagher, R. V., Thomas, S., Ellis, J. I., & Pilditch, C. A. (2022). Understanding the consequences of sea level rise: The ecological implications of losing intertidal habitat. New Zealand Journal of Marine and Freshwater Research, 56(3), 353–370. https://doi.org/10.1080/00288330.2022.2086587
Rumsby, A., & Manning, T. (2018). Impact of per- and polyfluoroalkyl substances on ecosystems. Ministry for the Environment. https://environment.govt.nz/assets/final-impact-of-pfas-on-ecosystems.pdf
Ruru, I., Kanz, W., Afoa, E., Clarke, C., Nutsford, D., Lowe, M., Jelicich, A., & Shivnan, S. (2022). Implementing mahinga kai as a Māori freshwater value: A kete for implementing mahinga kai within the National Policy Statement for Freshwater Management 2020. Ministry for the Environment. https://environment.govt.nz/assets/publications/Implementing-mahinga-kai-as-a-Maori-freshwater-value.pdf
Saccò, M., Mammola, S., Altermatt, F., Alther, R., Bolpagni, R., Brancelj, A., Brankovits, D., Fišer, C., Gerovasileiou, V., Griebler, C., Guareschi, S., Hose, G. C., Korbel, K., Lictevout, E., Malard, F., Martínez, A., Niemiller, M. L., Robertson, A., Tanalgo, K. C., … Reinecke, R. (2023). Groundwater is a hidden global keystone ecosystem. Global Change Biology, 30, e17066. https://doi.org/10.1111/gcb.17066
Salmond, A., Brierley, G., & Hikuroa, D. (2019). Let the rivers speak: Thinking about waterways in Aotearoa New Zealand. Policy Quarterly, 15(3), 45–54. https://doi.org/10.26686/pq.v15i3.5687
Sarris, T. S., Kenny, A., Scott, D. M., & Close, M. E. (2022). Aquifer heterogeneity controls to quality monitoring network performance for the protection of groundwater production wells. Water Research, 218, 118485. https://doi.org/10.1016/j.watres.2022.118485
Sarris, T. S., Wilson, S. R., Close, M. E., Abraham, P., & Kenny, A. (2025). Reducing uncertainty of groundwater redox condition predictions at national scale, for decision making and policy. Environmental Management, 75, 307–329. https://doi.org/10.1007/s00267-024-02098-7
Schallenberg, M., Borges, H., Bell, T. J., Hinkley, S. F. R., & Novis, P. M. (2022). Dynamics of pelagic mucilage produced by the invasive, cyclotelloid diatom, Lindavia intermedia, in oligotrophic lakes of New Zealand. PLOS Water, 1(9), e0000028. https://doi.org/10.1371/JOURNAL.PWAT.0000028
Schallenberg, M., de Winton, M. D., Verburg, P., Kelly, D. J., Hamill, K. D., & Hamilton, D. P. (2013). Ecosystem services of lakes. In J. R. Dymond (Ed.), Ecosystem Services in New Zealand: Conditions and Trends (pp. 203–225). https://www.riverlake.co.nz/wp-content/uploads/2017/09/Schallenberg-et-al-2013-ecosystem-services-of-lakes.pdf
Schallenberg, M., Hall, C. J., & Burns, C. W. (2003). Consequences of climate-induced salinity increases on zooplankton abundance and diversity in coastal lakes. Marine Ecology Progress Series, 251, 181–189. https://doi.org/10.3354/meps251181
Setiawan, I., Morgan, L. K., & Doscher, C. (2023). Saltwater intrusion from an estuarine river: A field investigation. Journal of Hydrology, 617(A), 128955. https://doi.org/10.1016/J.JHYDROL.2022.128955
Setiawan, I., Morgan, L. K., & Doscher, C. (2024). Mapping the vulnerability of groundwater to saltwater intrusion from estuarine rivers under sea level rise. Journal of Hydrology, 628, 130461. https://doi.org/10.1016/J.JHYDROL.2023.130461
Sevicke Jones, G., Ataria, J. M., Baker, V., Northcott, G. L., Brooks, B. W., Horswell, J., Stewart, M., & Tremblay, L. A. (2025). Managing the risks of emerging contaminants – establishing a national strategy guided by Indigenous perspectives. Integrated Environmental Assessment and Management, 21(2), 374–383. https://doi.org/10.1093/inteam/vjae027
Silveira, F. C., Bello-Mendoza, R., & Cochrane, T. A. (2024). Transformation of nitrogen compounds in a regenerated urban drainage stream in New Zealand. New Zealand Journal of Marine and Freshwater Research, 58(1), 28–45. https://doi.org/10.1080/00288330.2022.2103158
Simpson, Z. P., McDowell, R. W., Condron, L. M., McDaniel, M. D., Jarvie, H. P., & Abell, J. M. (2021). Sediment phosphorus buffering in streams at baseflow: A meta-analysis. Journal of Environmental Quality, 50(2), 287–311. https://doi.org/10.1002/jeq2.20202
Smith, J., & Hutchings, J. (2025). Feeding Indigenous Aotearoa better. Journal of the Royal Society of New Zealand, 55(6), 2286–2304. https://doi.org/10.1080/03036758.2024.2327420
Smith, H. G., Neverman, A. J., Betts, H., & Spiekermann, R. (2023). The influence of spatial patterns in rainfall on shallow landslides. Geomorphology, 437, 108795. https://doi.org/10.1016/j.geomorph.2023.108795
Snelder, T. H., Fraser, C., Larned, S. T., Monaghan, R., De Malmanche, S., & Whitehead, A. L. (2021). Attribution of river water-quality trends to agricultural land use and climate variability in New Zealand. Marine and Freshwater Research, 73(1), 1–19. https://doi.org/10.1071/MF21086
Somerville, R., MacNeil, C., & Lee, F. (2025). Habitat suitability of Aotearoa New Zealand for the recently invaded gold clam (Corbicula fluminea). New Zealand Journal of Marine and Freshwater Research, 59(4), 762–779. https://doi.org/10.1080/00288330.2024.2368856
Sood, A., & Mullan, B. (2020). Projected changes in New Zealand drought risk: An updated assessment using multiple drought indicators. NIWA Client Report 202001WN1. https://deepsouthchallenge.co.nz/wp-content/uploads/2021/01/Projected-Changes-in-New-Zealand-Drought-Risk-.pdf
Stewart, C., Bennett-Fakahau, I., Nada-Raja, S., & Stewart, K. (2025). Exploring the relationship between trout fishing and wellbeing: Insights from Aotearoa New Zealand trout anglers. Kōtuitui: New Zealand Journal of Social Sciences Online, 20(1), 98–115. https://doi.org/10.1080/1177083X.2024.2347409
Stewart-Harawira, M. W. (2020). Troubled waters: Māori values and ethics for freshwater management and New Zealand’s freshwater crisis. Wiley Interdisciplinary Reviews: Water, 7(5), e1464. https://doi.org/10.1002/wat2.1464
Stoffels, R. J., & Thompson, R. M. (2025). Avoiding the ‘one-size-fits-all’ trap in policy-based monitoring. River Research and Applications, 42(3), 732–746. https://doi.org/10.1002/RRA.70087
Taranaki Regional Council. (2025). Freshwater clam found in New Plymouth lake. Retrieved March 20, 2026, from https://www.trc.govt.nz/council/news-and-events/council-news/freshwater-clam-found-in-new-plymouth-lake
Taura, Y., van Schravendijk-Goodman, C., & Clarkson, B. (Eds.). (2017). Te reo o te repo: The voice of the wetland. Manaaki Whenua – Landcare Research; Waikato Raupatu River Trust. https://www.landcareresearch.co.nz/assets/Publications/Te-reo-o-te-repo/Te_Reo_o_Te_Repo_Voice_of_the_Wetland_complete_book.pdf
Taura, Y., van Schravendijk-Goodman, C., & Clarkson, B. (Eds.). (2021). Te reo o te repo – kei konei tonu au | The voice of the wetland – I am still here. Manaaki Whenua – Landcare Research. https://www.landcareresearch.co.nz/assets/Publications/Te-reo-o-te-repo-vol-2/TRoTR-kei-konei-tonu-au-complete-handbook.pdf
Taute, N., Morgan, K., Ingham, J., Archer, R., & Fa’aui, T. (2022). Māori values in geothermal management and development. AlterNative, 18(4), 548–555. https://doi.org/10.1177/11771801221118629
Teen, R. (2024). Intern report: Water-borne illnesses in Aotearoa New Zealand – past, present, future. Office of the Prime Minister’s Chief Science Advisor. https://www.dpmc.govt.nz/sites/default/files/2024-07/PMCSA-24-06-04-V1-OPMCSA-Internship-report-Water-borne-illnesses-in-Aotearoa-R-Teen-20-Jun-2024-V1-wcs.pdf
Teixeira, S. (2024). Impact of managed aquifer recharge on nitrate concentration changes in an alluvial aquifer (Master’s thesis, Lincoln University). https://hdl.handle.net/10182/17902
Thompson, R. M., Phillips, N. R., & Townsend, C. R. (2009). Biological consequences of clear-cut logging around streams – moderating effects of management. Forest Ecology and Management, 257(3), 931–940. https://doi.org/10.1016/j.foreco.2008.10.025
Thompson, R. M., & Townsend, C. R. (2004). Impacts of riparian afforestation on stream biofilms: An exotic forest–native grassland comparison. New Zealand Journal of Marine and Freshwater Research, 38(5), 895–902. https://doi.org/10.1080/00288330.2004.9517288
Tipa, G. (2009). Exploring indigenous understandings of river dynamics and river flows: A case from New Zealand. Environmental Communication, 3(1), 95–120. https://doi.org/10.1080/17524030802707818
Tomscha, S., Deslippe, J., de Róiste, M., Hartley, S., & Jackson, B. (2019). Uncovering the ecosystem service legacies of wetland loss using high-resolution models. Ecosphere, 10(10), e02888. https://doi.org/10.1002/ecs2.2888
Tremblay, L. A., Nakajima, D., Endo, S., Yagishita, M., Ludlow, H., Mackay, A., & Champeau, O. (2024). Risk assessment of displaced sediment by an extreme event cyclone in a peri-urban zone using bioassays and analytical chemistry. Toxics, 12(8), 558. https://doi.org/10.3390/toxics12080558
Tremblay, L. A., Sevicke Jones, G., Ataria, J. M., Saaristo, M., Leahy, P., Booker, D. J., Mulling, B. T. M., Muraoka, K., Mander, C., & Northcott, G. L. (2026). Outcomes and recommendations from workshops to design a survey for monitoring emerging contaminants in New Zealand freshwater. Integrated Environmental Assessment and Management, 22(1), 132–136. https://doi.org/10.1093/inteam/vjaf131
Tumahai, L. (2022, July 21). Kā Roimata o Hine Hukatere. Te Karaka. https://ngaitahu.iwi.nz/opportunities-and-resources/publications/te-karaka/ka-roimata-o-hine-hukatere-tk90/
United Nations. (2022). The United Nations World Water Development Report 2022: Groundwater: Making the invisible visible. United Nations Educational, Scientific and Cultural Organization. https://unesdoc.unesco.org/ark:/48223/pf0000380721
University of Auckland. (n.d.). Water research centre. Retrieved March 20, 2026, from https://www.auckland.ac.nz/en/engineering/our-research/engineering-research/research-areas-and-facilities/water-research-centre.html
van Hamelsveld, S., Kurenbach, B., Paull, D. J., Godsoe, W. A., Ferguson, G. C., & Heinemann, J. A. (2023). Indigenous food sources as vectors of Escherichia coli and antibiotic resistance. Environmental Pollution, 334, 122155. https://doi.org/10.1016/J.ENVPOL.2023.122155
Water NZ (Water New Zealand). (2024). National Performance Review publication 2021/2022. Retrieved March 20, 2026, from https://www.waternz.org.nz/nationalperformancereview
The Water Services Authority – Taumata Arowai. (n.d.-a). Chlorine. Retrieved March 20, 2026, from https://www.taumataarowai.govt.nz/learning-hub/source-monitoring-and-treatment/chlorine
The Water Services Authority – Taumata Arowai. (n.d.-b). Summary of the proposed drinking water aesthetic values. https://korero.taumataarowai.govt.nz/regulatory/drinking-water-aesthetic-values/user_uploads/drinking-water-aesthetic-values---summary.pdf
The Water Services Authority – Taumata Arowai. (2022). Aesthetic values for drinking water notice 2022. https://www.taumataarowai.govt.nz/assets/Uploads/Rules-and-standards/Taumata-Arowai-Aesthetic-Values-for-Drinking-Water-2022.pdf
The Water Services Authority – Taumata Arowai. (2025a). Drinking water regulation report 2024. https://www.taumataarowai.govt.nz/assets/Uploads/Network-Performance/Drinking-Water-Regulation-Report-2024.pdf
The Water Services Authority – Taumata Arowai. (2025b). Network environmental performance report 2023/24. https://www.taumataarowai.govt.nz/assets/Uploads/Network-Performance/Network-Environmental-Performance-Report-2023_24.pdf
The Water Services Authority – Taumata Arowai. (2025c). Report on wastewater treatment arrangements that respond to Māori values. https://www.taumataarowai.govt.nz/assets/Uploads/Wastewater-consultation/Case-studies-report-final.pdf
The Water Services Authority – Taumata Arowai. (2025d). New Zealand drinking water quality assurance rules: Interpretation guide for very small communities (VSC). https://www.taumataarowai.govt.nz/assets/Uploads/DWQAR-VSC-Guidance-March-2025-1.pdf
Waters, S., Atalah, J., Thompson, L., Thomson-Laing, G., Pearman, J. K., Puddick, J., Howarth, J. D., Reyes, L., Vandergoes, M. J., & Wood, S. A. (2023). It’s all in the mud – the use of sediment geochemistry to estimate contemporary water quality in lakes. Applied Geochemistry, 153, 105667. https://doi.org/10.1016/J.APGEOCHEM.2023.105667
Weaver, L., Webber, J., Bolton, A., Sitthirit, P., Abraham, P., Masterton, H., & Close, M. (2024). Groundwater ecosystems preliminary biodiversity of uncommon aquifers: Fractured basalt and coarse sand (Client Report No. 24037). Institute of Environmental Science and Research. https://environment.govt.nz/assets/publications/biodiversity/groundwater_ecosystems_
preliminary_biodiversity_of_uncommon_aquifers_fractured_basalt_and_coarse_sand.pdf
Whaanga, H., & Roa, T. (2021). Te reo o te repo: The language of the swamp. In Y. Taura, C. van Schravendijk-Goodman, & B. Clarkson (Eds.), Te reo o te repo – kei konei tonu au | The voice of the wetland – I am still here (pp. 65–76). Manaaki Whenua – Landcare Research. https://www.landcareresearch.co.nz/uploads/public/Publications/Te-reo-o-te-repo-vol-2/TRoTR-kei-konei-tonu-au-complete-handbook.pdf
Wheeler, D. M., Ledgard, S., Monaghan, R. M., McDowell, R. W., & De Klein, C. A. M. (2006). OVERSEER nutrient budget model – what it is, what it does. In L. D. Currie & J. A. Hanly (Eds.), Implementing sustainable nutrient management strategies in agriculture (Occasional Report No. 19, pp. 231–236). Fertiliser and Lime Research Centre, Massey University. https://www.researchgate.net/publication/285807876_OVERSEER_nutrient_budget_model_-_what_it_is_what_it_does
White, M. P., Elliott, L. R., Gascon, M., Roberts, B., & Fleming, L. E. (2020). Blue space, health and well-being: A narrative overview and synthesis of potential benefits. Environmental Research, 191, 110169. https://doi.org/10.1016/j.envres.2020.110169
WHO (World Health Organization). (2016). Nitrate and nitrite in drinking water: Background document for development of WHO guidelines for drinking-water quality. https://www.who.int/docs/default-source/wash-documents/wash-chemicals/nitrate-nitrite-background-document.pdf
Williams, E., Crow, S., Murchie, A., Tipa, G., Egan, E., Kitson, J., Clearwater, S., & Fenwick, M. (2017). Understanding taonga: Freshwater fish populations in Aotearoa New Zealand. National Institute of Water and Atmospheric Research. https://waimaori.maori.nz/wp-content/uploads/2019/05/Understanding-Taonga-Freshwater-Fish-Populations-in-Aotearoa-New-Zealand.pdf
Wilson, S. R., Hoyle, J., Measures, R., Di Ciacca, A., Morgan, L. K., Banks, E. W., Robb, L., & Wöhling, T. (2024). Conceptualising surface water–groundwater exchange in braided river systems. Hydrology and Earth System Sciences, 28(12), 2721–2743. https://doi.org/10.5194/HESS-28-2721-2024
Yang, J., Moore, C., Rajanayaka, C., Shiona, H., Hemmings, B., Oluwunmi, P., Cameron, S., & Woodward, S. J. R. (2025). National nutrient contribution dynamics in New Zealand rivers. Hydrological Processes, 39(5), e70161. https://doi.org/10.1002/HYP.70161
Young, R., Smart, G., & Harding, J. (2004). Impacts of hydro-dams, irrigation schemes and river control works. In J. Harding, P. Mosley, C. Pearson, & B. Sorrell (Eds.), Freshwaters of New Zealand (pp. 37.1–37.15). The Caxton Press.
Yulianti, M., Özkundakci, D., & Ridwansyah, I. (2025). Simulating water balance and nutrient losses in a pastoral catchment using the SWAT+ model: Added value of isotope data. Hydrological Sciences Journal, 70(1), 127–143. https://doi.org/10.1080/02626667.2024.2423047
Zimmermann, L., Göttlich, S., Oehlmann, J., Wagner, M., & Völker, C. (2020). What are the drivers of microplastic toxicity? Comparing the toxicity of plastic chemicals and particles to Daphnia magna. Environmental Pollution, 267, 115392. https://doi.org/10.1016/j.envpol.2020.115392
Our Freshwater 2026 Tō Tātou Wai Māori
April 2026
© Ministry for the Environment