Issue 3: Changing water flows affect our freshwater

This issue explores the effects of the changes we have made to the water levels, flows, and courses in our rivers and aquifers. The changes have supported our need for water to live and make a living, generate electricity, grow food, and protect ourselves from floods.

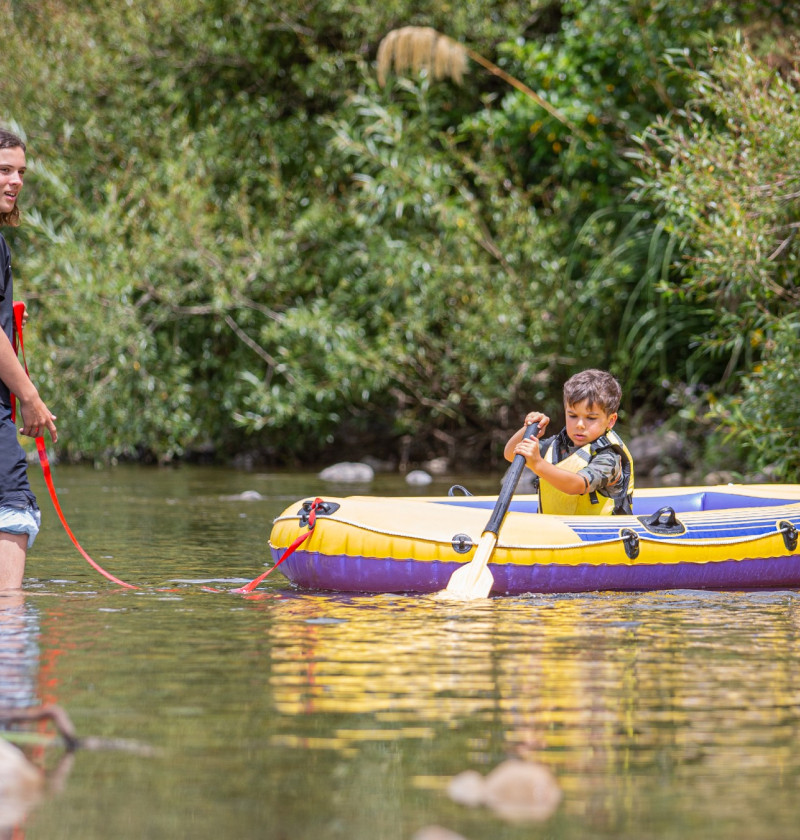
Image: Nature’s Pic Images
Although Aotearoa New Zealand has plenty of freshwater, we also use and store large quantities for irrigation and hydroelectricity generation, and in our homes.
To support our needs, water courses have been altered and water has been taken out of the freshwater system. This has reduced or changed the timing of water flows in many rivers. Low river flows reduce the habitat for freshwater fish and other species (including threatened birds). Essential fish movements up and downstream are made more difficult (or impossible) by low flows and artificial barriers (like dams and weirs) in rivers and streams.
Reduced or less variable flows can increase the temperature and the concentration of nutrients and pathogens (disease-causing microorganisms) in a waterway and increase the chances of harmful algal blooms.
Growing demand to irrigate more land (for 2002–17) coincided with less rain in 2000–14: lower rainfall was experienced in nine of the years between 2000 and 2014 compared with average rainfall for 1995–2014 (see What has contributed to this issue; Stats NZ, 2018).
Together, these changes affect the mauri of waterways and how we relate to and use them. Changing water flows can make our waterways unfit for recreational and cultural uses.
This issue contains updated information since Environment Aotearoa 2019 including new or updated data from these measures and indicators:
Using aquifers to manage water supply and quality issues is discussed in this issue, and a local story from the Manuherekia River is also included. In an infographic, īnanga demonstrate the effects of in-stream barriers and changing water flows on a native fish species.
We know how much water is consented for use, but we don’t know how much water is actually taken from the freshwater system, how much we have, or the full effects of taking too much water on river habitats and water quality.
The other issues highlighted in this report are also affected by changes to water flows.
Taking water for irrigation occurs nationwide but at a larger scale in Canterbury and Otago. Hydro dams have been built throughout the country.
Many waterways have been significantly modified by channelling their flow. In some catchments the water allowed to be taken for other uses is greater than the expected river flow.
It is difficult to reverse because farming is important for our economy and often requires irrigation. Hydro dams are important for renewable electricity generation and reduce our use of fossil fuels.
Using water and modifying waterways can affect ecosystems and our cultural uses, beliefs, and practices, and limit our access to freshwater.
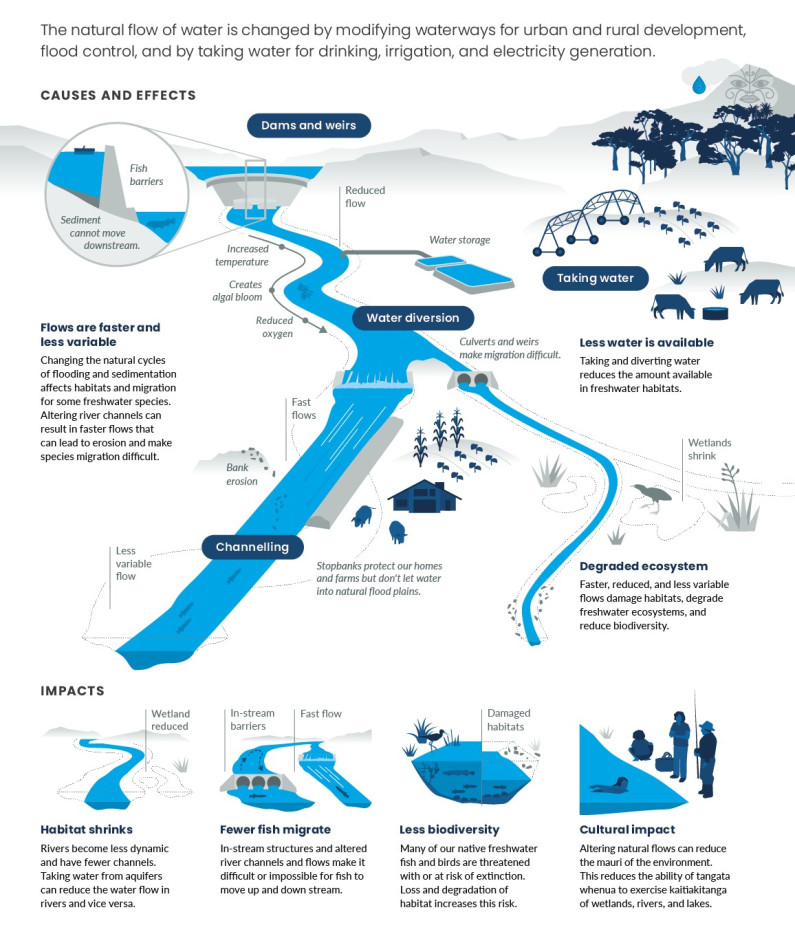

Read the long description for Effects of using water and modifying waterways
The natural flow of water is changed by modifying waterways for urban and rural development, flood control, and by taking water for drinking, irrigation, and electricity generation.
Causes of this are dams and weirs, taking water, water diversion and channelling. Effects are that flows are faster and less variable, less water is available and the ecosystem is degraded.
Flows are faster and less variable – changing the natural cycles of flooding and sedimentation affects habitats and migration for some freshwater species. Altering river channels can result in faster flows that can lead to erosion and make species migration difficult.
Less water is available – taking and diverting water reduces the amount available in freshwater habitats.
Degraded ecosystem – faster, reduced and less variable flows damage habitats, degrade freshwater ecosystems, and reduce biodiversity.
The impacts of these causes and effects are that habitat shrinks, fewer fish migrate, biodiversity declines and there are negative consequences culturally.
Habitat shrinks – rivers become less dynamic and have fewer channels. Taking water from aquifers can reduce the water flow in rivers and vice versa.
Fewer fish migrate – in-stream structures and altered river channels and flows make it difficult or impossible for fish to move up and down stream.
Less biodiversity – many of our native freshwater fish and birds are threatened with or at risk of extinction. Loss and degradation of habitat increases this risk.
Cultural impact – altering natural flows can reduce the mauri of the environment. This reduces the ability of tangata whenua to exercise kaitiakitanga of wetlands, rivers, and lakes.
New Zealand has plenty of freshwater. Approximately 440 billion cubic metres flow in our rivers and streams (Collins et al, 2015). Our aquifers also contain about 711 billion cubic metres of groundwater, of which 73 percent is located in Canterbury (519 billion cubic metres in 2014). (See indicator: Groundwater physical stocks.)
We are also heavy users of freshwater. For 2014, New Zealand’s consented water allocation per person was 2.2 million litres (OECD, 2020).
Consents (permits) to take water are managed by regional councils and other authorities that allocate water for hydroelectric generation, irrigation, drinking water, industrial, and other uses. Individual consents to take water have specified conditions, such as how much water can be taken, from where, at what rate, and at what times.
Regional councils also limit the total amount that can be taken from catchments or water management zones. In 2010, 10 of the 29 allocation zones in Canterbury were fully allocated and six were above 80 percent of the allocation limit (Kaye-Blake et al, 2014).
Hydroelectric generation is a major consented use of freshwater. Hydroelectricity is generated at about 100 sites nationwide including several large power stations (MBIE, 2018). Some of our big rivers like Clutha, Waikato, and Waitaki have multiple hydro dams. Most hydroelectric schemes store water without consuming it, but some (like the Manapouri in Southland) remove water from a catchment or move it from one catchment to another. In these cases it is considered a consumptive use.
Of all surface water uses nationally, hydroelectric generation had the largest consented allocation for consumptive use by total maximum rate (45 percent), followed by irrigation (37 percent) in the 2017/18 water reporting year (see Data service; see figure 12). No large hydroelectricity infrastructure has been built in the past two decades but a number of schemes have been proposed.
There were also 5,140 consents to take surface water and 11,573 consents to take groundwater in the 2017/18 water reporting year. Surface water made up 76 percent of the total volume of water allocated, with the rest from groundwater. Irrigation had the largest consented allocation by volume (58 percent). Household consumption (including water for drinking and sanitation) made up 17 percent, and industrial use was 10 percent (see figure 13). (See indicator: Consented freshwater takes.)
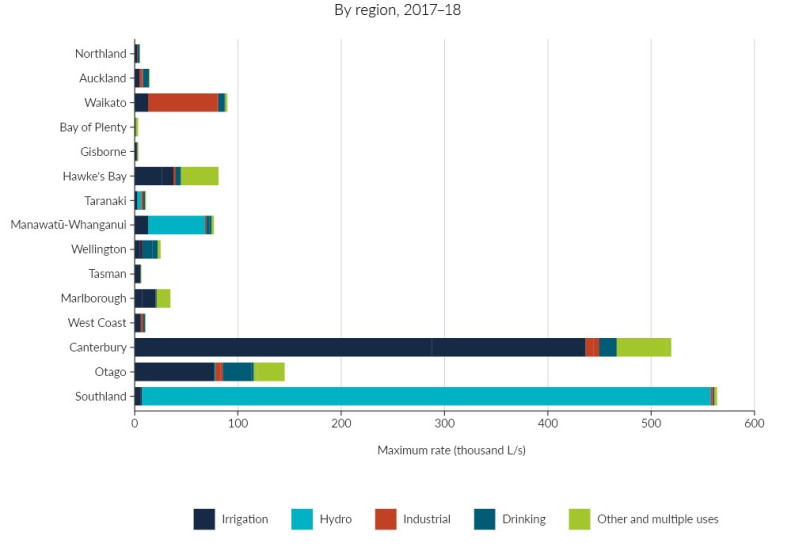
Image: NIWA (Data source)

Image: NIWA (Data source)
In many of our rivers, the way water moves downstream has been changed by altering the channels, building dams and stopbanks, and diverting whole streams. This confines rivers to well-defined channels and protects nearby land from floodwater that could damage houses and infrastructure. However, these changes have consequences on the volume of water in a river, how fast it flows, how the flows vary, and the connections between waterways.
River channels can be made deeper, straighter, or wider, and riverbanks protected with groynes and rocks (Hudson & Harding, 2004; Holmes et al, 2018). Channelling rivers alters their natural character and can also erode riverbanks and increase the amount of sediment deposited downstream (Maddock, 1999; Fuller et al, 2011). It also reduces the ecological connections between a river and the land, lakes, and wetlands in its catchment. For example, if flooding is constrained, the ability for rivers to scour and deposit sediment, and cycle nutrients can be lost (Catlin et al, 2017).
Some hydroelectric schemes reduce the water flowing in one river by adding it to another. The Waikato River, for example, receives water diverted from the Whanganui and Whangaehu Rivers. Taking water for hydroelectricity can significantly reduce the flow in some rivers, like the Waiau River in Southland and the Tekapo River in Canterbury.
Irrigation schemes change the natural flow of a river. Thousands of kilometres of water races have been built to supply water for irrigation, stock watering, mining, and other purposes. For example, in the Rangitata South Irrigation Scheme, some of the water from the Rangitata River is diverted at times of high flow and stored in a system of ponds. This is then added to water supplies at times of scarcity (NIWA, 2015). There is growing interest and development of these kinds of water storage schemes (NIWA, 2018).
Land has been drained to make it more suitable for agriculture (Pearson, 2015; Manderson, 2018). About 10 percent of New Zealand’s land is estimated to be artificially drained (Manderson, 2018) (see figure 14).

Image: NIWA (Data source)
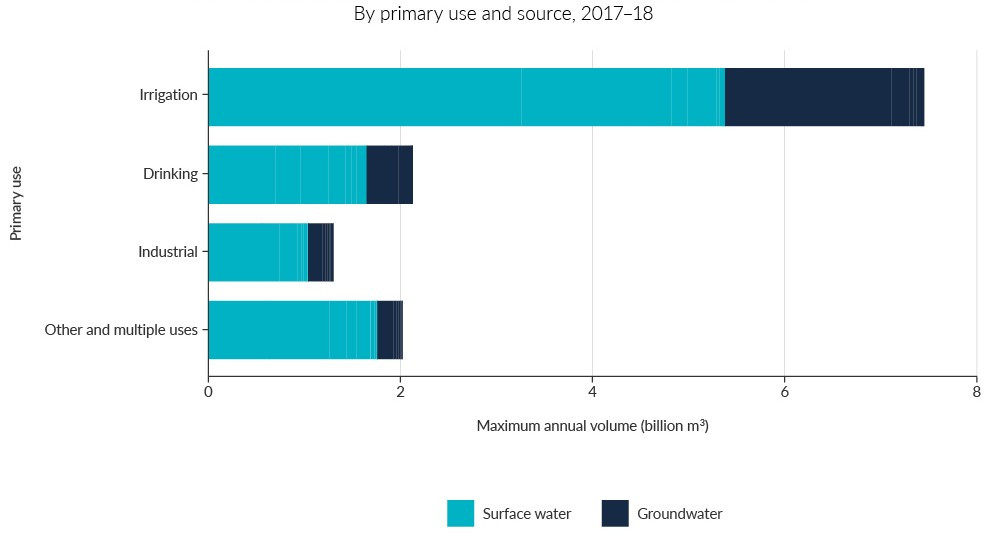
Image: NIWA (Data source)
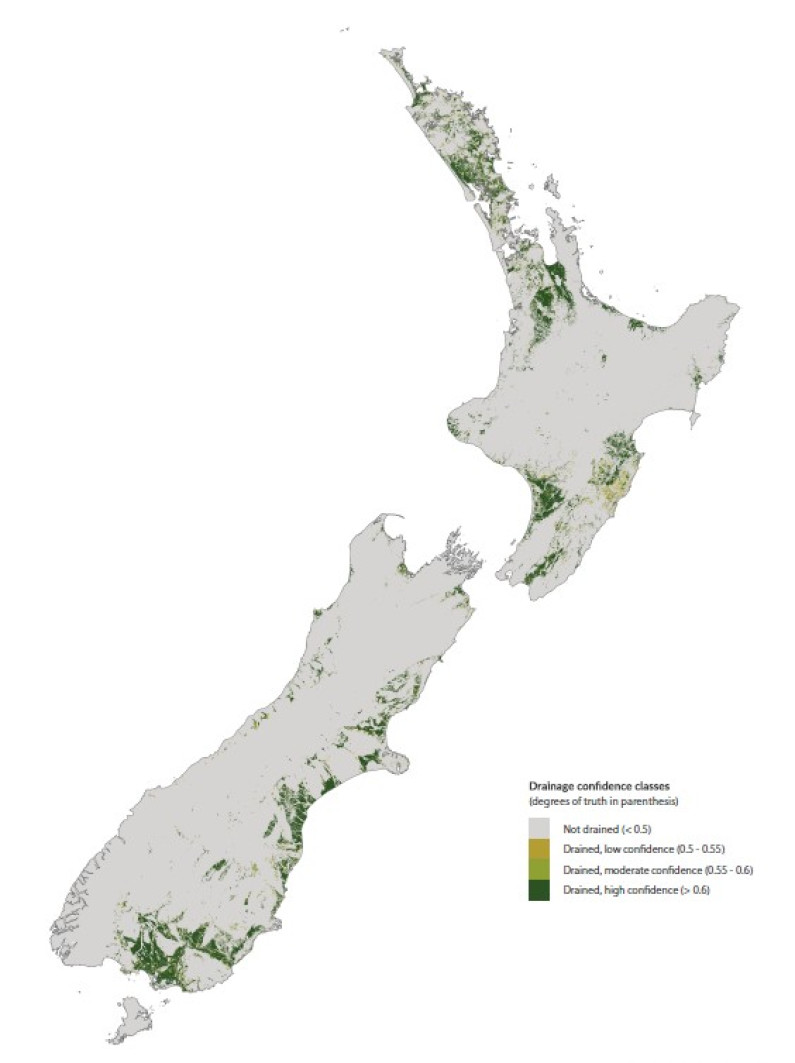
Image: Manderson, 2018 (Data source)
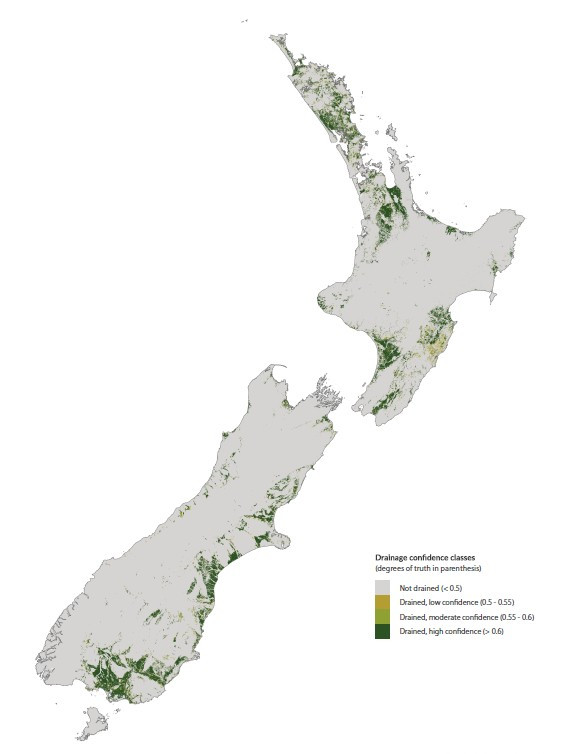
Image: Manderson, 2018 (Data source)
New Zealand has thousands of dams. While most are small and built to supply water to farms, more than 400 dams store large quantities of water (more than 18 million litres). About 100 of our large dams are used for hydroelectric generation, with the others used for irrigation, flood control, domestic and industrial water supply, or a combination of uses (NIWA, nd; MBIE, 2018). Depending on the design and operation of the dam, it may create a lake upstream and cause the flows downstream to be more constant, with less frequent high and low flows.
Weirs, culverts, and other structures may affect the water flow and the connections between waterways in a catchment (Franklin et al, 2018). Although there is no national inventory of these in-stream structures, their type and location can be recorded in a public database (see Fish Passage Assessment Tool).
A shift from sheep and beef farming to dairy farming, and an increase in the number of animals per hectare, have increased the demand for water. (See indicator: Livestock numbers.) These changes in livestock have been especially marked in the South Island, particularly in Canterbury and Southland (see What we farm has changed).
The area of irrigated agricultural land in New Zealand almost doubled between 2002 and 2017 from 384,000 hectares to 747,000 hectares. Irrigated land area rose in every region during this time, but the total increase was largely due to the almost doubling of irrigated land in Canterbury (241,000 to 478,000 hectares). In 2017, 64 percent of irrigated agricultural land was in Canterbury.
Dairy farming accounted for 59 percent of irrigated agricultural land area in 2017, with other types of livestock farming accounting for 17 percent. The production of grain, vegetables, fruit, and other horticulture made up 24 percent of irrigated agricultural land. (See indicator: Irrigated land.)
The effects of taking water on river flows can be predicted using computer models. For 2017/18, taking water for irrigation was predicted to have the greatest potential to cause widespread reductions in river flows across the country when compared with other uses (Booker & Henderson, 2019). The models showed that the total volume of water consented to be taken from a catchment (apart from use for hydroelectric generation) was greater than the estimated natural median river flows in some parts of Canterbury, Hawke’s Bay, and Otago (see figure 15). (See indicator: Consented freshwater takes.)
If you are on a mobile device, you can view the graph better on the StatsNZ website.
The water we use in our homes (including for drinking and sanitation) made up 17 percent of the country’s allocated water use in 2017/18. Industrial use made up 10 percent. Data for the use of water over time is not available nationally but is known for two regions (Booker et al, 2019) and some urban areas.
In 1980, Auckland used about 280 million litres of water per day for home and industrial uses and tanker fills (including leaks from the supply network) – a rate of more than 400 litres per person (Watercare, 2011). As the city’s population has grown, water use has increased to about 379 million litres per day but the volume used per person was 271 litres per day in 2019 (Watercare, 2019; Watercare, nd).
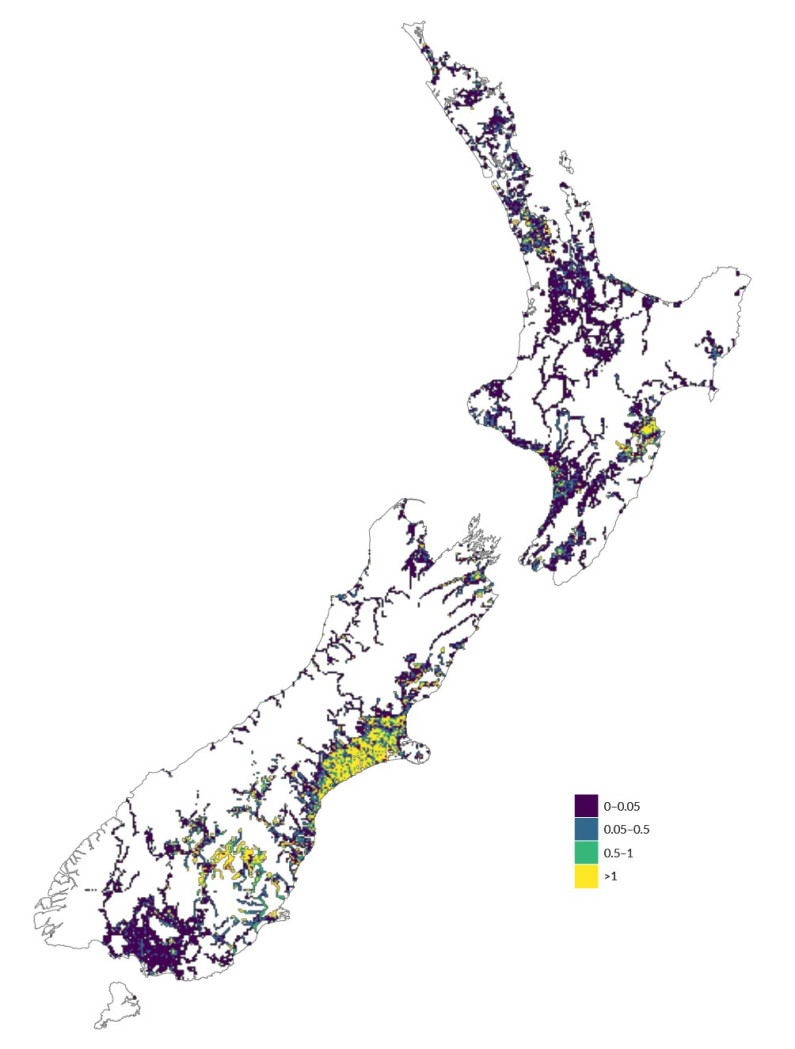
Image: NIWA (Data source)

Image: NIWA (Data source)
Our water bottling industry is very small. Approximately 135 million litres per year were bottled for the local market in 2018, and 27.9 million litres were bottled for export. This is 0.001 percent and 0.0002 percent respectively of the total amount of water consented to be taken annually for consumption, excluding hydroelectricity generation. (See indicator: Consented freshwater takes.)
As of 2018, 79 consents allowed for 71.6 million litres per day to be extracted for bottling, but only 45 of those consents were used to take 20.4 million litres per day (Deloitte, 2018).
Consents have been granted that would enable recently established businesses to take and export almost 400 times more water than current exports (Deloitte, 2018). Data is not available to establish the potential effects of increased water bottling at a local and regional scale.
Between 1995 and 2014, the average annual volume of precipitation (rain, hail, sleet, and snow) that fell in New Zealand was 549,392 million cubic metres. The annual precipitation was below average in nine of the years between 2000 and 2014 (with regional variations), probably because of natural climate patterns (Stats NZ, 2018, see SEEA water physical stock account).
Rain and snowmelt feed our rivers and streams, but their total volume is reduced by evaporation from lake and river surfaces, transpiration from plants, and the water we take and use. Precipitation varies naturally from year to year, but in dry years more water may be needed to sustain our cities, towns, and farms. Taking more water in these years could make issues related to low river flows worse or cause less groundwater to be available.
Climate changes are projected to affect the seasonality and regional variation of precipitation in New Zealand, which will affect water flows and the demand for water (MfE, 2018b; Gluckman et al, 2017) (see Issue 4: Climate change is affecting freshwater in Aotearoa New Zealand).
Many of our native fish move significant distances up and downstream to feed, reproduce, and hide (Franklin et al, 2018). Species that move between sea and freshwater include whitebait species (īnanga, shortjaw kōkopu, giant kōkopu, kōaro); kanakana/piharau (lamprey); and tuna (longfin and shortfin eel) (McDowall, 2000) (see Issue 1: Our native freshwater species and ecosystems are under threat).
Altered river channels and flows can make it difficult or impossible for fish to make these journeys. Culverts, for example, are often narrower than natural channels and can have faster and more uniform water flows. The ability of fish to move through fast-flowing water depends on a species’ swimming ability and the distance to travel as well as the presence of slower-flowing water for resting along the way (Williams et al, 2012).
In-stream structures like dams, weirs, fords, flood gates, and overhanging (perched) culverts can also disrupt or block fish migrations, and are a significant and ongoing threat to our native fish, including īnanga (Our fresh water 2017; Franklin et al, 2018; Goodman, 2018). Of the 240 in-stream structures surveyed in Hawke’s Bay between 2002 and 2010, one-third were barriers to fish passage in some or all flow conditions. (See indicator: Selected barriers to freshwater fish in Hawke’s Bay.)
Low river flows reduce the quantity of habitat for freshwater fish, invertebrates (like snails and kōura), and other species (Our fresh water 2017; Booker et al, 2014; James et al, 2008; Storey & Quinn, 2007; Storey, 2015).
Lower flows and seasonal variations can affect whitebait species because their reproduction is closely tied to water levels. Īnanga lay eggs in the vegetation beside rivers and streams during the highest (or king) tides in late summer and autumn (Goodman, 2018) but the eggs must be submerged on the next king tide to stimulate hatching (McDowall, 2000). In braided rivers, lower flows can reduce the number of channels and consequently the amount of habitat available for threatened birds like wrybill and black stilt (kakī) (O’Donnell et al, 2016).
Reduced flows may increase the concentration of nutrients and other pollutants in a waterway (Nilsson & Malm-Renöfält, 2008). Drains for surface water can also transport contaminants from land to freshwater (Manderson, 2018). These factors, combined with fewer floods, can increase algal blooms (Storey, 2015) (see Issue 2: Water is polluted in urban, farming, and forestry areas).
The effects of taking water are greater when larger volumes of water are taken from multiple locations, particularly in dry periods. Reduced and less variable flows can increase water temperatures, especially in streams without shade (Nilsson & Malm-Renöfält, 2008). Temperatures above 20°C in higher-altitude streams or above 25°C in streams on lower-lying land threaten sensitive native species (Olsen et al, 2012). Macroinvertebrate community index scores that measure ecosystem health tend to decrease with increasing water temperature (Storey, 2015) (see ‘Macroinvertebrate community index’ box).
Taking water from rivers can affect aquifers and vice versa, since groundwater and surface water are part of the same system. Wetlands are connected to lakes, rivers, and aquifers, so taking water can reduce the water in these ecosystems (White et al, 2001; Cameron & White, 2004). Low river flows can also affect estuaries and their biodiversity (Gillanders & Kingsford, 2002).
Using freshwater changes the flows in rivers and aquifers, which affects the mana (status) of water and the ways we relate to and use our waterways. Waterways are an integral part of Māori identity – when a whakapapa (genealogy) is told, significant landscapes (including mountains and rivers) within a tribal area are acknowledged.
ome Māori communities feel aggrieved by water takes and the effects on the mauri (life force) of waterways. Building artificial structures like dams in rivers and taking water from one catchment and releasing it into another can be particularly offensive to Māori, because the cultural and spiritual connection to the waterway is disrupted (Jones & Hickford, 2019). Decreased or altered flows can also affect the availability of traditional and customary resources and access to mahinga kai areas. The cultural health and wellbeing of a site can therefore be deeply affected by changed flows. (See indicator: Cultural health index for freshwater bodies.)
Decreased river flows can limit our ability to use rivers, lakes, and estuaries for swimming and other recreation, and may make them more susceptible to algal blooms (see Issue 2: Water is polluted in urban, farming, and forestry areas).
Extracting too much groundwater lowers the water table. Near the coast, this can allow seawater to enter aquifers and make the groundwater unfit for irrigation and drinking (see ‘Maintaining the water supply from our aquifers’ box). On the Waimea Plains in Nelson in 2001 for example, taking too much groundwater contaminated urban water supply bores with salt water. Two bores had to be shut down to keep seawater from entering the aquifer, which limited water take by up to 60 percent in some areas (Callander et al, 2011). As a consequence, a dam is being built on the Lee River to prevent the aquifer being overused in the future (MPI, 2015).
Aquifers are large underground water reservoirs where groundwater fills in the gaps between rock, gravel, sand, and silt particles. Water from some aquifers comes to the surface naturally through springs but is usually pumped up in wells.
We use aquifers for drinking water and irrigation throughout New Zealand. In many areas, aquifers are the main source of water and, when used sustainably, provide a reliable supply of high-quality water.
But when water is taken out faster than it can be replenished naturally (from rain or water seeping underground from rivers and lakes), the water levels in aquifers decrease and less water is available. Seawater can also enter aquifers near the coast if their water levels are too low, or from rising seas. This can require the use of alternative water sources either with lower quality or that require significant engineering works and investment to access.
One solution is to refill (or recharge) aquifers using water diverted from rivers. Natural or artificially built basins hold river water and allow it to seep down into an aquifer. This practice is common overseas and several schemes have been investigated or trialled in New Zealand. Despite its cost, interest in the practice is growing, especially as we respond to changes in rainfall and sea-level rise associated with climate change.
Aquifer recharge can reduce the water in a feeding river, so the benefits of a scheme must be weighed against any consequences of lower flows. Mixing different types of water reduces the mauri of the receiving water and changes the age and temperature of groundwater (Ngāi Tūāhuriri Rūnanga et al, 2013).
Central Otago summers are hot and dry and the winters are cold, with temperatures ranging from 35 to minus 20 degrees Celsius. It’s the closest anywhere in New Zealand comes to a continental climate.
The Manuherekia River runs south from the Hawkdun Range to its confluence with the Clutha River / Mata-Au. In its catchment, water is gold. It sustains the area’s sheep, deer, beef, and dairy farming; crops like barley and wheat; and fruit growing industries.
Several dams and reservoirs were built in the 1930s to capture and store water in areas where the rainfall is higher. Water is released in the summer months and transported using water races and natural watercourses to irrigate land. A small hydroelectric station also uses water.
Above Falls Dam (the catchment’s largest dam), the river is up to 1 kilometre across and braided into natural channels. Below the dam, the river becomes constrained by hills and enters a gorge. Banks have been stabilised by the planting of willows and other introduced trees, but this prevents channels from naturally changing after floods.
Birds recorded here – particularly in the upper braided sections of river – include banded dotterel and wrybill (both are nationally vulnerable), black-fronted terns (nationally endangered), and pied stilts. The gorse and broom growing in the lower channelised riverbeds has reduced the habitat for birds.
The area is a popular trout fishery and also contains several threatened native fish: Clutha flathead galaxias are nationally critical, and Central Otago roundhead galaxias and alpine galaxias (Manuherikia River) are nationally endangered.
The catchment’s low rainfall and high demand has led to river water being overallocated and reduced flows. Between 2013 and 2017, flows below Falls Dam were 23–69 percent of their modelled natural seasonal low flows. In times of low rainfall, some tributaries dry up naturally, but taking water out makes these periods longer and more frequent. Extreme low flows and higher water temperatures are unfavourable for trout and native fish, but trout are especially disadvantaged because they are larger. Having fewer trout can benefit some of the native species they compete with or eat.
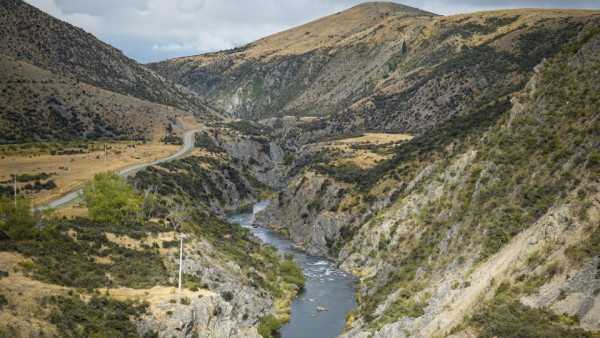
Manuherekia River downstream of Falls Dam. Photo: Isaac Bain
Contaminants from agriculture (including nitrogen, phosphorus, sediment, and disease-causing faecal bacteria) pollute the catchment’s water, especially in farmed areas. A study in 2011 found that at one part of the river dissolved inorganic nitrogen, dissolved reactive phosphorus, and E. coli concentrations at a site downstream of irrigated land were four, nine, and 39 times higher respectively than upstream. In some places, poor water quality has led to bans on swimming. Adding the dammed water back in summer can make the flow more regular; increase water depth, width, and velocity; reduce the temperature; and could dilute pollutants.
Balancing the need to protect the environment, provide for recreation and cultural values, and allow water to be taken for private or commercial uses is a huge challenge. There is also pressure to increase water storage and the area of irrigated land in the catchment.
Otago Regional Council intends to set allocation limits, and minimum flows and water levels for rivers and groundwater, as required by the National Policy Statement for Freshwater Management. Community consultation on the Council’s proposals ran from August to September 2019, and the Council intends to announce its plan change that sets flow and allocation limits by November 2020.

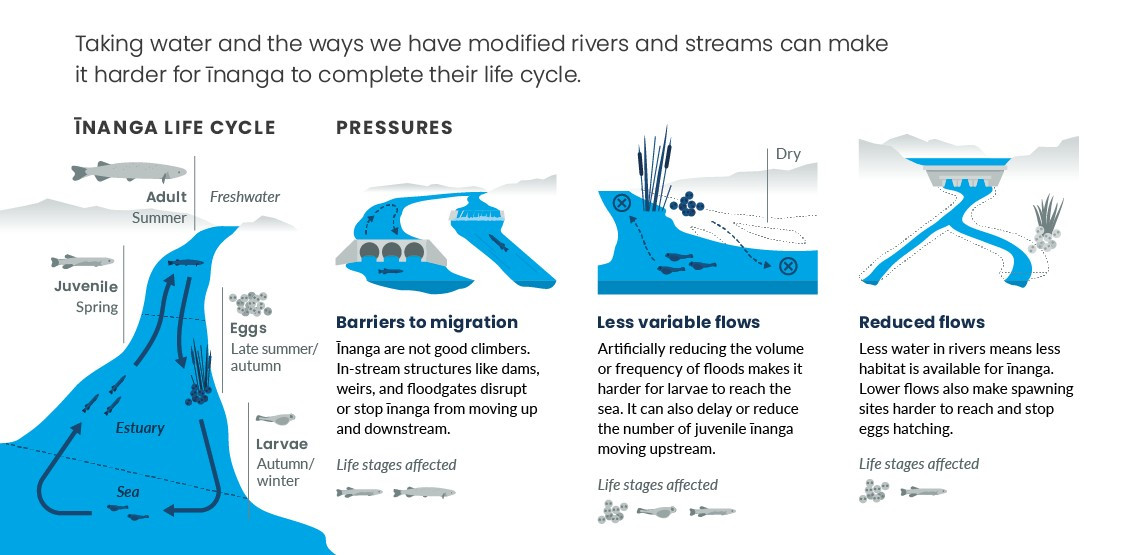
Read the long description for How changing water flows affect īnanga
Taking water and the ways we have modified rivers and streams can make it harder for īnanga to complete their life cycle.
Barriers to migration – īnanga are not good climbers. In-stream structures like dams, weirs, and floodgates disrupt or stop īnanga from moving up and downstream. This affects the juvenile and adult stages of the īnanga life cycle.
Less variable flows – artificially reducing the volume or frequency of floods makes it harder for larvae to reach the sea. It can also delay or reduce the number of juvenile īnanga moving upstream. This affects the egg, larvae and juvenile stages of the īnanga life cycle.
Reduced flows – less water in rivers means less habitat is available for īnanga. Lower flows also make spawning sites harder to reach and stop eggs hatching. This affects the egg and juvenile stages of the īnanga life cycle.
The quantity of water taken from all our rivers, lakes, and groundwater is not known – and neither is the amount of water available. This makes it difficult to know if our freshwater resources are over-exploited and how long they will continue to meet our needs. Given our economic reliance on agriculture, especially dairy farming, this is a significant management issue.
Detailed maps of the locations, volumes, and properties of our aquifers are not available so the volume, quality, and availability of water stored in aquifers is not known. The effects of climate change on the flow of water in rivers and aquifers is also poorly understood.
The Resource Management (Measurement and Reporting of Water Takes) Regulations 2010 require water meters to be installed (when consented water take is more than 5 litres per second) to provide a continuous record of use. Case studies of actual water-use data, however, show that some users took less water than the volume they were consented to take, some consistently took more, and other users did not supply records of their water use (Booker et al, 2017).
Data for the actual volume of water taken was collected by Horizons and Greater Wellington Regional Councils from July 2015 to July 2018. One study showed the volume of water taken varied seasonally, and river levels were lower in different places at different times (Booker et al, 2019). This information could be useful in estimating the actual reductions in river flow from our water use.
Changing water flows can have significant effects on river habitats and water quality but we lack information about the extent and scale of these impacts on our ecosystems. Other water issues like pollution also have an effect, but the cumulative impact of these changes on our cultural, social, and economic values is difficult to determine.
Substantial sources of information about the impacts of water use on cultural values, beliefs, and practices have been recorded as evidence for regional plans, Waitangi Tribunal claims, Treaty of Waitangi settlements, and water take or diversion consents. Also, some new methods for whānau to describe their flow preferences have been developed (Crow et al, 2018). Using ngā tohu o te taiao (environmental indicators) and drawing on mātauranga Māori can provide a better understanding of the effects of changing water flows on te ao Māori than western science methods (Tipa & Severne, 2010).
Issue 3: Changing water flows affect our freshwater
April 2020
© Ministry for the Environment