Issue 1: Our native freshwater species and ecosystems are under threat

This issue explores how our native freshwater species, habitats, and ecosystems are affected by the way we use our land, the species we have introduced, and the modifications we have made to natural waterways.

Image: Rod Morris
Aotearoa New Zealand has a very diverse and unique range of freshwater species, habitats, and ecosystems – some are rare and others are uncommon internationally.
Many of our native freshwater species, habitats, and ecosystems are under threat and continue to decline. These declines are the result of converting land to cities and towns, farms and plantation forest (and associated pollution), changing waterways from their natural form (including in-stream structures like weirs), and reducing flows, and bringing in new species intentionally or accidentally.
Collectively, these changes put our native species at risk, reduce the benefits we receive from nature, and affect our way of life and connection to freshwater.
This issue contains updated information since Environment Aotearoa 2019, including new or updated data from these measures and indicators:
This issue describes how the health of our ecosystems is measured, and gives the example of the Canterbury mudfish as a native fish under threat. In an infographic, īnanga show how changes to freshwater ecosystems are affecting this native fish.
We don’t have enough information to assign a conservation status to some of our species, particularly invertebrates. Nor do we have full understanding of how species and ecological processes (like decomposition) interact.
It is difficult to measure the overall condition of our ecosystems because they are complex systems and have large variations in landscape and climate.
The other issues highlighted in this report also threaten our freshwater species and ecosystems:
All of New Zealand’s freshwater environments are affected – habitats for many species are degraded and reduced in size.
There are major differences from natural conditions, with some species not found in areas they once inhabited.
Many changes to freshwater ecosystems are slow to reverse, and some are irreversible.
Loss of species and ecosystems could have significant impacts on our identity, wellbeing, cultural values, and economy.
New Zealand has a diverse range of native freshwater fish, plants, invertebrates, and birds that depend on freshwater ecosystems. Many of these species are found nowhere else in the world and some are only found in particular locations.
Taonga or culturally significant plant and animal species are treasured by Māori. All taonga have a mauri (life force), a wairua (spirit or soul), a tapu (sacredness), and mana (prestige). The endurance, sustenance, and heartbeat of Māoritanga (culture and way of life) is bound to the survival of these taonga.
The Department of Conservation’s New Zealand Threat Classification System assesses the current risk of extinction to New Zealand species. Expert panels determine the conservation threat status using population factors, including the number of breeding pairs, past and predicted changes in population, and pressure from human-induced effects. Not all native species are assessed because the available data is limited.
Species can be:
In 2017, 76 percent of our native freshwater fish (39 of 51 species) were either threatened with or at risk of extinction. Most of these species (32 of the 39) are members of the galaxiidae family.
Galaxiids that are taonga species and threatened or at risk include all five species of mudfish, four whitebait species (shortjaw kōkopu, giant kōkopu, kōaro, and īnanga), lamprey (kanakana/piharau), longfin eel (tuna), and Stokell’s smelt.
The conservation status worsened for one freshwater fish (southern flathead galaxias) and improved for another freshwater fish (lowland longjaw galaxias (Waitaki River)) from 2013 to 2017. One freshwater fish, the once common and widespread New Zealand grayling, is extinct.
More than 25 percent of native freshwater invertebrates assessed (177 of 670 species) had a threatened or at risk conservation status in 2018. Of these, South Island freshwater crayfish (kēkēwai/wai kōura) and two of three species of freshwater mussel (kākahi/kaaeo) are taonga species. The threat status of one invertebrate (tadpole shrimp) worsened from 2013 to 2018.
Almost 33 percent of assessed native freshwater plants (182 of 559 species) were threatened or at risk in 2013. Of these, almost 20 percent were in the highest risk category: nationally critical. One plant (a species of chickweed) is extinct (Gerbeaux et al, 2016).
Many of our native birds depend on freshwater environments and 66 percent of these (19 of 29 species) were classified as threatened or at risk in 2016. These include taonga species such as kāki (black stilt), whio (blue duck), and kōtuku (white heron). From 2012 to 2016 the conservation status worsened for one freshwaterdependent bird (Australasian bittern/matuku) and improved for two birds (Campbell Island teal and New Zealand dabchick). Eleven freshwater birds (some of which were taonga species) are extinct. (See indicator: Conservation status of indigenous freshwater species.)
If you are on a mobile device, you can view the graph better on the StatsNZ website.
Note: Total species in this figure refers to the total number of species assessed. Complete assessments are those where all known species in the group have been assessed. Partial assessments are those where not all species in the group have been assessed.
Rare, quirky, and unusual, Canterbury mudfish (kōwaro) typify the uniqueness and adaptability of New Zealand’s native species. They are nocturnal, gulp air if the water is low in oxygen, and can survive out of water. These fish belong to the galaxiidae family and are one of only five species of mudfish found in different parts of New Zealand. Canterbury mudfish were recorded as a taonga species in the Ngāi Tahu Settlement Act (1998).
Mudfish like to live in swampy, wet, overgrown areas if there’s plenty of water around. When the rains stop, the weather warms, and wetlands dry up, they undergo the summer equivalent of hibernation – burrowing into damp places under logs, in thick vegetation, or mud. Months later when the first autumn floods come, out they wriggle again.
But Canterbury mudfish have not been adaptable enough to thrive in the combination of changes that people have made to their habitat in the past 150 years. They were originally found throughout the Canterbury Plains but are now limited to small pockets of remaining wetland from Christchurch to the Waitaki River. Losses have continued, even from areas where there were remnant populations in the 1990s.
Large-scale changes to land use have occurred in Canterbury, with wetlands drained, streams channelled, fertiliser applied, and water taken from natural waterways and re-applied through irrigators. Mudfish have colonised artificial stock water races, but these are now being closed. Add to this the lack of legal protection, the effects of predatory brown trout, and drought, and the survival of Canterbury mudfish looks bleak.
The conservation status of this species is nationally critical, – and has been since 2009. This is the highest threat status – the same as kākāpo, black robin, and rock wren. In the Department of Conservation’s (DOC’s) 2017 freshwater fish conservation status report, the panel noted that “its persistence is now tenuous” and that urgent action to protect its habitat is needed to avert extinction.
People are taking notice of the serious trouble these little fish are in. The community, regional council, DOC, Ngāi Tahu, and private landowners are involved in essential conservation initiatives.
Pupils and staff at St Andrew’s School near Timaru are champions for the species. In the past six years they have been working to increase the population in a spring-fed stream just a kilometre from the school. With DOC, Working Waters Trust, and a local farmer they have excavated new ponds, removed weeds, and planted natives beside the water. Regular monitoring using fish traps (baited with marmite) shows the effects of their work in a growing population, and the school has been recognised in conservation awards.
Environment Canterbury led a project with Fonterra, DOC, Taumutu rūnanga, and landowners to install an electric ‘fence’ in a tributary of the Hororata River, about 50 kilometres west of Christchurch. The solarpowered barrier sends electric shocks across the river, which stun approaching trout and causes them to be swept downstream. Good numbers of mudfish were living further upstream, but this barrier will give them 10 percent more habitat that is protected from trout and allow the population to grow.
Many of the freshwater habitats that our native species rely on have been reduced or damaged – sometimes entire ecosystems have been degraded. This has made some species particularly vulnerable to extinction.
Wetlands are taonga for Māori as they were often plentiful sources of important plants. These included harakeke and raupo used for weaving; and plants and trees that were used for carving and making tools. Wetlands were also ripe picking grounds for rongoā plants (medicinal plants) (Harmsworth, 2002).
An estimated 90 percent of wetland habitats, especially swamps, have been drained since pre-human settlement. Most wetlands, particularly those on flatter land near the coast, are now small remnants surrounded by developed land (Myers et al, 2013). (See indicator: Wetland extent.)
At least 214 individual wetlands with an area of 1,247 hectares were lost between 2001 and 2016 (Belliss et al, 2017). The loss of these precious ecosystems can be rapid and substantial – 157 hectares of wetland were lost per year in Southland between 1990 and 2012 (Robertson et al, 2018). Wetland loss and a decline in wetland health go hand in hand (Clarkson et al, 2015) – 60 percent of New Zealand’s remaining wetlands are estimated to be in a moderately to severely degraded state (Ausseil et al, 2011).
Soil washed from the land can degrade habitats when it settles as sediment on a streambed. Sediment fills in the spaces at the bottom of a stream that fish and invertebrates use to hide and breed, and sediment also makes their food harder to find. Fine sediment has negative effects on streambed life when it covers more than 20 percent of a streambed that would naturally be covered in stones or gravel (Clapcott et al, 2011; Burdon et al, 2013) – a level of cover found in 23 of 215 sites assessed between 2014 and 2019. (See indicator: Deposited sediment in rivers.)
Modifying waterways with dams, pipes, concrete or rock banks, and constraints to a natural shape (such as forcing a wide floodplain into a narrower channel), can destroy and damage habitat. Removing riverside (riparian) vegetation from the banks of a waterway also reduces habitat for native species like īnanga (Jowett et al, 2009).
The characteristics and condition of river and stream habitats affect the range of plants and animals that can live there (Harding et al, 2009). Several measures are used to assess the state of the physical habitat in a stream or river. These include sediment, channel shape, bank erosion, riparian vegetation, as well as the quality, quantity, and diversity of habitat for fish and invertebrates. Between 2013/14 and 2018/19, the habitat was assessed at 369 sites in six regions in the North Island and 90 in Southland (in rivers that were small enough to be crossed by wading). The habitat was good or excellent at 79 percent of the sites and fair at 21 percent. No sites were in poor condition. (See indicator: Freshwater physical habitat.)
Regional councils collect data on the amount of periphyton (the natural growth on rocks and riverbeds) but this information does not yet provide a detailed national view. Neither does it show how the amount of periphyton in rivers is changing. Computer models can use council data to estimate the amount of periphyton using nutrient concentrations, river flows, and the type of sediment on the riverbed. At the moment, however, the models only work well at a regional scale because of variations between regional datasets and lack of robust data for some regions (Kilroy et al, 2019).
Assessing the health of an ecosystem is a complex process (see ‘Measuring the health of an ecosystem’ box). Although information about ecosystem health is presented in this report, it is not comprehensive enough to provide an overall assessment.
An ecosystem is a complex tangle of relationships between living things and the environment. Ecosystem health is measured by assessing a number of factors like biodiversity, the quality of habitats, and how well the essential processes like photosynthesis and decomposition are working.
Five components are used to assess the health of freshwater ecosystems (Clapcott et al, 2018):
Measuring these components varies according to the type of ecosystem – lakes, wetlands, rivers, and estuaries are all quite different. Measuring all components of an ecosystem is challenging (especially aquatic life and ecological processes), and this currently limits our ability to comprehensively assess the health of most of our ecosystems.

Read the long description for Freshwater ecosystem health
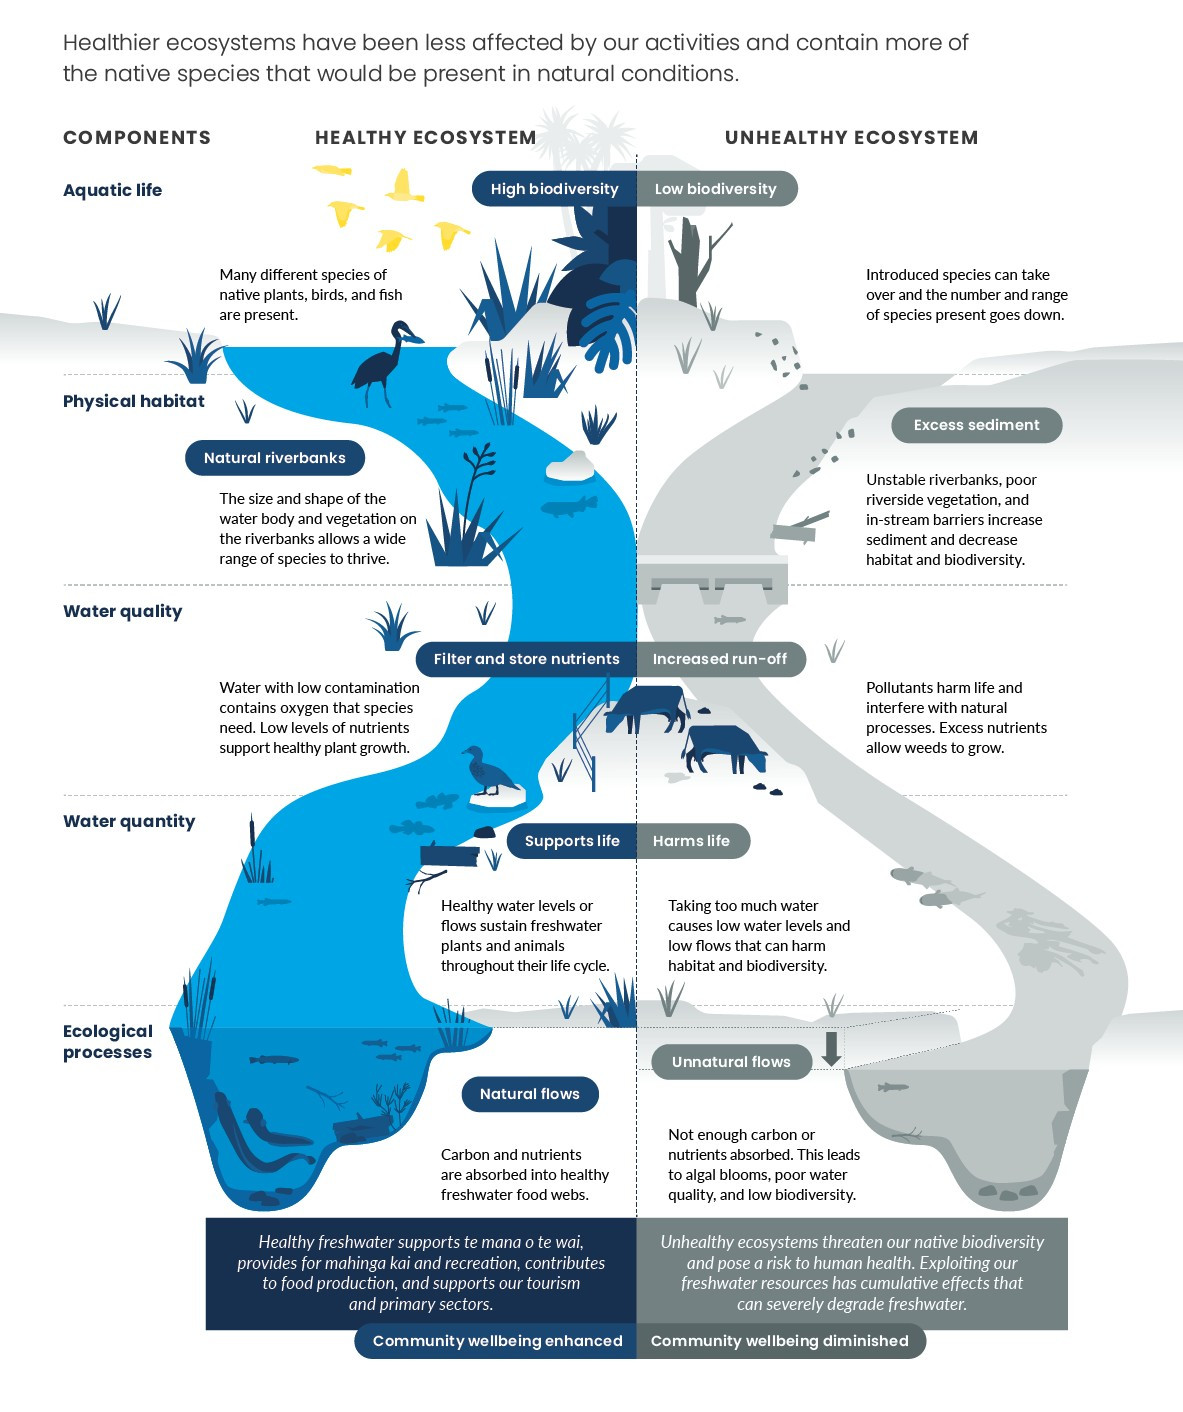
Healthier ecosystems have been less affected by our activities and contain more of the native species that would be present in natural conditions.
Aquatic life: In a healthy ecosystem, many different species of native plants, bird, and fish are present. In an unhealthy ecosystem, introduced species can take over and the number and range of species present goes down.
Physical habitat: In a healthy ecosystem, the size and shape of the water body and vegetation on the riverbanks allows a wide range of species to thrive. In an unhealthy ecosystem, unstable riverbanks, poor riverside vegetation, and in-stream barriers increase sediment and decrease habitat and biodiversity.
Water quality: in a healthy ecosystem, water with low contamination contains oxygen that species need. Low levels of nutrients support healthy plant growth. In an unhealthy ecosystem, pollutants harm life and interfere with natural processes. Excess nutrients allow weeds to grow.
Water quantity: In a healthy ecosystem, healthy water levels or flows sustain freshwater plants and animals throughout their life cycle. In an unhealthy ecosystem, taking too much water causes low water levels and low flows that can harm habitat and biodiversity.
Ecological processes: In a healthy ecosystem, carbon and nutrients are absorbed into healthy freshwater food webs. In an unhealthy ecosystem, not enough carbon or nutrients are absorbed which leads to algal blooms, poor water quality, and low biodiversity.
Healthy freshwater supports te mana o te wai, provides for mahinga kai and recreation, contributes to food production, and supports our tourism and primary sectors. Community wellbeing is enhanced.
Unhealthy ecosystems threaten our native biodiversity and pose a risk to human health. Exploiting our freshwater resources has cumulative effects that can severely degrade freshwater. Community wellbeing is diminished.
The ecological health of a river can be assessed by comparing the numbers and types of native and non-native fish in its habitats (its fish community) with what would be expected under natural conditions. One method is the freshwater fish index of biotic integrity (IBI), which scores a river from 0 to 60 (Joy & Death, 2004).
A study of more than 5,900 observations from NIWA’s freshwater fish database for 1999–2018 reported that 34 percent of rivers had fish IBI scores above 40, which indicates a healthy native fish community. However, 18 percent had fish IBI scores below 20, which is an indication of degraded native fish communities (MfE, 2020). Sites with low fish IBI scores were mostly in Southland, Otago, and the centre of the North Island (see figure 2).
The macroinvertebrate community index (MCI) measures water quality and river ecological health using the presence or absence of different organisms (see ‘Macroinvertebrate community index’ box). Computer models of the MCI scores for all rivers for 2013–17 estimated that more than three-quarters of New Zealand’s total river length had scores classified as excellent or good for pollution levels. However, lowland parts of Southland, Canterbury, Manawatū, Waikato, and Northland have large areas with lower modelled MCI scores (see figure 3).
For the 573 river sites where MCI was measured for 2008–17, 38 percent had worsening trends, 26 percent had improving trends, and 37 percent had indeterminate trends. (See indicator: River water quality: macroinvertebrate community index and figure 3.)
Macroinvertebrates are animals like insects and snails that have no backbone but are visible with the naked eye. Macroinvertebrates are a useful way to measure the health of a river because they stay in a relatively small area through their life cycle, and therefore reflect the local conditions.
Different species are more or less sensitive to changes in the river (like pollutants, water flows, and habitat) and are given scores according to their ability to survive change. The macroinvertebrate community index score for a site is derived from the average score for the individual macroinvertebrates found there.

Image: New Zealand Freshwater Fish Database (Data source)
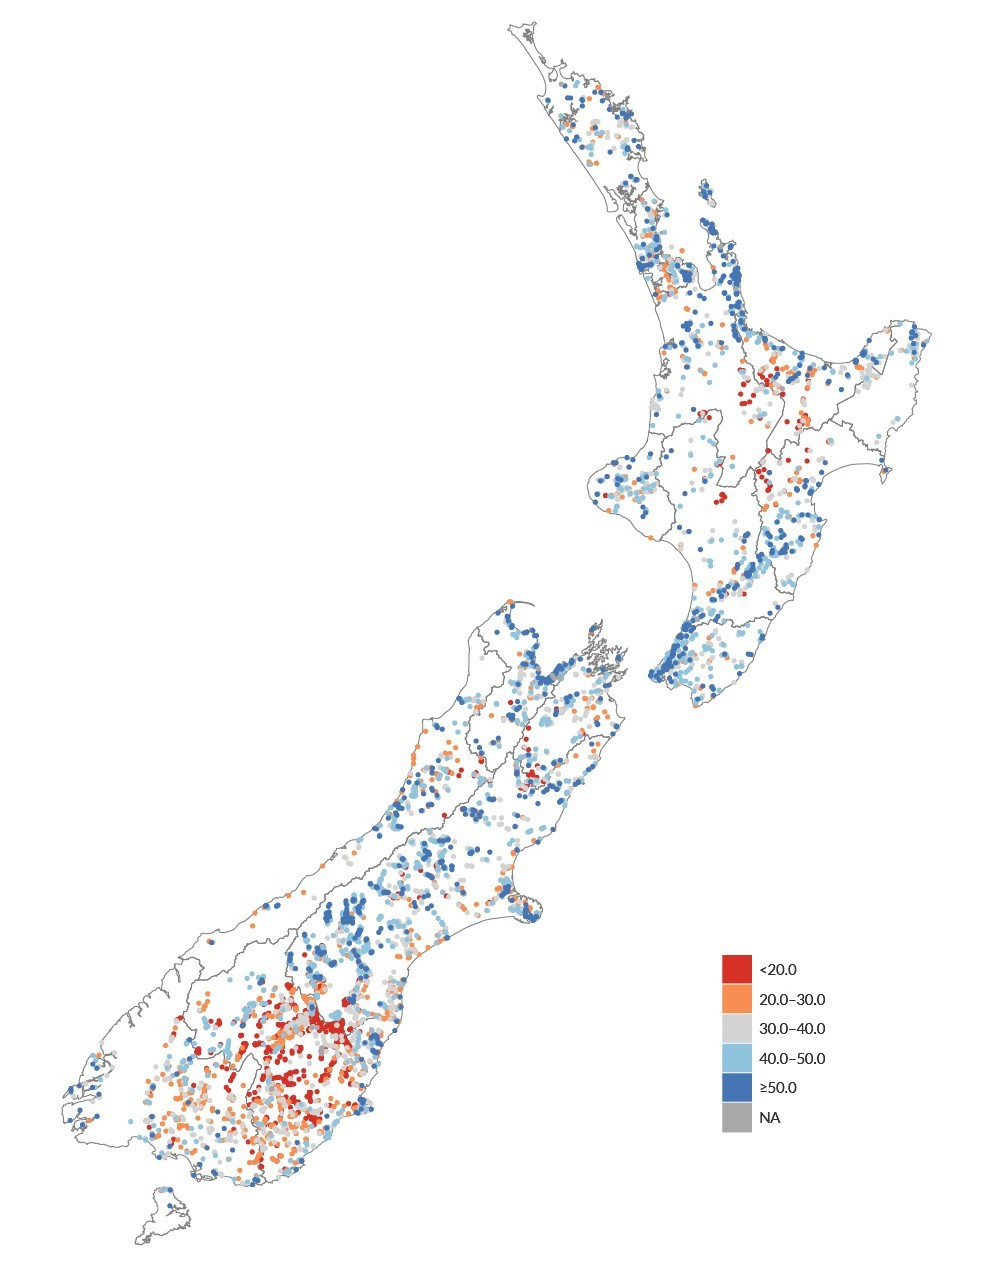
Image: New Zealand Freshwater Fish Database (Data source)
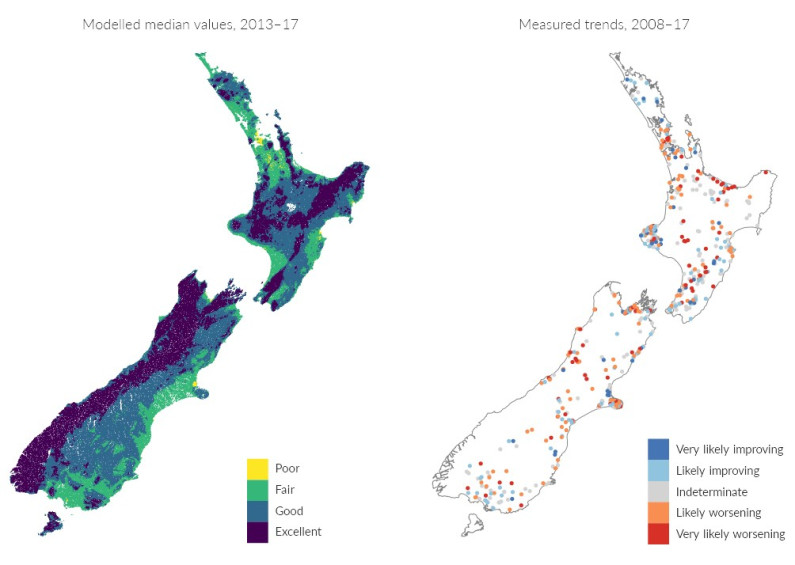
Image: NIWA (Data source)

Image: NIWA (Data source)
In lakes, the submerged plant index (SPI) measures ecological health by the proportion of native and invasive plants that are present. A higher percentage of native plants indicates better ecological health, while a higher percentage of invasive plants indicates poorer ecological health. Lakes with no plants are considered to be highly degraded.
SPI data is only available for 295 lakes, although there are 3,820 lakes larger than 1 hectare in New Zealand (Schallenberg et al, 2013). In the period 1991–2019 for lakes with SPI data, 34 percent were in excellent or high ecological condition, 31 percent were in moderate condition, and 36 percent were in poor condition or lacking submerged plants. Only 12 percent of the lakes with SPI data had no invasive plants present. (See indicator: Lake submerged plant index.)
If you are on a mobile device, you can view the graph better on the StatsNZ website.
The lake trophic level index (TLI) also assesses ecological health using the concentrations of chlorophyll-a (a measure of the quantity of phytoplankton), nitrogen, and phosphorus. Lakes with good or very good TLI ratings have low concentrations of nutrients and algae, and clear water (unless they are naturally cloudy). Lakes with poor or very poor TLI are often murky and have high nutrient concentrations and frequent algal blooms. These lakes have habitats that are not suitable for some native freshwater species and may not be useable for recreation (eg Lake Horowhenua in Manawatū-Whanganui).
Computer models estimated that for 2013–17, the median TLI rating for 3,802 lakes larger than 1 hectare was very good or good for 15 percent of lakes, average for 38 percent of lakes, and poor or very poor for 46 percent (see figure 4). (See indicator: Modelled lake water quality.)
If you are on a mobile device, you can view the graph better on the StatsNZ website.
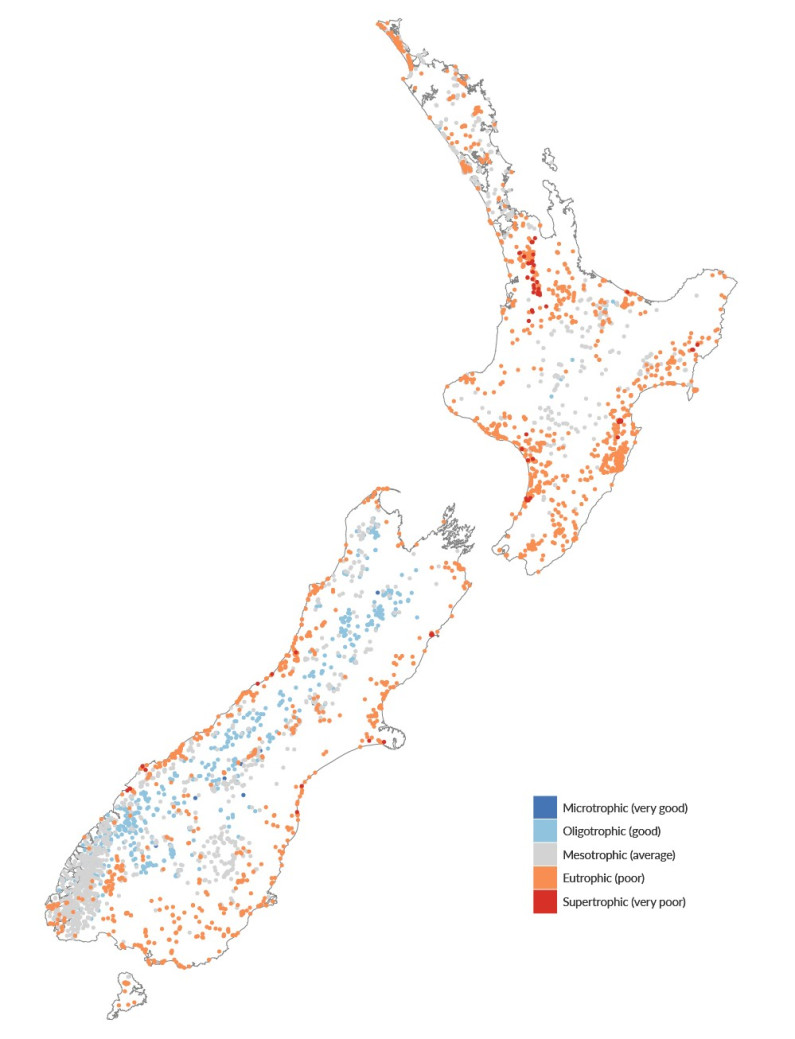
Image: LAWA (Data source)

Image: LAWA (Data source)
Before humans arrived in New Zealand, forests covered about 80 percent of our land, but in 800 years it has been transformed (Nicholls, 1980). Waves of settlers from Polynesia and Europe cleared areas of forest and drained wetlands to make way for farming and settlements (McGlone, 1989; Clarkson et al, 2007; Gluckman et al, 2017). This led to a loss of habitats and a decline in the number of species. About one-third of original forest and only 10 percent of wetlands remain. (See indicators: Predicted pre-human vegetation, Indigenous land cover, and Wetland extent.)
Converting land in our catchments to cities, farms, and forestry in order to live and make a living has reduced the water quality and ecological condition of rivers and lakes (see Issue 2: Water is polluted in urban, farming, and forestry areas).
The effects of land conversion and our activities on freshwater ecosystems are assessed by comparing freshwater ecosystem health in catchments where the dominant land cover is urban, pastoral farming, or exotic forestry (the urban, pastoral, and exotic forest land-cover classes) with catchments where the dominant land cover is native vegetation (the native land-cover class). Although catchments in the native land-cover class are the least affected by our activities, they are not representative of natural conditions because by definition they can include some urban, pastoral, and exotic forest land cover (see Water quality and land-cover classes).
Lakes with upstream catchments in the urban, pastoral, and exotic forest land-cover classes have poorer ecological health than those in the native land-cover class. Modelled TLI ratings estimated that 71 percent of lakes (larger than 1 hectare) in these catchments had a rating of poor or very poor in 2013–17. Only 19 percent of lakes with upstream catchments in the native land-cover class had a TLI rating of poor or very poor. SPI scores were also lower for 295 monitored lakes with catchments in the urban and pastoral land-cover classes than for those in the native and exotic forest land-cover classes. (See indicators: Modelled lake water quality and Lake submerged plant index.)
Rivers also have poorer ecological health in catchments in the urban and pastoral land-cover classes than rivers in catchments in the native land-cover class. For 2013–17, the median modelled MCI scores (when compared with catchments dominated by native land cover) were 33 percent lower for catchments with dominant urban land cover and 15 percent lower for catchments with dominant pastoral land cover. (See indicator: River water quality: macroinvertebrate community index.)
Lower fish IBI scores were also found at river sites with more upstream pastoral land cover than sites with more upstream native land cover. For 1990–2018, fish IBI scores were generally better at river monitoring sites with more upstream native land cover (Joy et al, 2018). Fish IBI scores were not assessed using dominant land-cover classes.
For 369 North Island river monitoring sites, there were a greater proportion of sites with physical habitat in a good or excellent condition in catchments dominated by native land cover compared to those dominated by pastoral, exotic forest, or urban land cover. (See indicator: Freshwater physical habitat.)
If you are on a mobile device, you can view the graph better on the StatsNZ website.
The amount of sediment covering streambeds was also greater at river sites in catchments in the urban land-cover class, compared with sites in catchments in the pastoral, exotic forest, and native vegetation. (See indicator: Deposited sediment in rivers.)
If you are on a mobile device, you can view the graph better on the StatsNZ website.
Many of our native fish need to migrate up and downstream and to and from the sea to complete their life cycles (McDowall, 2010; Franklin et al, 2018). Structures like dams, weirs, culverts, and tide gates in streams and rivers can make these migrations difficult or impossible, reduce fish populations, and affect natural stream processes (Franklin et al, 2018). (See indicator: Selected barriers to freshwater fish in Hawke’s Bay and Issue 3: Changing water flows affect our freshwater.)
The commercial catch of short and longfin eel is managed by the Ministry for Primary Industries under the quota management system. Fishing, habitat loss, and barriers to fish migration have reduced the number of large longfin eels nationwide. Large longfin eels are now found mainly in small streams and remote locations where there is no eel fishing (Graynoth et al, 2008; Jellyman et al, 2000). Customary fishing has also declined (MPI, 2014). Lamprey, kōura, black flounder, and mullet are also targeted by commercial and recreational fishers.
Whitebait are the juveniles of five species of galaxiid and one species of smelt. They are managed collectively by the Department of Conservation as a recreational fishery. In the spring, shoals of whitebait migrate from the sea into rivers and streams, but the shoals have declined from historic levels. Contributing factors include a loss of fish habitat (particularly wetlands) and damage and loss of spawning sites (Hickford & Schiel, 2011). The effects of these changes – as well as the pressure of whitebait fishing – on the quantity and distribution of whitebait are not known (Goodman, 2018).
Some of the animals and organisms that humans brought to New Zealand pose significant threats to our native freshwater species. Introduced species compete with native species for food and space, and damage existing habitats.
There are now 21 species of non-native freshwater fish in New Zealand (Collier & Grainger, 2015). Nine of these have been identified as being species of greatest concern, including koi carp, perch, and bullhead catfish. (See indicator: Freshwater pests.) Introduced fish accounted for more than 80 percent of the fish species observed at 925 river sites from 1999–2018, particularly in parts of Otago and the central North Island (MfE, 2020).
Koi carp have some of the worst effects on our freshwater ecosystems. These fish are native to Asia and were accidentally introduced to New Zealand in the 1960s. Koi carp stir up sediment and nutrients while they feed. Disturbed nutrients can lead to algal blooms. Suspended sediment and algal blooms block out light and reduce the amount of native freshwater plants (that provide habitat for native species) (Collier & Grainger, 2015; Schallenberg et al, 2013; NIWA, 2019; Rowe, 2007). In some places such as the lower Waikato River, koi carp can account for up to 70 percent of the total amount of fish by weight (Hicks et al, 2010).
Trout and salmon fishing have recreational and economic benefits for New Zealand, but can have negative effects on rivers and streams. In many waterways, trout have replaced native galaxiids as the dominant fish species and changed where kōura are found (Mcintosh et al, 2010; Usio & Townsend, 2000).
New Zealand’s freshwater ecosystems also have 41 introduced plant and algae species. (See indicator: Freshwater pests.) Many introduced plants (like hornwort Ceratophyllum demersum) form tall, dense weed beds and spread quickly (Wells et al, 1997; de Winton et al, 2009). These plants can take the place of native freshwater species, and make the habitat unsuitable for native fish and invertebrates (Champion et al, 2002; Clayton & Champion, 2006).
There are 11 introduced invertebrates in our freshwater ecosystems, including seven species of snail.
Didymo (Didymosphenia geminata) is an introduced algae that can form thick, dense mats – sometimes over entire streambeds. It changes the populations of invertebrates in a stream and therefore reduces the number of native fish and trout because they prey on invertebrates. Since its discovery in 2004, didymo has spread to more than 150 waterways in the South Island, but has not yet been detected in the North Island (Jellyman & Harding, 2016; MPI, 2020).
Introduced species like rats and mice can also affect native freshwater birds, fish, and invertebrates. Mice, for example, eat īnanga eggs laid in long grass beside estuaries (Baker, 2006).
Other issues discussed in this report also contribute or are related to the loss of biodiversity:
Healthy species, habitats, and ecosystems provide us with benefits (or ecosystem services) (Cardinale et al, 2012; Clarkson et al, 2013; Schallenberg et al, 2013). Freshwater fish move nutrients by feeding and migrating between different habitats (Vander Zanden & Vadeboncoeur, 2002). Longfin eels are the top predators in rivers and control lower levels of the food chain. They also cycle nutrients by feeding and scavenging (Jellyman, 2012).
Wetland habitats and ecosystems provide benefits like storing carbon as peat, regulating water flow during storms, and purifying water by filtering out nutrients and sediments (Clarkson et al, 2013; Schallenberg et al, 2013). Reducing the extent of wetlands and the number of native freshwater fish therefore influences these important processes.
There are benefits for people and for nature when a reciprocal relationship between humans and the natural world is in place. Giving back to nature (by planting natives beside a stream, for example) creates vitality in an environment, and our wellbeing is uplifted when the environment is healthy and vigorous.
In te ao Māori, a Māori world view, people are part of the environment. Although degraded ecosystems and the loss of native species are bad for everyone, such losses can cause a disconnection in identity and culture for Māori.
Nature provides mahinga kai (food gathering) and materials for practices like raranga (weaving) and rongoā (medicinal uses) as well as seasonal indicators for managing the environment. These elements are essential for maintaining and passing mātauranga (knowledge) from one generation to another. With loss of species and ecosystems, the quality and quantity of food and materials available can be reduced. This affects important cultural values, beliefs, and practises (Harmsworth & Warmenhoven, 2002).
Cultural practices that use native species and natural materials are vital for maintaining and reinforcing values like mana (prestige), ahikāroa (connection with place), whanaungatanga (family ties and links), mātauranga (knowledge systems), and whakaheke kōrero (passing knowledge to the next generation) (Harmsworth & Awatere, 2013; Lyver et al, 2017a, 2017b). Losing the ability to collect mahinga kai can jeopardise the mana of an iwi, hapū, or whanau providing food for their guests (Collier et al, 2017) and compromise the cultural use of a species (Noble et al, 2016; Schallenberg et al, 2013; McDowall, 2011).
The cultural health index (CHI) assesses the health of freshwater ecosystems using factors that are important to Māori. It has three components: site status, mahinga kai status, and cultural stream health (Tipa & Teirney, 2006). For 41 sites assessed between 2005 and 2016, 11 sites had good or very good CHI ratings, 21 had moderate scores, and 9 had poor or very poor ratings. (See indicator: Cultural health index for freshwater bodies and Issue 2: Water is polluted in urban, farming and forestry areas.)
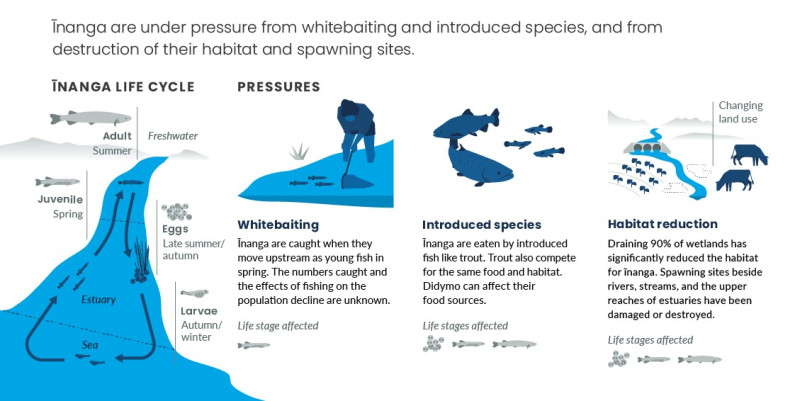

Read the long description for How ecosystem pressures affect īnanga
Īnanga are under pressure from whitebaiting and introduced species, and from destruction of their habitat and spawning sites.
Whitebaiting – īnanga are caught when they move upstream as young fish in spring. The numbers caught and the effects of fishing on the population decline are unknown. This affects the juvenile stage of the īnanga life cycle.
Introduced species – īnanga are eaten by introduced fish like trout. Trout also compete for the same food and habitat. Didymo can affect their food sources. This affects the egg, juvenile, and adult stages of the īnanga life cycle.
Habitat reduction – Draining 90% of wetlands has significantly reduced the habitat for īnanga. Spawning sites beside rivers, streams, and the upper reaches of estuaries have been damaged or destroyed. This affects the egg, juvenile, and adult stages of the īnanga life cycle.
Information is missing at a species level. The conservation status of 27 percent (178 species) of assessed freshwater invertebrates is data deficient. The number of freshwater invertebrates, non-vascular plants, and algae assessed does not include all species. Some groups of species, and life stages within species, are not well studied. Many species are yet to be described.
Measuring the condition of ecosystems is difficult (Andreasen et al, 2001) because the systems themselves are complex, and climate and landscape variations are overlaid.
Despite recent efforts to improve freshwater quality, we still have incomplete knowledge about the condition of our freshwater ecosystems, habitats, and their plant, fish, and invertebrate communities. For example, although the area of wetlands has declined, little is known about the condition of the wetlands that remain. Our knowledge about large rivers and the biology of groundwater ecosystems is also poor (Sirisena et al, 2013). Only 4 percent (about 150) of the 3,820 lakes larger than 1 hectare are regularly monitored by regional authorities (Larned et al, 2019). Data for freshwater species interactions and ecological processes is poor.
At present, there is not enough high-quality data available to describe all the aspects of a healthy ecosystem. This means it is only possible to assess some aspects of ecosystem health, rather than its entirety. For example, the number of freshwater species that are threatened and at risk of extinction can be reported, but an assessment of what functionality is being lost as a result of their decline cannot be made.
Issue 1: Our native freshwater species and ecosystems are under threat
April 2020
© Ministry for the Environment