Chapter 2: Our activities are driving emissions

The products we buy, the food we eat, the way we travel, and the goods and services we produce can all cause emissions of greenhouse gases.

Image: Sarah Wilcox, Descipher
Many of the things we do every day produce greenhouse gases. Those emissions can be caused directly, by travel or a production process for example, or indirectly because of the energy required to fuel those processes.
There are many different greenhouse gases, but the most important ones for climate change are carbon dioxide, methane, and nitrous oxide. Globally, continued emissions of greenhouse gases is causing them to accumulate in the atmosphere and warm the climate. The contribution that smaller countries like New Zealand make to global emissions also adds up.
Carbon dioxide has the biggest effect on future warming globally because it is emitted in large quantities by many different processes. Also, part of every emission stays in the atmosphere for hundreds to thousands of years. Methane is important because it has a more intense but shorter-term warming effect. Other human activities like removing trees and releasing soot contribute to the build-up of greenhouse gases and warming.
Increased economic activity (measured as gross domestic product, GDP) and population growth are the most significant high-level forces (or drivers) that shape the amount and type of emissions produced. These drivers have caused most of the growth in greenhouse gas emissions in New Zealand and globally, but improvements in energy efficiency and a greener energy supply have offset some of the increase.
Most of the world’s energy needs are met by burning fossil fuels, which releases carbon dioxide. The rise in global emissions has been dramatic: half of all human-generated carbon dioxide emissions since 1750 have occurred since 1970 (IPCC, 2014a). Humans added about 42 gigatonnes of carbon dioxide to the atmosphere in 2018, more than 190 times the weight of every person in the world combined (Bar-On, Phillips, & Milo, 2018; Friedlingstein et al., 2019).
Global carbon dioxide emissions from fossil fuels in 2018 were about 2.1 percent more than 2017, and higher than the 1.3 percent average increase per year for the previous decade (2009–18) (see figure 1). Most of the emissions were from burning coal (40 percent), oil (34 percent), and natural gas (20 percent) (Friedlingstein et al., 2019).
This rate of increase is dramatic. It is causing changes to the climate that challenge the ability of our social, economic, and environmental systems to adapt. Although Earth’s climate has varied naturally in the past, even ‘abrupt’ natural changes at the global scale have typically taken many hundreds to thousands of years. But now is different. Current carbon dioxide levels in the atmosphere have increased about 100 times faster than the fastest rise at the end of the last ice age (Gaffney & Steffen, 2017).
In the previous 7,000 years, the climate was cooling slightly at a rate of -0.01 degrees Celsius per century. But this has changed, mainly because of human activities that increase greenhouse gas concentrations in the atmosphere (IPCC, 2014a). In the past 45 years the global average temperature has increased about 170 times faster than the rate of change before humans began emitting greenhouse gases in large amounts (Gaffney & Steffen, 2017).
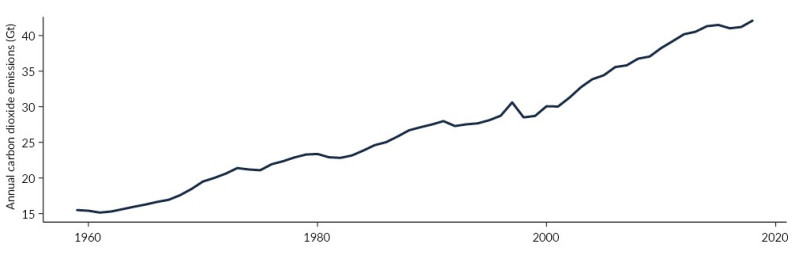
Image: Friedlingstein et al, 2019 (Data source)
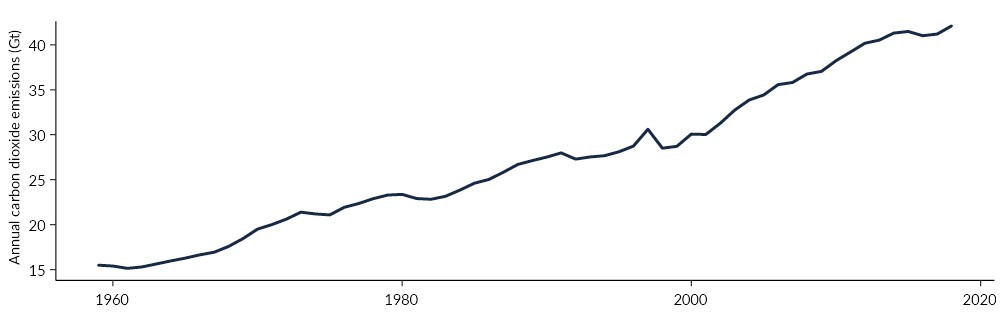
Image: Friedlingstein et al, 2019 (Data source)
Three countries and the European Union emitted 59 percent of all carbon dioxide in 2018 – China 28 percent, the USA 15 percent, the European Union 9 percent, and India 7 percent. These areas include many of our trading partners that produce goods and services we import and use every day (see New Zealand’s consumption-based carbon dioxide emissions). The rest of the world emitted the remaining 41 percent (Friedlingstein et al., 2019).
Some countries have decreased their carbon dioxide emissions in the last decade (2009–18). This includes the European Union (by 1.4 percent per year) and the USA (by 0.5 percent per year). Nineteen countries (mainly in the European Union) decreased their emissions while their economies grew, but some of the decrease may be due in part to moving the production of goods to other countries (Friedlingstein et al., 2019; IPCC, 2014b).
The result of all of these emissions is that greenhouse gases are building up in the atmosphere faster than they are removed, and their concentrations are increasing. This accumulation of carbon dioxide in the atmosphere is the most important factor governing the amount of global warming we will experience this century and beyond (IPCC, 2014a).
In May 2020, carbon dioxide concentrations reached a seasonal peak of 417 parts per million at the Mauna Loa Observatory in Hawaii. This observatory has the world’s longest unbroken record of carbon dioxide measurements directly from the air, and this is the highest monthly reading ever recorded (NOAA, 2020). Global levels of carbon dioxide in the atmosphere are now at their highest level for the past 3 million years at least (Willeit, Ganopolski, Calov, & Brovkin, 2019).
Measurements in New Zealand are consistent with the global concentrations, but are slightly lower in the Southern hemisphere. The concentration of carbon dioxide in the atmosphere measured at Baring Head near Wellington reached 409 parts per million in September 2019. (See indicator: Greenhouse gas concentrations.) This is about 46 percent higher than the pre-industrial level of 280 ppm (IPCC, 2014a).
Methane concentrations at Baring Head have increased by 4 percent in the last decade (2010–19) and reached 1,838 parts per billion in September 2019. This is more than 160 percent higher than pre-industrial levels. Nitrous oxide levels were 23 percent higher than pre-industrial levels and increased by 3 percent in the last decade.
If you are on a mobile device, you can view the graph better on the StatsNZ website.
Greenhouse gas emissions can be estimated using different approaches (see Approaches to measuring New Zealand’s greenhouse gas emissions on the Stats NZ website). A production-based approach counts all emissions that are created within our border by the production of all goods and services, whether they are exported or used in New Zealand. A consumption-based approach counts emissions that are created from producing the goods and services we consume here, whether they are imported or produced locally. Both are shown to give a fuller understanding of the sources of our emissions. Note: consumption-based emissions estimates were only available for carbon dioxide when this report was prepared.
The New Zealand greenhouse gas inventory publishes estimates of greenhouse gas emissions each year as part of our international reporting obligations. This reporting only counts emissions that are produced in New Zealand. Information on the production of emissions from an industry and household, and regional basis is available from Stats NZ. Information from Stats NZ on consumption-based emissions at a national level was not available when this report was prepared.
Emissions can be analysed by considering gross emissions (total emissions) and net emissions (total emissions plus carbon dioxide added or removed by land use, land-use change, and forestry). Net emissions are more variable than gross emissions because of the influence of forest planting and harvesting cycles.
For information on how New Zealand’s emissions may change in the future, and how we are tracking towards emission reduction targets see chapter 5: Looking ahead: future emissions and climate.
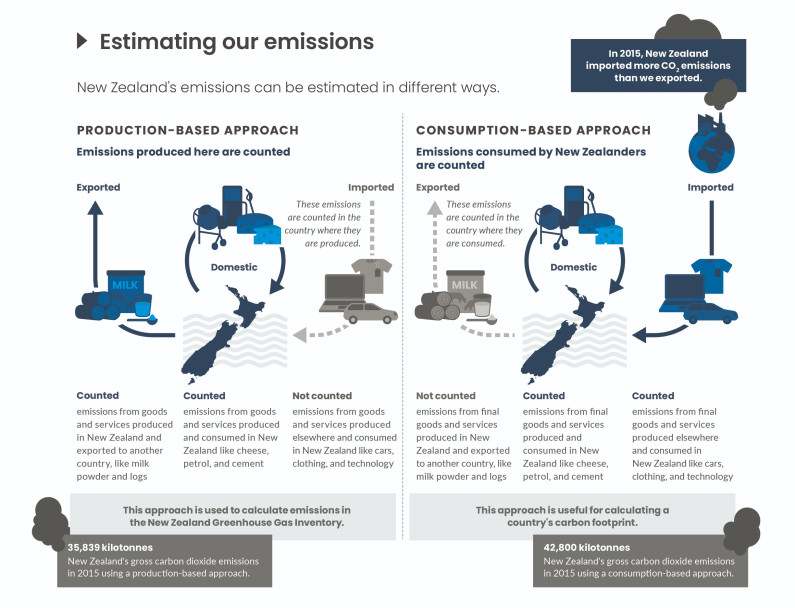

Read the long description for Estimating our emissions
New Zealand’s emissions can be estimated in different ways.
Production-based approach: emissions produced here are counted.
Exported emissions i.e. emissions from goods and services produced in New Zealand and exported to another country, like milk powder and logs, are counted. Domestic emissions i.e. emissions from goods and services produced and consumed in New Zealand like cheese, petrol, and cement, are counted. Imported emissions i.e. emissions from goods and services produced elsewhere and consumed in New Zealand like cars, clothing, and technology are not counted. These emissions are counted in the country where they are produced.
This approach is used to calculate emissions in the New Zealand Greenhouse Gas Inventory.
35,839 kilotonnes, New Zealand’s gross carbon dioxide emissions in 2015 using a production-based approach.
Consumption-based emissions: emissions consumed by New Zealanders are counted.
Exported emissions i.e. emissions from goods and services produced in New Zealand and exported to another country, like milk powder and logs, are not counted. These emissions are counted in the country where they are consumed. Domestic emissions i.e. emissions from final goods and services produced and consumed in New Zealand like cheese, petrol, and cement, are counted. Imported emissions i.e. emissions from goods and services produced elsewhere and consumed in New Zealand like cars, clothing, and technology are counted.
This approach is useful for calculating a country’s carbon footprint.
42,800 kilotonnes, New Zealand’s gross carbon dioxide emissions in 2015 using a consumption-based approach.
New Zealand’s net emissions have increased by 57 percent from 1990 to 2018. (See indicator: New Zealand’s greenhouse gas emissions.) Our gross greenhouse gas emissions in 2018 were 24 percent higher than in 1990 but have changed little in the last decade despite increases in economic activity and population. However, as long as our net emissions of long-lived greenhouse gases (mainly carbon dioxide and nitrous oxide) are greater than zero, we are contributing to further climate change.
The profile (or mix) of greenhouse gases we produce is unusual (see figure 2). In most developed countries, carbon dioxide produced by burning fossil fuels dominates emissions, especially burning coal and gas for electricity, and burning diesel and petrol for transport. A large proportion (84 percent in 2018) of New Zealand’s electricity has renewable sources so electricity generation does not make up a large part of our emissions (MBIE, 2019b).
Nearly half (48 percent) of New Zealand’s gross emissions in 2018 came from agriculture. These emissions, almost all methane and nitrous oxide, increased 5 percent from 2009 to 2018. In a typical developed country, only about 12 percent of total gross emissions come from agriculture (MfE, 2020c). Road transport also makes a large contribution to our gross emissions (19 percent).
If you are on a mobile device, you can view the graph better on the StatsNZ website.
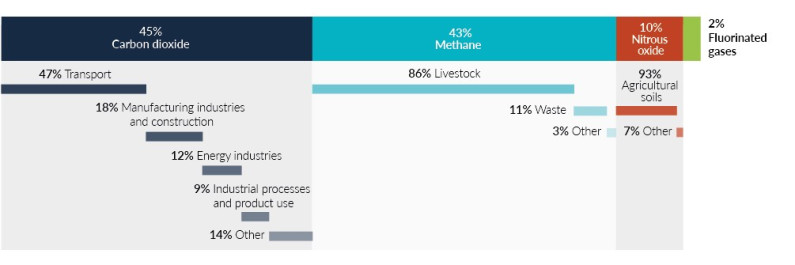
Image: Ministry for the Environment (Data source)
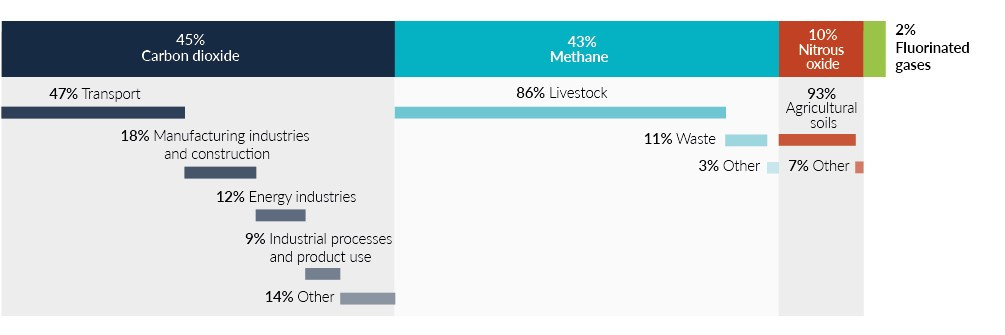
Image: Ministry for the Environment (Data source)
Different greenhouse gases last for different amounts of time in the atmosphere before being removed by natural processes. Long-lived gases can stay in the atmosphere for centuries or even millennia, which allows them to build up. (Nitrous oxide has an average lifetime of 121 years, while carbon dioxide can remain in the atmosphere for thousands of years). Emissions of long-lived gases have to be reduced to zero to stabilise the climate at any temperature.
Short-lived gases typically remain in the atmosphere for years to decades – methane stays in the atmosphere for about 12 years on average. Emissions of short-lived greenhouse gases do not accumulate over centuries and do not have to be reduced to zero to stabilise the climate. However, these gases generally have a powerful warming effect and make the climate warmer than it would be from emissions of carbon dioxide alone. The less we emit, the lower their ongoing contribution to climate change will be.
Different gases also have different abilities to absorb energy or retain heat. The global warming potential (GWP) relates different gases to the average warming produced by carbon dioxide over a given time period, usually 100 years. For example, methane has a GWP of 25 (under current reporting conventions), so in the 100 years following their emission, 1 kilogramme of methane will cause 25 times the average warming as 1 kilogramme of carbon dioxide.
Other greenhouse gases (like hydrofluorocarbons) have very high GWPs – sometimes thousands of times higher than carbon dioxide. These gases are generally short-lived (about 15 years on average) and are emitted in much smaller quantities than carbon dioxide, methane, and nitrous oxide.
GWP is used for reporting under the Paris Agreement and by New Zealand to set and account for its 2030 emissions target under the agreement. GWPs from the Intergovernmental Panel on Climate Change Fourth Assessment Report are used in this report but updated GWPs are available from other sources and will be used in future reporting periods. Other metrics give short-lived gases a greater or lesser weighting compared to carbon dioxide because they focus on effects of the gas on different aspects of climate change.
| Gas | Carbon dioxide | Methane | Nitrous oxide | Hydrofluorocarbons |
|---|---|---|---|---|
| Global warming potential (IPCC, 2007) |
1 | 25 | 298 | Up to 14,800 |
| Lifetime in the atmosphere (IPCC, 2014a) |
Up to thousands of years | 12 years | 121 years | 15 years (weighted by usage of different gases) |
Carbon dioxide is the most important long-lived greenhouse gas for climate change, followed by nitrous oxide. Because long-lived gases build up in the atmosphere, every additional emission of these gases will affect the climate for hundreds to thousands of years into the future. The net emissions of all long-lived gases have to be brought to zero globally for Earth’s warming climate to stabilise.
Other long-lived gases play a similar role but are emitted in much lower quantities. How quickly New Zealand reaches net-zero emissions of these gases will determine how much more our emissions contribute to long-term warming of the climate.
Net carbon dioxide emissions have increased by about 14,700 kilotonnes from 1990 to 2018 (see figure 3).
New Zealand’s gross carbon dioxide emissions were 7.7 tonnes per person in 2017, which is 17th out of 32 OECD countries (with available data) (OECD, 2020; UNPD, 2020). This is despite the high percentage of renewable electricity generated here, and shows the large emissions of carbon dioxide that continue to be produced by sectors such as transport, manufacturing, and construction.
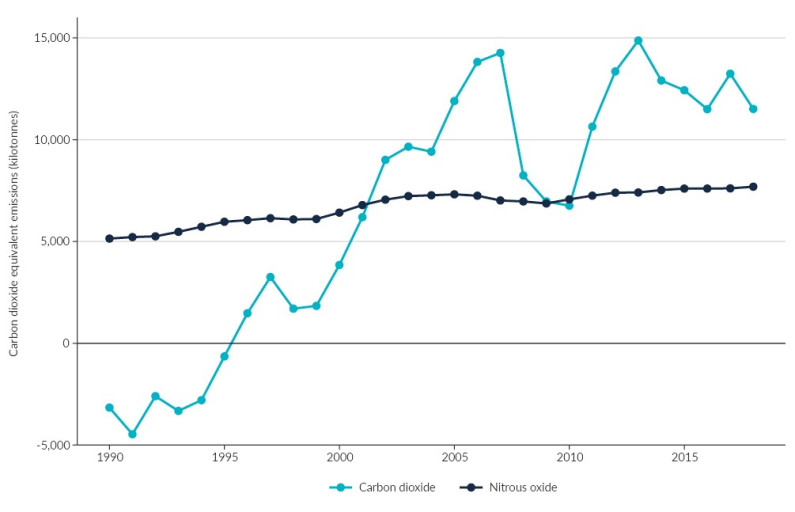
Image: Ministry for the Environment (Data source)

Image: Ministry for the Environment (Data source)
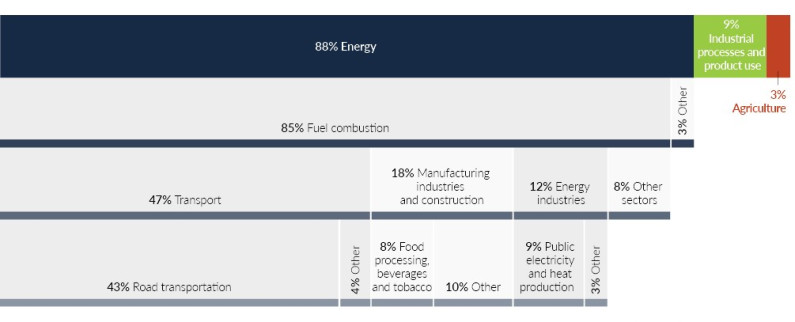
Image: Ministry for the Environment (Data source)

Image: Ministry for the Environment (Data source)
Road transport made up 43 percent of New Zealand’s gross carbon dioxide emissions in 2018 (see figure 4). For 2009–18, emissions from this source increased by 22 percent, about 2,700 kilotonnes. Emissions from light duty trucks had the greatest increase (78 percent, almost 1,700 kilotonnes) during these 10 years.
Cars and other passenger vehicles were responsible for 27 percent of New Zealand’s gross carbon dioxide emissions in 2018. These vehicles emitted 7 percent more carbon dioxide than 10 years previously. Petrol-electric hybrids made up 1 in every 100 light vehicles. Fully electric-powered vehicles made up a tiny but growing portion of New Zealand’s fleet in 2018 at about 2 in every 1,000 light vehicles (MoT, 2019).
New Zealanders’ vehicle preferences are affecting greenhouse gas emissions. Light commercial vehicles such as utes, SUVs, and vans, made up 16 percent of the light vehicle fleet in 2018, 75 percent of which run on diesel (see figure 5). These larger, heavier vehicles are increasingly popular, while sales of smaller petrol-engined vehicles show a corresponding decline.
This means that transport emissions are not reducing despite improvements in engine technology. Also, commercial vehicles, especially those that run on diesel, generally travel much further than their petrol equivalents (particularly in the first 10 years when an average diesel vehicle travels 30 percent further) (MoT, 2019).
The number of heavy trucks and buses, and the distance they travelled has increased every year since 2013. Heavy vehicles are expected to continue to make the largest contribution to carbon dioxide emissions on a per vehicle basis (MoT, 2019).
New Zealand has one of the highest per capita rates of carbon dioxide emissions from road transport in the 43 OECD countries with data for road transport emissions. This was 5th highest in 2018, coming behind Luxembourg, USA, Canada, and Australia. Our rate of 3.2 tonnes of carbon dioxide emitted per person per year from road transport was higher than Iceland (2.9 tonnes), Ireland (2.4 tonnes), Germany (1.9 tonnes), and the UK (1.7 tonnes), and was similar to Australia (3.4 tonnes) and Canada (4.1 tonnes) (UNFCCC, 2020; UNPD, 2020).
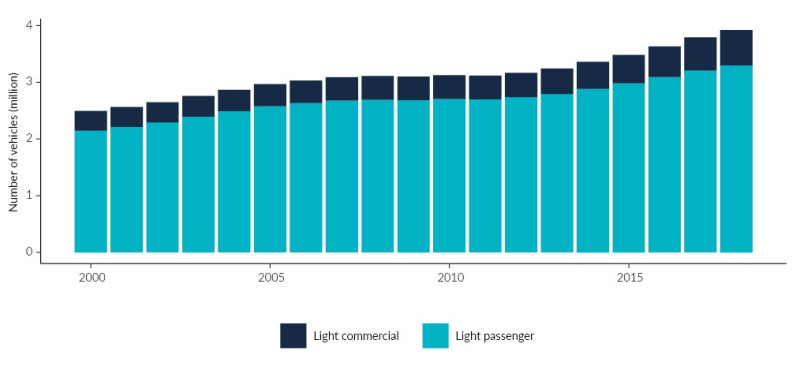
Image: Ministry of Transport, 2019 (Data source)

Image: Ministry of Transport, 2019 (Data source)
The manufacturing industries and construction sector was New Zealand’s next biggest source of gross carbon dioxide emissions after transport, at 18 percent of our total in 2018. The emissions were mainly from using fossil fuels to produce heat and energy. These emissions increased by 21 percent (about 1,100 kilotonnes) from 2009–18.
The food processing, beverage, and tobacco product subsector made up the largest portion of manufacturing missions, mainly because fossil fuels are still used in many industrial boilers. In 2018, the subsector produced 8 percent of New Zealand’s total gross carbon dioxide emissions.
Carbon dioxide can be removed from the atmosphere when plants grow and store carbon. In New Zealand, land use, land-use change, and forestry removed about 23,400 kilotonnes of greenhouse gases in 2018. This was 15 percent less than was removed in 2009, mainly because more plantation forests were harvested during this time. Note: the carbon dioxide removed and stored by plantation forests as they grow, or when new forests are planted on grassland, is included in this figure. Emissions produced during harvesting and planting are also included.
Consumption-based emissions are like a greenhouse gas footprint, and reflect the goods and services a country uses, as well as its lifestyle choices. Counting all the emissions along the way to the final use of a good or service, helps us understand the emissions that are embodied in our activities. For example, if a product is produced overseas and used in New Zealand, the greenhouse gases released during its production count as New Zealand’s emissions. Similarly, emissions from products produced here but exported count against another country’s greenhouse gas emissions and not ours. Looking at emissions this way helps show how trade between countries with different carbon intensities (the amount of carbon released to produce a unit of energy) can affect emissions.
In an example for consumption-based carbon dioxide emissions, an estimated 42,800 kilotonnes was emitted from goods and services consumed in New Zealand in 2015. Because New Zealand has a relatively small manufacturing sector and is reliant on imports for many products, this figure is almost 20 percent higher than the estimated 35,839 kilotonnes of production-based carbon dioxide emissions in 2015. Forty-four percent of the carbon dioxide emissions created by the goods and services we use happens overseas, making us a net importer of carbon dioxide (OECD, 2019).
Carbon dioxide emitted when goods were manufactured made up a large proportion of our consumption-based emissions – 30 percent in 2015. Emissions from services, including construction, created 29 percent of emissions. Carbon dioxide emissions from utilities made up 23 percent in 2015, but decreased by 30 percent from 2005 to 2015 (OECD, 2019) (see figure 6).
New Zealand’s 42,800 kilotonnes of consumption-based carbon dioxide emissions in 2015 equates to 9.3 tonnes of carbon dioxide per person, which is mid-range (18 out of 37) for OECD countries (OECD, 2020a, UNPD, 2020). The highest emitters were the USA and Australia with 18.1 tonnes and 17.9 tonnes per person, respectively. (For comparison, our per person estimates for production-based emissions were 7.8 tonnes of carbon dioxide in 2015 (UNPD, 2020)).
Estimating consumption-based emissions is challenging because it depends on the emissions intensity (the amount of energy required to produce a unit of gross domestic product, GDP) of overseas activities, and also on the methodology used – for example, how far back in the supply chain are indirect emissions included? Some data is also lacking, which prevents us seeing a full picture.
Consumption-based emissions were not available for methane, nitrous oxide, or other greenhouse gases when this report was prepared, although further analysis is underway. Together these gases made up more than half of the total production-based
greenhouse gas emissions in New Zealand in 2018. Most of the emissions of these gases are from producing agricultural products, which make up a large proportion of our export value. Because of this, it is likely that New Zealand would be a net exporter of greenhouse gas emissions in a consumption-based approach that includes all greenhouse gases.

Image: Organisation for Economic Co-operation and Development (Data source)
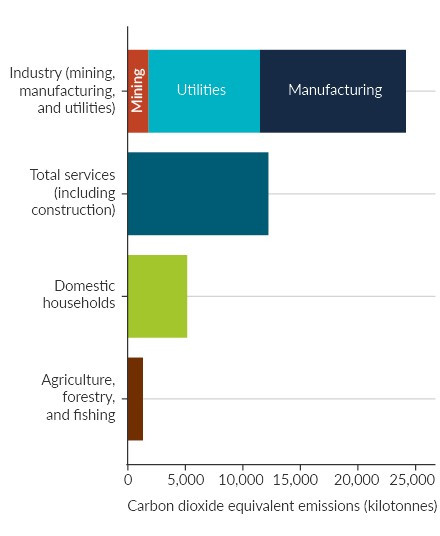
Image: Organisation for Economic Co-operation and Development (Data source)
Methane is a short-lived gas – it remains in the atmosphere for about 12 years, and with a global warming potential of 25, has a much greater warming effect than carbon dioxide (see Greenhouse gases are not all equal). Continued methane emissions top up the concentrations in the atmosphere, and make the climate warmer than it would be from carbon dioxide emissions alone. If methane emissions were reduced rapidly, the warming caused by past emissions (and their contribution to climate change) would decrease naturally within a few decades.
Methane emissions were at the same level in 2018 as they were 10 years prior in 2009 (see figure 7).
Agriculture is a major part of the New Zealand economy, and methane emissions from livestock make up a large proportion of our emissions profile. Methane made up 43 percent of our gross greenhouse emissions in 2018, with 86 percent from livestock. Methane from dairy cattle increased by 21 percent in the 10 years from 2009 to 2018, whereas emissions from sheep and beef cattle decreased by 11 percent (see figure 6). This reflects a shift from sheep and beef farming to dairy farming with higher stocking rates (see Our land 2018).
Waste contributed 11 percent to methane emissions in 2018 but decreased by 13 percent from 2009–18. This is mainly from solid waste disposal in landfills and wastewater treatment. Methane is also emitted as part of fossil fuel extraction and use. While these emissions are significant globally, they make up 2 percent of total methane emissions in New Zealand.
Like carbon dioxide, nitrous oxide is a long-lived gas, with a lifetime in the atmosphere of about 120 years. Nitrous oxide made up 10 percent of New Zealand’s emissions in 2018, having increased by 14 percent in the 10 years from 2009 to 2018. Ninety-three percent of all nitrous oxide emissions were from agricultural soils. These emissions mainly come from the urine and dung of grazing animals and synthetic nitrogen fertiliser, which is converted to nitrous oxide by soil microbes.
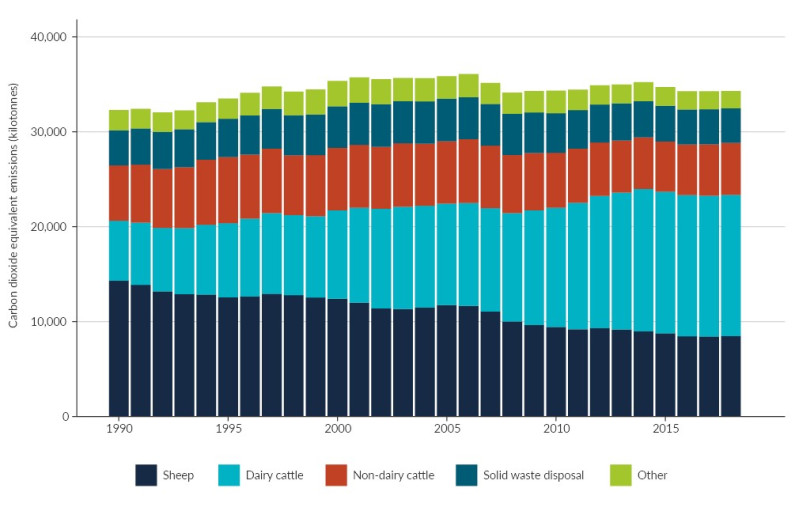
Image: Ministry for the Environment (Data source)
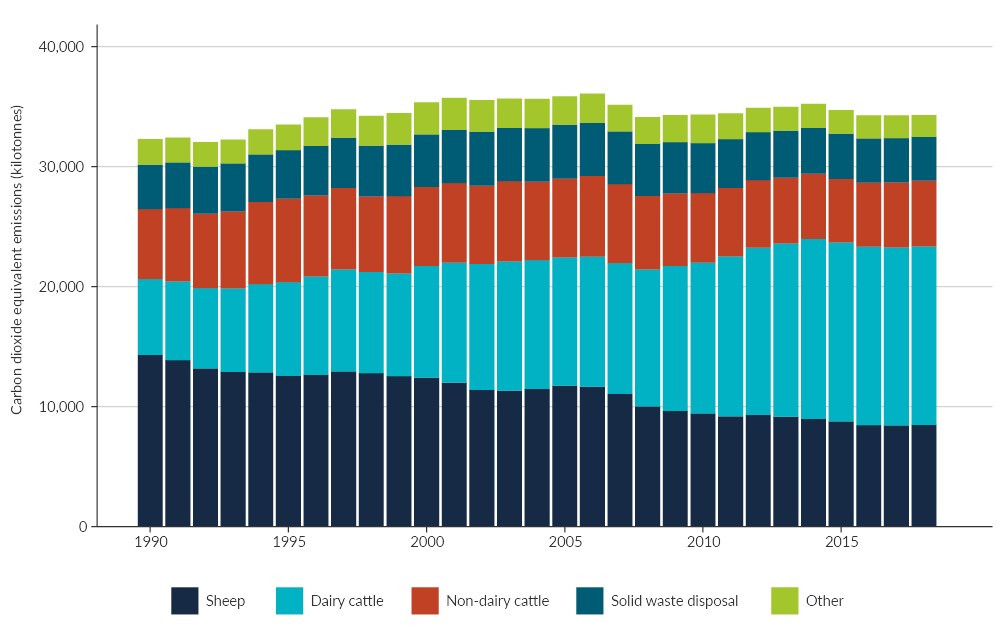
Image: Ministry for the Environment (Data source)
Besides greenhouse gases, emissions of aerosols (fine particles in the air) play a role in heating or cooling the planet. One aerosol is black carbon or soot, which strongly absorbs sunlight because of its dark colour. Unlike carbon dioxide, black carbon only stays in the atmosphere for about a week but the changes it causes to the climate happen rapidly. Black carbon typically has local rather than global effects.
In New Zealand, most black carbon comes from vehicle exhaust (especially from diesel engines), burning wood or coal for home heating, and outdoor burning. New Zealand does not have an inventory for black carbon emissions. However, monthly black carbon concentrations decreased (at the 95 percent confidence level) at three out of four monitoring sites in Auckland between 2006 and 2016, but are high compared to the levels in cities in Europe, the United Kingdom, and the United States (see Our air 2018).
Emissions of sulphur dioxide gas cool the climate by forming particles of sulphate that scatter incoming sunlight and create clouds.
Most of the sulphate in the atmosphere is from the global burning of fossil fuels (especially coal) but large volcanic eruptions can also add significant amounts that cause cooling for months or years. Burning coal in manufacturing and construction, and public electricity generation and heat production was the main source of sulphur dioxide emissions in New Zealand in 2015. Emissions from domestic shipping were also important (see Our air 2018).
Ozone-depleting substances (ODSs) are human-made chemicals that react with ozone in the stratosphere and destroy it. A build-up of these substances in the atmosphere led to the development of lower levels of ozone over Antarctica during the spring, known as the ozone hole. Lower average levels of ozone globally and ozone holes over the northern polar region were also observed occasionally (WMO, 2019).
Global concern about the damage these chemicals were causing led to the 1987 Montreal Protocol under the Vienna Convention, which agreed on phasing out the global production of ODSs. Since then, production has decreased by 98 percent (data for 1986–2015). (See indicator: Global production of ozone-depleting substances.) Since 2012 unreported emissions from eastern Asia have partially offset this (WMO, 2019).
The ozone hole does not have a large effect on ozone concentrations over New Zealand and therefore levels of UV. (See indicators: Ozone hole and UV intensity.) However, when the hole breaks up in late spring it can send plumes of ozone-depleted air from Antarctica over the country that briefly decrease the column ozone levels by about 5 percent. This is about the same amount as daily variation but adds to it (Ajtić et al., 2004).
New Zealand has naturally higher levels of UV radiation during summer than countries in the Northern Hemisphere at similar latitudes. This is partly because of a naturally thinner ozone layer over New Zealand at this time, lower background air pollution, and because Earth is closer to the sun during the Southern Hemisphere summer than it is during the Northern Hemisphere summer.
The ozone hole has started to shrink in response to the global phasing out of ODSs (WMO, 2019). Also, in 2019, the hole was the smallest since 1982, due to abnormally high temperatures in the stratosphere over Antarctica (NOAA, 2019). Current projections are that the Antarctic hole will gradually close and springtime ozone concentrations will return to mid-1980s levels in the 2060s (WMO, 2019).
In 2018, ozone over New Zealand reached its highest annual average thickness since 1994 at 315 Dobson units (DU). (See indicator: Atmospheric ozone.) Annual average ozone column thickness in 2018 and 2019 (309 DU) was also above the long-term average of 308 DU from 1979 to 2019. Average daily ozone column thickness varied by about 100 DU throughout the year, with the highest levels occurring in spring and the lowest in autumn.
Many ODSs are also powerful greenhouse gases (see Greenhouse gases are not all equal). Projections estimate that by 2100 phasing out of their use would reduce global warming by about 0.2 to 0.4 degrees Celsius (WMO, 2019).
Hydrofluorocarbons (HFCs) can be used instead of ODSs, particularly as refrigerants, but they are also powerful greenhouse gases. Emissions of HFCs used as substitutes for ODSs increased by 86 percent for 2009–18. HFCs made up 2 percent of New Zealand’s gross greenhouse gas emissions in 2018. Because they have a greenhouse warming potential of up to 14,800, these gases can contribute to climate warming during the short time (on average) they remain in the atmosphere.
If you are on a mobile device, you can view the graph better on the StatsNZ website.
High-level forces, also known as drivers, are behind the greenhouse gas emissions that are changing the climate and environment. Globally, these forces control how much and which greenhouse gases are accumulating in the atmosphere.
The forces reflect the many choices we have made and continue to make as individuals, communities, countries, and as a global population. Understanding the forces behind New Zealand’s emissions shows what is shaping our contribution to global emissions. Once we appreciate what is driving our emissions, we can better understand why emissions from different sources are changing and make choices to address their causes.
Four interacting elements can be used to understand the main factors that are driving the amount of carbon dioxide that is emitted from activities using energy (for power, heat, or transport):
At a global scale, this analysis demonstrates that increasing carbon dioxide emissions are driven by economic growth as more goods and services are produced and used both per person and in total (IPCC, 2014b). This growth, and how energy intensive it is, has a big influence on emissions. The trends can go in opposite directions, so the relative rates of change are important – for example, if economic activity per person increases faster than the energy intensity decreases, overall emissions will rise.
It takes energy to produce goods and services. Because globally most of this energy still comes from burning fossil fuels, there is a strong correlation between economic activity and carbon dioxide emissions. Countries with higher incomes per person also tend to have higher energy use per person because its citizens live more energy-intensive lifestyles (IPCC, 2014b).
The source of the increased GDP also matters. Growth from advances in technology (which tend to be less energy intensive) has less of an impact on greenhouse gas emissions than growth from using more resources or expanding existing energy intensive activities (IPCC, 2014b).
Population growth adds to the growth of global emissions. Each person who is added to the world’s population increases the demand for resources and energy. Where they live, however, makes a huge difference (up to 91-fold) in their typical emissions. In general the regions with the highest population growth have significantly lower emissions and lower wealth per capita than regions with low or no population growth (IPCC, 2014b).
Energy intensity has decreased globally in the past 40 years because of improvements in technology and efficiency. The change is driven by the decisions we make at an individual and economy wide level, to buy and use energy efficient products for example. The decrease, however, has not been fast enough to offset the growth in energy use from the world’s increasing population and increasing energy use per person. From 1970 to 2010, total global energy use increased by 130 percent, while global population increased by 87 percent. Energy use per person also increased by 30 percent (IPCC, 2014b).
Carbon intensity of the energy supply has decreased globally due to the move from fuels with a high carbon content like coal, to lower-carbon fuels like natural gas and near-zero carbon fuels such as nuclear, wind, and solar. As with energy intensity, this reduction has not been fast enough to offset the growth in energy use (IPCC, 2014b).
Emissions of other greenhouse gases such as methane and nitrous oxide are also growing, driven by similar trends. These include the worldwide increase in living standards and increased demand for goods and services, particularly from agriculture (IPCC, 2014b).
The growth of economic activity has driven New Zealand’s carbon dioxide emissions. Economic activity per person rose by 31 percent between 2000–18 and by 15 percent in the last decade from 2009–18 (see figure 8) (Stats NZ, 2020c). During this time, direct carbon dioxide emissions from households increased by 16 percent and by 13 percent from manufacturing (Stats NZ, 2020b).
Between 2007 and 2018, an average of 90 percent of direct household emissions came from transport (Stats NZ, 2020b). The light vehicle fleet includes passenger vehicles (primarily cars) and light commercial vehicles (vans, utes, SUVs, and trucks). Growth in the fleet has mirrored population growth – the fleet was the largest to date in 2018 (MoT, 2019).
The increase in carbon dioxide emissions from light vehicles for 2009–18 was largely driven by strong growth in the total distance travelled by these vehicles – the overall distance travelled increased by 20 percent in the last decade. The increased travel was not offset by increased fuel efficiency in the light vehicle fleet during this time as this effect was much smaller (MoT, 2019).
Population growth in New Zealand has also driven the increase of our greenhouse gas emissions (as it does globally), particularly by driving economic growth and increasing total household consumption.
Increased pressures on gross carbon dioxide emissions from growth in GDP per person and population were lessened by decreases in the energy intensity of our economy. The energy intensity of GDP decreased by 31 percent between 2000 and 2018, and decreased by 14 percent in the last decade (MBIE, 2019a; Stats NZ, 2020c). Despite the decreases (and the high percentage of electricity generated from renewable sources) our energy intensity remains high – it was 18 percent above the OECD average in 2017, and the sixth highest of 37 OECD countries (MBIE, 2019a).
A decrease in the carbon intensity of our energy supply also contributed to reducing growth in emissions. Between 2000 and 2018 the carbon intensity of our energy supply decreased by 4 percent, but the decrease was 9 percent from 2009–18 (MBIE, 2019a). This was mainly due to more geothermal electricity generation from about 2010 (MBIE, 2019b).
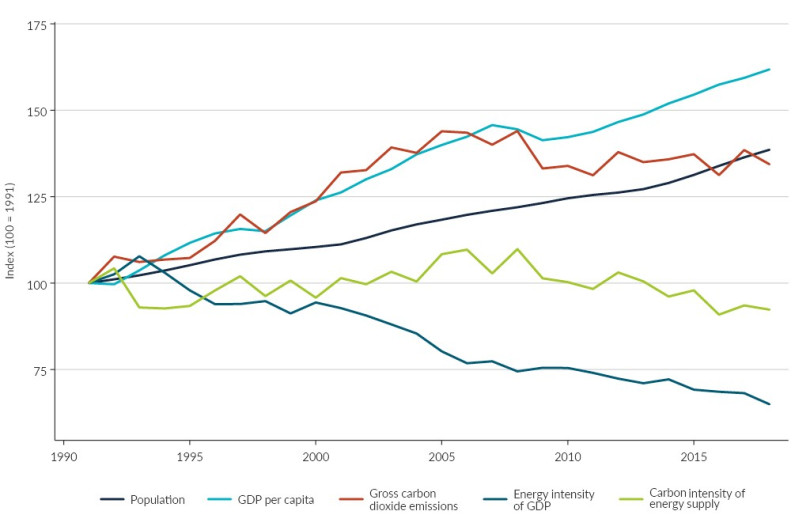
Image: Ministry of Business, Innovation and Employment; Ministry for the Environment; Stats NZ (Data source)
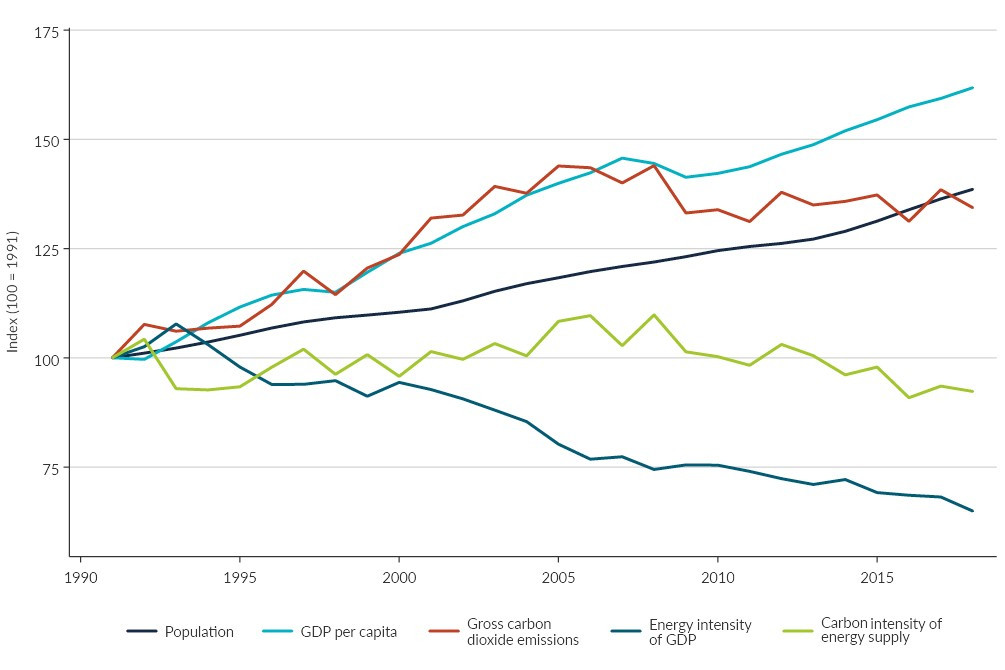
Image: Ministry of Business, Innovation and Employment; Ministry for the Environment; Stats NZ (Data source)
Methane emissions are driven by the economics of agriculture. The increased profitability of dairy farming (relative to sheep and beef) has resulted in conversions to dairy production, a larger national dairy herd, and increased methane emissions from dairy cattle. Increased livestock productivity (for the yield of milk and meat per animal) has also contributed, as higher productivity requires more feed per animal, which increases methane emissions (MfE, 2020d).
Higher emissions from a larger dairy herd and higher productivity have been offset by decreases in the number of beef cattle and sheep. Severe droughts, such as those in 2008, 2013, 2015, and 2016, can also drive down methane emissions as farmers are forced to reduce the number of livestock (MfE, 2020d).
Improving the capture of methane from landfills (managed waste disposal) has driven a decrease in emissions from this source, with a 25 percent reduction reported for 2009–18 (MfE, 2020d). This is despite more municipal waste being generated by our increasing population and rising GDP per person.
Nitrous oxide emissions were caused mainly by livestock dung and urine deposited onto pasture, but were also driven by the use of more synthetic nitrogen fertiliser – this increased by 673 percent from 1990 to 2018. More manure from more productive livestock also contributed to increased emissions (MfE, 2020d).
In an unprecedented move to eliminate a new coronavirus from New Zealand, the Government closed the borders and confined people to their homes for 29 days during the alert level 4 lockdown in March and April 2020. Essential work continued and supermarkets stayed open but schools, shops and workplaces closed. Many people lost their jobs and businesses, and those who could worked from home.
How did such a radical and sudden behaviour change affect greenhouse gas emissions?
During level 4, traffic volume in large urban areas dropped to an average of 19–25 percent of 2019 levels (NZTA, 2020). The distance heavy vehicles travelled decreased by up to 50–60 percent (compared to mid-March) but buses still ran to transport essential workers – sometimes with few or no passengers. Sea freight reduced, imports decreased by 21 percent, and exports decreased by 17 percent in April, compared to April 2019 (MoT, 2020). Domestic air travel restrictions and the closed border decreased air traffic volume by about 80 percent (ACL, 2020).
Large reductions in air pollutants were observed. In Auckland, nitrogen dioxide levels decreased by 34–57 percent and black carbon levels fell by 55–75 percent (Patel et al., 2020).
Globally, similar lockdowns cut carbon dioxide emissions to 2006 levels. At its peak during the lockdowns in early April, daily carbon dioxide emissions were estimated to have decreased by 17 percent from 2019 levels. Reductions in road and air traffic made the biggest contributions (Le Quéré et al., 2020).
By mid-year, it was estimated that annual global emissions for 2020 would be 4–7 percent lower than 2019 levels. Although this would be the largest annual decrease in greenhouse gases on record, global carbon dioxide emissions remain large, so even a decrease of this size would not be enough to significantly affect the accumulation of carbon dioxide in the atmosphere to limit warming to 1.5 degrees Celsius. For that to happen, this rate of decrease would need to continue year on year for the next decades (Le Quéré et al., 2020).
There is also a question of whether the reductions in emissions will be sustained. Previous economic crises have caused emissions to decrease in the short term but all rebounded except when the crises were driven by energy supply. For example, energy efficiency improved substantially and alternative energy sources were developed as a result of the oil crises of the 1970s and 1980s. The current decreases in emissions are unlikely to be lasting unless structural changes are made to the world’s economic, transport, or energy systems (Le Quéré et al., 2020).
Transport and economic activity in New Zealand increased as restrictions on movement were eased in April and May. For the most part, daily life resumed on 9 June when New Zealand moved to level 1 (except for the border remaining closed). Traffic volumes returned to about 2019 levels 1 month into level 1, measuring up to 94 percent in Auckland, 96 percent in Wellington, and 100 percent in Dunedin. In Christchurch and Hamilton, level 1 traffic volumes exceeded 2019 traffic volumes by 4–5 percent (NZTA, 2020).
The emission reductions that will last longest are likely to be in tourism. Tourist activity makes up about 7 percent of the greenhouse gas emissions we produce (on an environmental-economic accounting basis), most of which is from air and land-based travel (Stats NZ, 2020b). Reductions in international tourism, however, may be partially offset by more domestic tourism as New Zealanders are encouraged to travel in their own backyard and support the recovery of local economies.
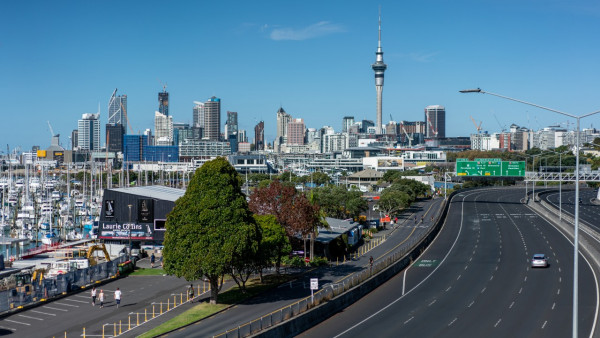
A lone car on the Auckland motorway during the early 2020 lockdown.
Photo: Stuart Mackay, NIWA

Chapter 2: Our activities are driving emissions
October 2020
© Ministry for the Environment