Chapter 5: Looking ahead: future emissions and climate

Temperature in New Zealand and globally is expected to continue to increase. Large reductions to emissions are needed to limit future warming.

Image: Mark Hannah Photography
Human activities have already caused the world’s average temperature to rise by about 1 degree Celsius above its pre-industrial level. At the current rate of increase, global average temperature is likely to be 1.5 degrees Celsius above the pre-industrial level in the next 10–30 years.
Globally, high rates of greenhouse gas emissions are expected to continue. Deep cuts to global net carbon dioxide emissions would be needed (45 percent below 2010 levels by 2030, and net zero by 2050) to hold warming to below 1.5 degrees Celsius.
In New Zealand, greenhouse gas emissions are projected to decrease in the coming decades, but not at a fast enough rate to meet our 2030 goals under the Paris Agreement.
As the climate warms, profound changes are expected in New Zealand. Temperature is projected to increase across the country particularly in summer and autumn. Extreme rainfall, drought, and wildfire risk are expected to increase in many places.
Continued sea-level rise will put large amounts of coastal infrastructure at risk. Our oceans will continue to warm and acidify.
How much more the climate changes in the future depends on how much more greenhouse gases the world adds to what is already in the atmosphere (IPCC, 2014a).
Globally, greenhouse gas emissions continue to rise. Before the COVID-19 pandemic, there was no sign of emissions peaking in the next few years. Worldwide, lockdowns in 2020 did reduce emissions, but because the reductions to date have not come from structural changes to our economic, transport, or energy systems, they are likely to be temporary (Le Quéré et al., 2020; UNEP, 2019) (see COVID-19 and greenhouse gas emissions in chapter 2).
There is a large and growing gap between projections of emissions (that continue to rise) and the level of emissions required to be tracking on the least-cost pathways to limit warming to 2 or 1.5 degrees Celsius above pre-industrial levels. To limit warming to 2 degrees Celsius, total global emissions must be about 25 percent lower than 2018 levels by 2030. To limit warming to 1.5 degrees Celsius, emissions must be about 55 percent lower by 2030 – this would require countries to increase the stringency of their Paris Agreement reduction goals fivefold (UNEP, 2019).
To limit warming to 1.5 degrees Celsius, net emissions of carbon dioxide globally must be at zero by 2050. Big reductions in other greenhouse gases would also be needed. If the global community settles for keeping warming to no more than 2 degrees, these reductions could be delayed by about two decades, but cannot be avoided (IPCC, 2018).
There are many different options for achieving these reductions and each country will develop its own mix. The scale of reductions needed will require profound changes to the way food, energy, and the goods and services we rely on are produced and supplied. According to the United Nations Environment Programme, transforming societies, economies, and governance institutions will require unprecedented efforts. The longer we delay in making the reductions, the deeper and faster they will have to be (UNEP, 2019).
Models of future greenhouse gas emissions in this country are used to report projected emissions under the United Nations Framework Convention on Climate Change.
These models indicate that ‘with existing measures and policies’, New Zealand’s net greenhouse gas emissions are projected to peak in the mid-2020s before decreasing (see figure 23). The projected decrease is due to replanting forests that were harvested in the early 2020s and establishing new forests (MfE, 2019). These plantings will not reduce emissions unless the wood is preserved in long-lasting products like house framing after harvest.
The latest modelling was published in 2019 before the COVID-19 pandemic response. It therefore does not reflect changes to the economy or COVID-19 response policies that may alter future emissions.
Gross greenhouse gas emissions are projected to remain steady through the early 2020s and decrease by 11 percent by 2035. Emissions in 2035 would be 10 percent above New Zealand’s gross emissions in 1990, but 10 percent less than with no measures to mitigate emissions (MfE, 2019).
Carbon dioxide emissions from transport are projected to be 14 percent lower in 2035 than levels estimated for 2020. Because vehicles are replaced slowly in this country, it will take longer here for the effects of improved fuel efficiency and more electric vehicles to affect our emissions than in other countries (MfE, 2019).
Gross emissions of methane are projected to be about 7 percent lower in 2035 than in 2020, and gross emissions of nitrous oxide are projected to be 7 percent lower (MfE, 2019).
To give the world a reasonable chance of limiting global warming to 1.5 degrees Celsius, the IPCC has calculated that net carbon dioxide emissions need to be brought to zero by 2050 globally. Agricultural methane emissions need to be reduced at the same time by about 24–47 percent relative to 2010 levels (IPCC, 2018). This global-scale information was used by New Zealand in 2019 to inform the domestic targets set in the Climate Change Response (Zero Carbon) Amendment Act.
New Zealand has committed to reduce its emissions by 30 percent relative to 2005 levels by 2030 under the Paris Agreement. This is our nationally determined contribution (NDC) – our country’s ambition or target for reducing emissions. To achieve this emission reduction goal, there is a limited amount (or budget) of greenhouse gases that New Zealand can emit into the atmosphere between 2021 and 2030. Projections are that under current policies, cumulative emissions, and removals of all greenhouse gases over this period will be 707 million tonnes, which is 18 percent higher than the emissions budget set through the NDC of about 601 million tonnes (MfE, 2020b). (The NDC specifies that this budget can be met by actions in New Zealand, but international carbon markets can be used additionally.)
More information about New Zealand’s greenhouse gas emission projections and progress towards the emissions targets is available from New Zealand’s Fourth Biennial Report under the United Nations Framework Convention on Climate Change.
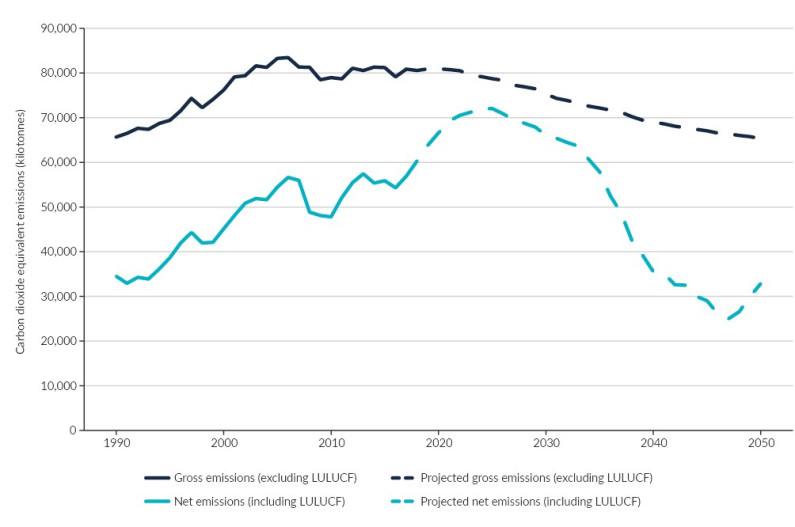
Image: New Zealand’s Fourth Biennial Report under the United Nations Framework Convention on Climate Change (Data source)

Image: New Zealand’s Fourth Biennial Report under the United Nations Framework Convention on Climate Change (Data source)
As well as a changing climate, we can expect to experience effects from the ways we address our emissions. The actions we take (or don’t take) will affect many parts of our lives – including the economic, social, and cultural systems we participate in every day. Some parts of our economy will incur losses during a transition to a low-emissions future even if it is fair and well-planned. New opportunities and positive changes will also occur, such as savings in energy costs, improved health, cleaner air, reduced traffic congestion, and benefits for biodiversity (MfE, 2018b).
The longer the world delays emission reductions, the steeper and faster the reductions must be to stay in the agreed temperature range. Delayed reductions also cause faster short-term climate change with greater impacts to people and the environment, including our native biodiversity. Delays give us less time to adapt to the changes. Later reductions may defer costs in the near-term but have potentially higher costs and risks, and less flexibility in how we make the rapid reductions when they can no longer be deferred (IPCC, 2018).
The disturbance of climate change is not like a recession where a recovery eventually returns the economy to the level it was at before. Adding long-lived greenhouse gases to the atmosphere is like turning a ratchet. Stopping these emissions today would stop the ratchet from turning further, but because the gases will stay in the atmosphere for centuries or more, the ratchet will not be unwound. Even with no more carbon dioxide emissions, we will not go back to an undisturbed climate or even the climate we grew up with.
Sophisticated computer models are tools that are used to explore what may happen to the climate in the future. They are based on the laws of physics and maths and equations that describe the dynamics of the climate system.
Future climate scenarios are called projections rather than predictions, as they are only indications of what we can expect, rather than specific forecasts. The scenarios are generally based on different concentrations of greenhouse gases in the atmosphere and calculate the warming and other environmental effects they are likely to cause. Projections usually include scenarios that assume a rapid reduction in emissions as well as scenarios that assume a continued rise in emissions for the rest of the century.
Information about Earth’s climate in the past is used to improve our understanding of the climate system and to test and improve climate models. The climate has changed naturally over millions of years, with ice ages and warm periods occurring. Records of these changes (including the concentration of carbon dioxide present in the atmosphere at the time) are laid down in sediments and ice and can be collected by researchers, including New Zealand teams studying the seafloor off Antarctica. This information gives us increased confidence in the outputs of the climate models.
Climate research has shown that the last time carbon dioxide levels were as high as they are now was about 3 million years ago and temperatures were 1.8–3.6 degrees Celsius warmer than in pre-industrial times (Burke et al., 2018). At this time trees grew in Antarctica and seas were at least 20 metres higher (Grant et al., 2019; Rees-Owen et al., 2018). This information cannot be used as a straightforward guide to the future, but it helps us better understand the impacts from changes that are similar to those happening now.
Short-lived gases with strong warming effects (such as methane) also contribute. Emissions of these gases make the climate warmer in the short term, and add to the total amount of warming the world experiences.
It is estimated that human activities have caused the world’s average temperature to rise by about 1 degree Celsius above its pre-industrial level. At the current rate of increase, the global average temperature is likely to reach 1.5 degrees Celsius above the pre-industrial average temperature between 2030 and 2052. A rise of 3.4 to 3.9 degrees Celsius is projected by the end of the century if current policies continue (IPCC, 2018; UNEP, 2019).
Even if all the current emissions reduction commitments and goals (conditional and unconditional) are met by the international community, the average global temperature is likely to be 3 degrees Celsius warmer than the pre-industrial temperature by the end of this century (IPCC, 2018).
This amount of warming is projected to increase the likelihood of severe, pervasive, and irreversible impacts for people and ecosystems (IPCC, 2014a). Heatwaves and extreme rainfall are projected to become more frequent and intense in many places. Average global sea level is expected to continue to rise and at a faster rate, for many centuries. Ninety-nine percent of tropical corals could be lost with warming of 2 degrees Celsius (IPCC, 2018).
It is virtually certain that the extent of permafrost will decrease. Previously frozen areas may then start emitting carbon dioxide and methane, which would contribute to more climate change. (This is known as a positive feedback loop.) Irreversible changes such as species extinctions and melting of the Greenland ice sheet are also expected (IPCC, 2014a).
Recent research has found that most communities around the world can expect to soon experience climates that are more similar to a different city than their own current climate. For example, in 2050 the climate of Auckland is projected to be more similar to that of Sydney in 2020 than it is to its climate today (Bastin et al., 2019). By 2060 (about the time when a 25-year-old today will be retiring) most of the world’s population can expect an average climate that is unfamiliar to them now. What is expected to be a normal climate in 2060 is so extreme that it would occur only once every 44 years on average today (Frame, Joshi, Hawkins, Harrington, & De Roiste, 2017).
More information about global climate change, risks, and impacts is available from the Intergovernmental Panel on Climate Change (IPCC).
The continued accumulation of greenhouse gases in the atmosphere is projected to have increasing effects on New Zealand’s climate.
Higher temperatures are expected across the country. Warm days (where the maximum temperature is 25 degrees Celsius or higher) are projected to occur four times as often in Auckland in 2090 if global emissions continue to increase throughout the 21st century (see figure 24). These days would still increase by 55 percent if emissions are reduced in line with limiting warming to below 2 degrees globally (MfE, 2018a).
Changes to rainfall are also expected – in general, wet areas are expected to get wetter, and dry areas drier (see figure 25). We can also expect more stress on water resources from both of these situations.
Extreme rainfall events are projected to become more common in many areas. What was once a rare, extreme event for us may become common for our children and grandchildren. In the Wellington region for example, projections for future climate point to more intense extreme, rare rainfall events. These events will have broad impacts including slips, landslides, reduced stream habitat quality, and effects on urban drainage and transport systems (Pearce et al., 2019).
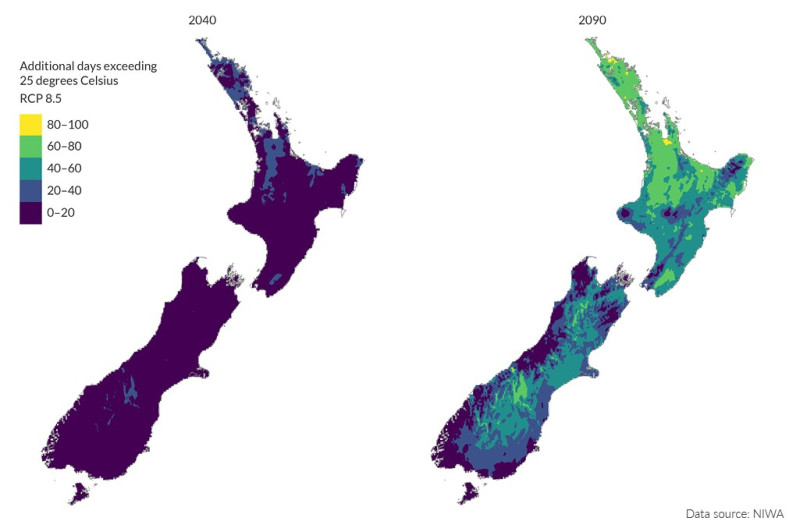
Image: NIWA (Data source)
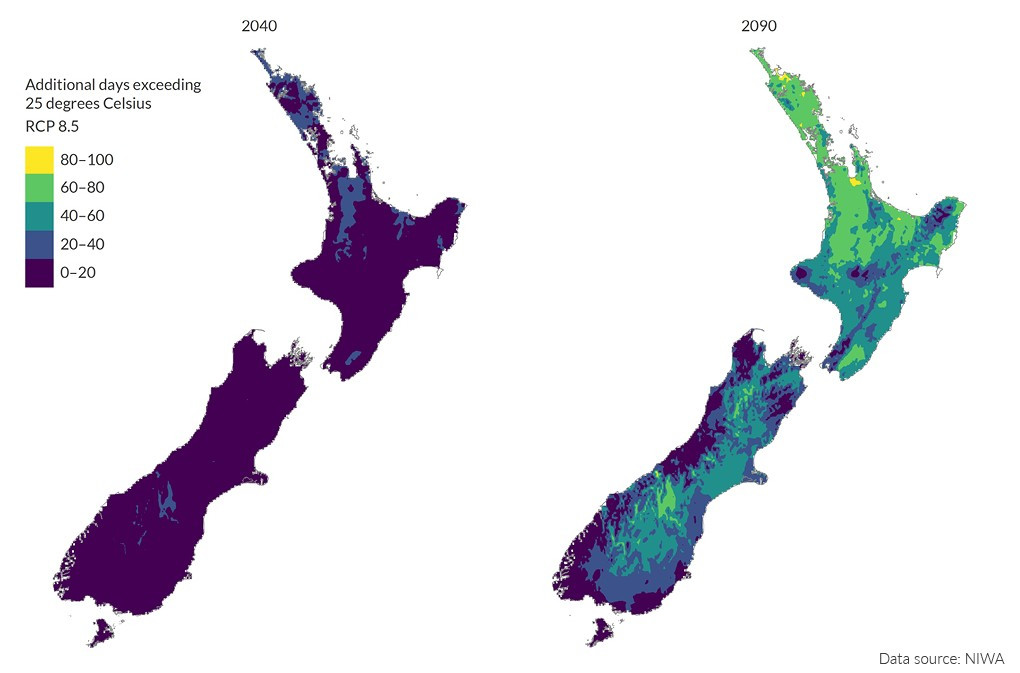
Image: NIWA (Data source)

Image: NIWA (Data source)
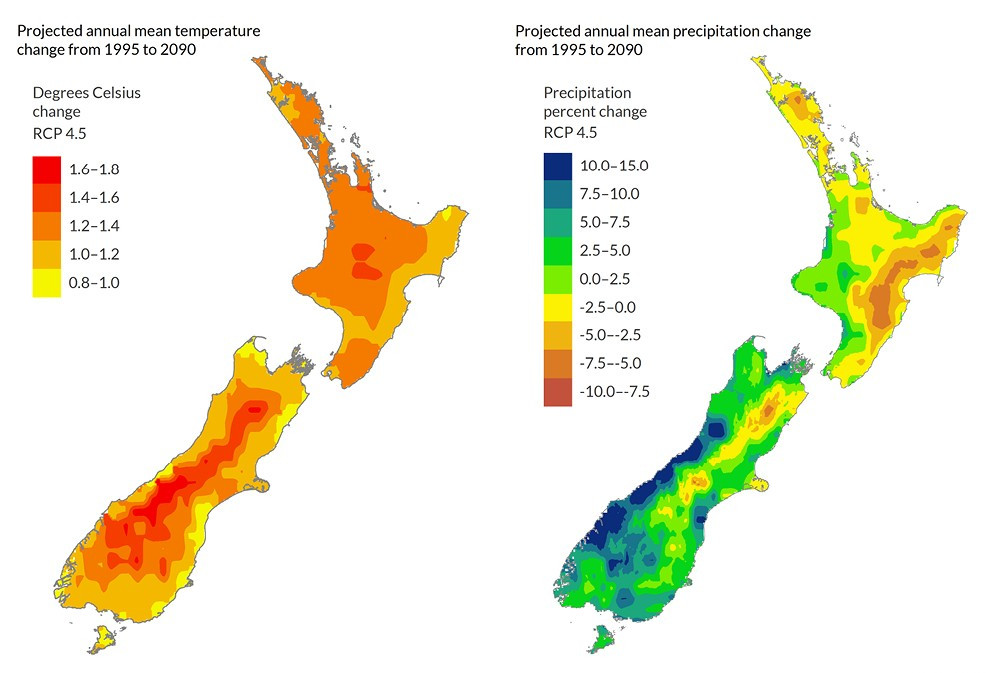
Image: NIWA (Data source)
Droughts are projected to increase in severity and frequency in many areas due to a combination of rising temperatures and changes to rainfall. This will be most pronounced in areas that are already drier, like many eastern areas (MfE, 2018a). Longer periods of drought could affect native forests by causing trees to die, shifting the makeup of a plant community towards more drought tolerant species, and increasing the risk of wildfires.
Sea levels in New Zealand are projected to be 0.5 metres higher than the baseline level for 1986–2005 between 2060 and 2110, and will continue to rise for several centuries (MfE, 2017). The timeframe for this rise depends on future emissions, as well as how quickly polar ice sheets respond to rising temperatures.
The implications for coastal areas are serious but people are still attracted to living near the sea. In many cities throughout the world, population increase and building continues in some zones that are at risk from sea-level rise. In the Auckland region from 2010 to 2013 for example, some construction occurred in low lying areas that may eventually be affected by sea-level rise. The population was also estimated to have increased in these coastal areas between 2001 and 2013 (Golubiewski, Balderston, Hu, & Boyle, 2019).
Observed changes to wildfire risk have been mixed (see The risk of wildfires is changing), but days with very high or extreme fire danger are projected to increase by an average of 70 percent by 2040, due to hotter, drier and windier conditions. The largest increases are projected for Wellington and coastal Otago, where fires do not generally occur. A doubling (to around 30 days for Wellington) or even tripling (to around 20 days for coastal Otago) of the number of days per year with very high or extreme fire danger is possible (Watt et al., 2019).
More information can be found in the Climate change projections for New Zealand report produced by NIWA.
The effects of climate change will be felt most acutely when they overlap and build on each other. These are known as cumulative effects. Some examples include a heatwave and drought happening at the same time or a storm surge adding to raised sea levels and making coastal flooding worse.
Cumulative effects can also occur when climate change adds to other changes to the environment. For example, excess nutrients in rivers and lakes can cause algae blooms, but these blooms become more likely when water is warmer. In 2019, flooding on the Fox River on the west coast of the South Island washed through a disused landfill, exposing decades of rubbish and washing it downstream (see Floods release decades-old rubbish from a landfill).
The increasing frequency of climate-related extreme events makes them more likely to co-occur and cause cumulative effects. This increased risk will be a challenge to our resilience and ability to recover, especially as we are only beginning to understand how and where the events are likely to occur.
Climate change can also have cascading effects, where one climate impact can affect many aspects of our society. Heavy rain and floods for example, can affect wastewater services, road networks, and power and water supplies. These effects all have links to the safety of individuals as well as the quality of life and economic activity of an area. This may cause people to leave the area, particularly if the impacts become more common and access to insurance decreases. The effects then cascade to put greater pressure on councils – with fewer residents left to pay rates, services for those who remain can be reduced (Lawrence et al., 2018).
Impacts from droughts can also ripple through regions and affect the environment, the health of a community, and the economy. Areas that rely on rainwater for drinking and other uses like pasture growth can be especially hard hit.
Climate change will not affect New Zealand in isolation. Life in this country is not separate from the activities and the effects of climate change that are projected to occur around the world. International connections that could be affected include the Pacific Island nations that we have strong relationships with, as well as trading partners, trade routes, international aid assistance, and migration. Our wellbeing can also be threatened by overseas events that have cascading impacts to our economy and security including climate-driven conflicts, water scarcity, and food insecurity.
Overall, a warming climate is projected to create uncertainty and increase risk. The Ministry for the Environment has commissioned the first national assessment of the risks that climate change poses to New Zealand, to meet the requirements in the Zero Carbon Amendment to the Climate Change Response Act (CCRA). See First national climate change risk assessment for Aotearoa New Zealand webpage on the Ministry for the Environment website for more information about the specific risks and changes expected from climate change.
Future national climate change risk assessments will be carried out regularly by the Climate Change Commission. As required by the CCRA, the Government must deliver a national adaptation plan within 2 years from the publication of the national climate change risk assessment.

Chapter 5: Looking ahead: future emissions and climate
October 2020
© Ministry for the Environment