New Zealand's Greenhouse Gas Inventory 1990–2022: Snapshot
This snapshot summarises the latest greenhouse gas inventory, which covers data from the years 1990 to 2022.
For the full inventory report, see New Zealand's Greenhouse Gas Inventory 1990–2022

Preparing and compiling New Zealand’s Greenhouse Gas Inventory (the inventory) is a cross-government effort, led by the Ministry for the Environment. It is a reporting requirement under the United Nations Framework Convention on Climate Change (UNFCCC) and the Paris Agreement. The inventory adheres to the Paris Agreement reporting guidelines and the international methodology guidelines set out by the Intergovernmental Panel on Climate Change.
The guidelines also govern when the inventory is submitted and require that it covers all years from the base year (1990) to two years before it is due (ie, the inventory due in April 2024 covers emissions and removals for all years from 1 January 1990 to 31 December 2022). Therefore, the inventory report is published about 15 months after the end of the calendar year being reported on.
The inventory informs Aotearoa New Zealand’s action on climate change. Accurate emissions data are essential to understand current emissions and past trends, generate policy recommendations on climate change, and develop and monitor emissions reduction targets. Inventory data are used for both international and domestic reporting.
To learn more about how Aotearoa measures progress towards targets and other emissions reporting, see the Ministry for the Environment’s webpage on emissions reduction targets (opens in new window).
The whole inventory time series, from the base year (1990) to the latest year, is recalculated when the methodology or underlying data change. This means the emissions estimates are only up to date in the latest inventory, and previous inventories are not useful for comparisons. Changes made to the inventory are often related to improvements in activity data collection, emission factors and methodology, or the identification of additional emission sources. For more information on the changes between the 2023 and 2024 inventory, see Why do the 2024 greenhouse gas inventory estimates look different from previous inventories?
The Ministry for the Environment has published information on the methodological improvements (opens in new window) introduced into the 1990–2022 inventory and their estimated impact on emissions.
Aotearoa extended its ratification of the UNFCCC and Paris Agreement on 13 November 2017 to include Tokelau, an overseas dependent territory of Aotearoa. Emissions from Tokelau have been included since Aotearoa New Zealand's 2019 inventory submission and are included in Aotearoa New Zealand's gross emissions. Emissions from Tokelau are estimated for Energy, Industrial Processes and Product Use, Agriculture and Waste and reported separately as the Tokelau sector. Only gross emissions from Tokelau are reported, therefore, gross and net emissions for Tokelau are the same.
In New Zealand’s Greenhouse Gas Inventory, emissions and removals are categorised into five sectors:
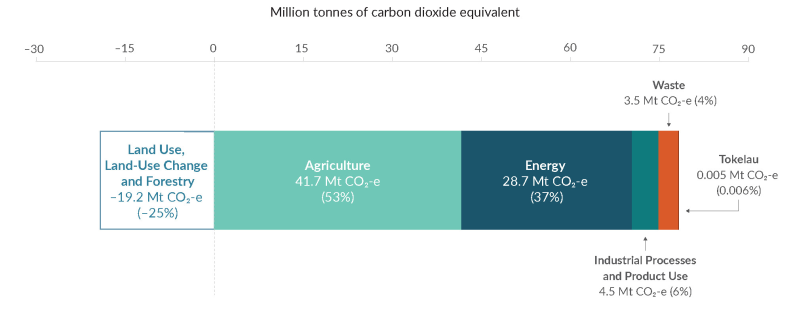
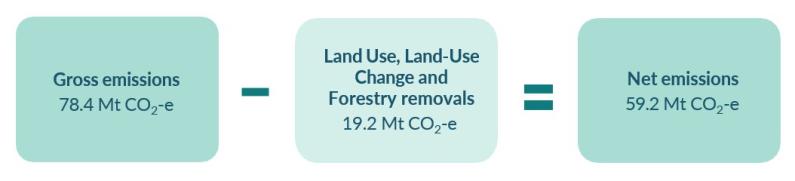
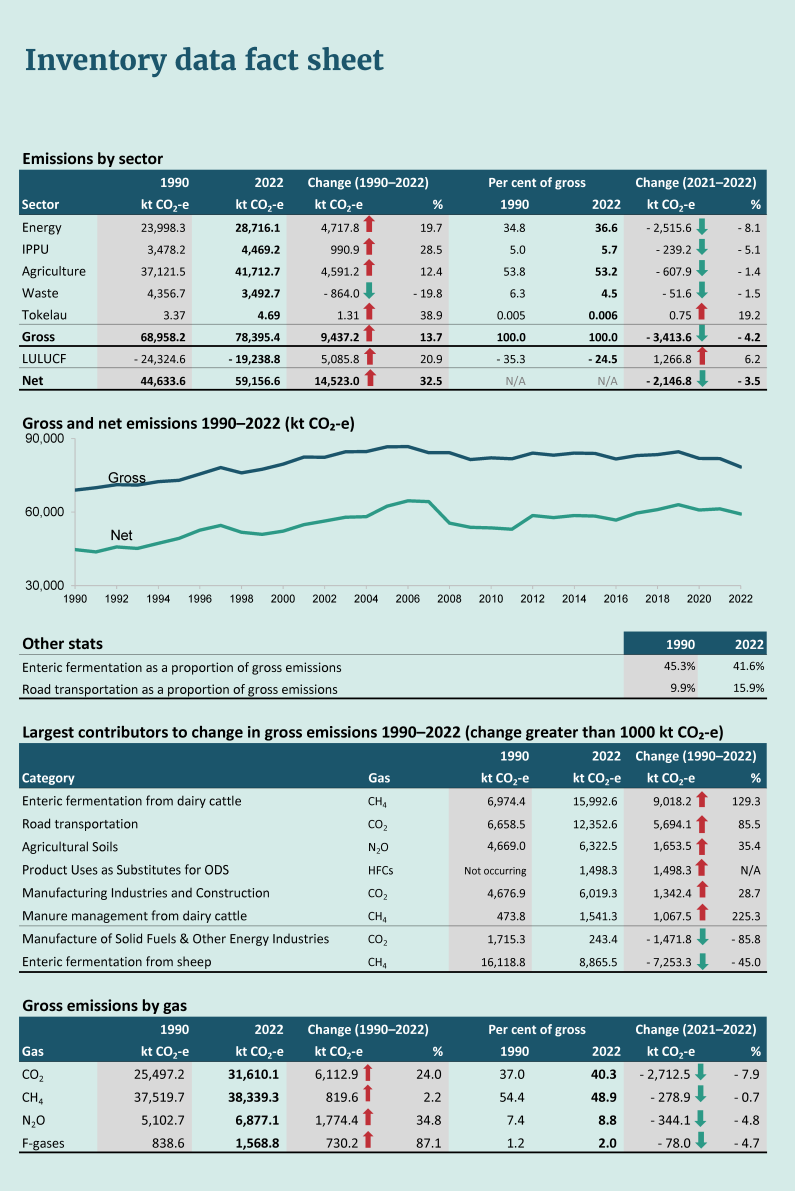
Gross emissions are total emissions from the Agriculture, Energy, IPPU and Waste sectors, as well as emissions from Tokelau (see About the inventory). Net emissions are gross emissions combined with emissions and removals from the LULUCF sector.
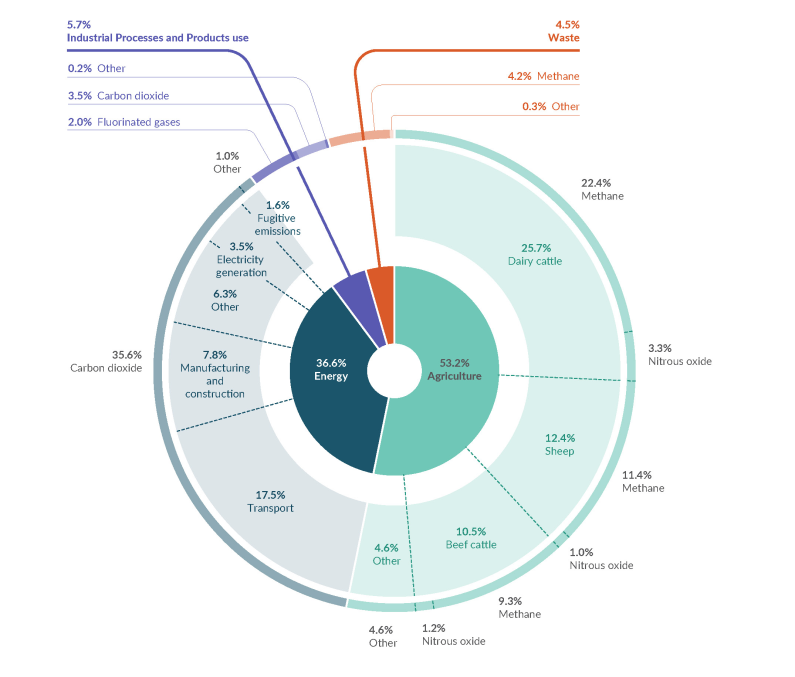
Aotearoa New Zealand’s greenhouse gas (GHG) emissions and removals in 2022 from each sector are shown in figure 1. The two biggest contributing sectors in 2022 were Agriculture (53 per cent) and Energy (37 per cent). The LULUCF sector offset 25 per cent of gross emissions in 2022.
Together, methane and nitrous oxide, largely from agricultural sources, made up over half of Aotearoa New Zealand’s gross emissions (49 and 9 per cent, respectively). The remaining emissions consisted mostly of carbon dioxide (40 per cent), largely from the Energy and IPPU sectors.
In 2022, Aotearoa New Zealand’s gross emissions were 78.4 million tonnes of carbon dioxide equivalent (Mt CO2-e). This is a 14 per cent increase from emissions in 1990 (the base year for United Nations Framework Convention on Climate Change (UNFCCC) reporting).
The five emission sources that contributed most to the increase since 1990 were:
The Waste sector had the only overall reduction in gross emissions, compared to 1990 levels. Emissions from waste were 20 per cent below 1990 levels in 2022, due to improvements in the management of solid waste at landfills.
Between 1990 and 2022, emissions from all gases have increased: carbon dioxide (24 per cent), methane (2 per cent), nitrous oxide (35 per cent) and combined fluorinated gases (87 per cent). For carbon dioxide, the greatest increase was seen between 1990 and 2008; this was followed by a period of relative stability and, from 2019, emissions of carbon dioxide have been largely tracking downwards. For methane, emissions increased between 1990 and 2006, after which they have been declining slightly.
Aotearoa New Zealand’s gross emissions peaked in 2006, and were relatively stable through to 2019. However, since 2019, emissions have been declining year on year (figure 3).
The declines observed between 2019 and 2020 were largely attributed to impacts from the COVID-19 pandemic across most sectors, especially Energy. In 2021, the COVID-19 pandemic continued to have an impact on the Energy sector, however, the decrease in gross emissions was largely driven by decreases in emissions from Agriculture. Decreases continued in 2022, however, these were not driven by the COVID-19 pandemic.
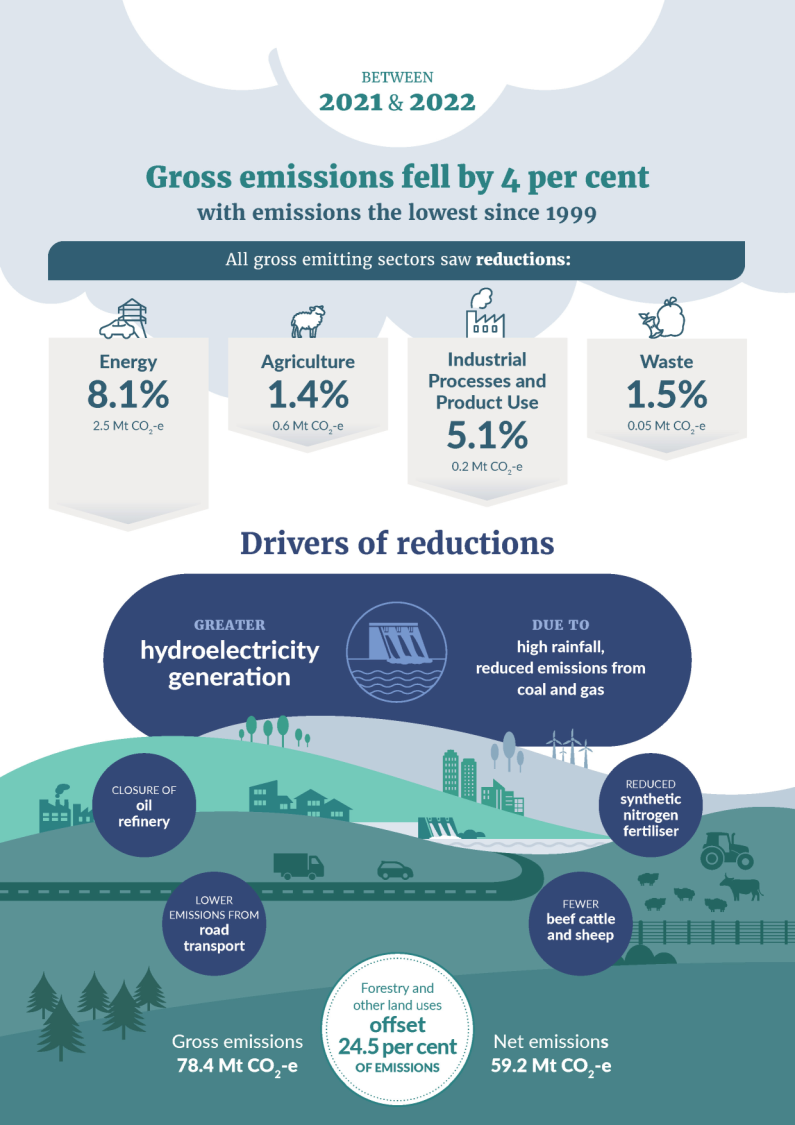
Between 2021 and 2022, Aotearoa New Zealand’s gross emissions decreased by 4 per cent, a decrease of 3.4 Mt CO2-e. For gross emissions, this is the greatest annual decrease seen over the period from 1990 to 2022. Gross emissions in 2022 have now reached their lowest level since 1999 (see Inventory data factsheet).
This decrease is due to a range of factors, with all gross emissions sectors except Tokelau having emissions reductions between 2021 and 2022 (see Emissions trends by sector).
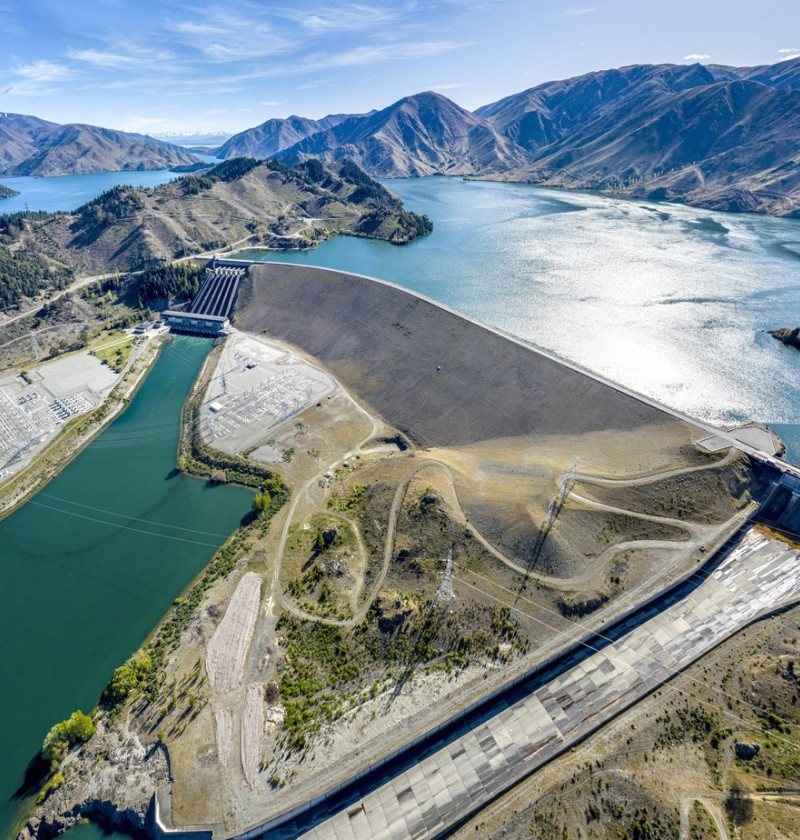
The largest reduction was from electricity and heat production due to increased renewable electricity generation. Aotearoa New Zealand’s levels of renewable electricity generation are highly dependent on where and when there is rainfall. 2022 was a high-rainfall year, resulting in increased hydroelectricity generation that displaced coal- and gas-fired power generation. As gross emissions in 2022 were influenced by this annual variation in rainfall, the high level of emissions reductions seen in 2022 does not ensure a permanent reduction in emissions.
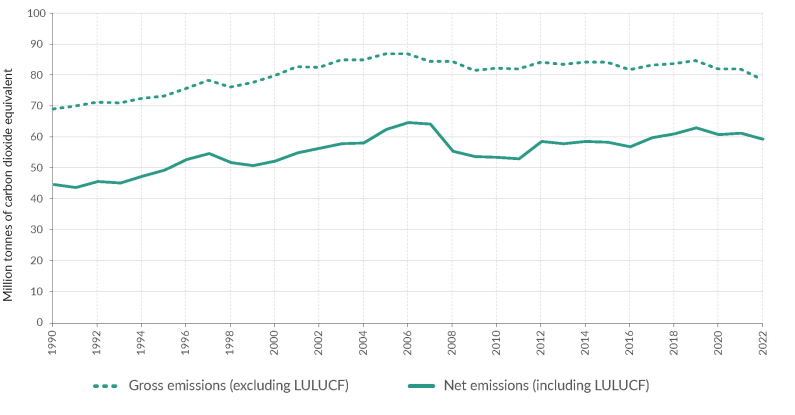
Net emissions include gross emissions combined with the emissions and removals from the LULUCF sector. Forests remove carbon dioxide from the atmosphere as they grow, but can also release it, for example, after being harvested, deforested or following natural disturbances such as storm damage. This means that historical planting rates and harvesting cycles have a large impact on the net amount of carbon dioxide removed by forests in any given year. Despite this, since 1990, the LULUCF sector has remained a net carbon sink.
Aotearoa is currently experiencing historically high rates of afforestation. Over 86,000 hectares of new forests were established in 2022, the highest rate since 1994. Approximately 4,200 hectares were deforested in 2022, the lowest rate reported since 2002.
Aotearoa New Zealand’s net emissions were 59.2 Mt CO2-e in 2022. This was calculated by subtracting the 19.2 Mt CO2-e of net removals that occurred in the LULUCF sector, from gross emissions of 78.4 Mt CO2-e. Net emissions have increased by 33 per cent compared with 1990 levels.
Net emissions from the LULUCF sector offset 25 per cent of Aotearoa New Zealand’s gross emissions in 2022 (figure 3). This is a decrease from 1990 when the LULUCF sector offset 35 per cent of Aotearoa New Zealand’s gross emissions (figure 3). This change is mainly the result of an increase in gross emissions between 1990 and 2022, and the impact of harvesting cycles on net emissions.
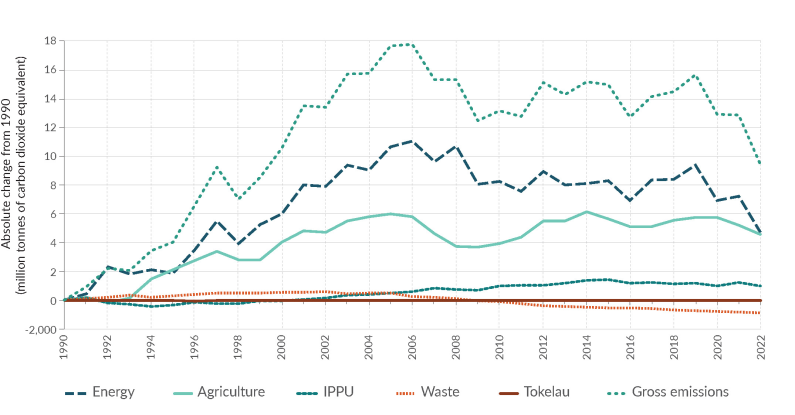
Aotearoa New Zealand’s emissions by sector reflect the composition of the national economy. The Agriculture, Energy and LULUCF sectors dominate Aotearoa New Zealand’s emissions profile (figure 4).
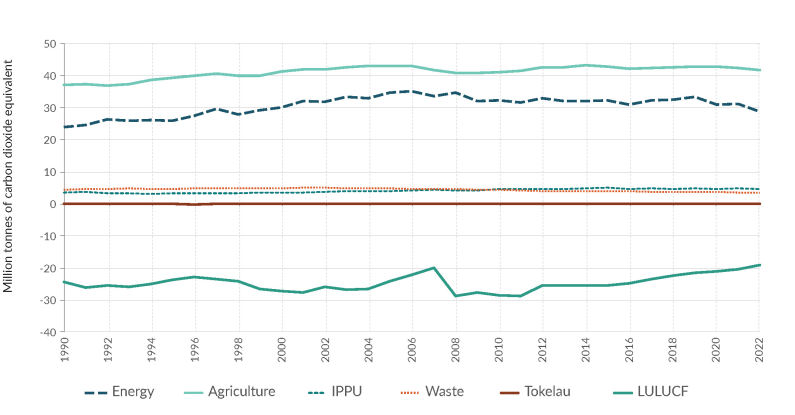
Figure 5 shows that the absolute changes in gross emissions were mostly influenced by changes in the Energy and Agriculture sectors. This is to be expected, because they are the largest sectors of Aotearoa New Zealand’s economy and show higher sensitivity to changes in global economic conditions, extreme weather conditions, and natural disasters.
While the Agriculture sector is Aotearoa New Zealand’s largest source of emissions (figure 4), it is the Energy sector (and road transport in particular) that has increased at a faster rate (figure 5).
Between 1990 and 2022, emissions from the Agriculture sector increased by 12 per cent (figures 4 and 5). This was primarily due to a 78 per cent increase in the national dairy herd since 1990 and a 465 per cent increase in the application of synthetic nitrogen fertiliser since 1990.
These increases have been partially offset by decreases in the populations of sheep (56 per cent), beef cattle (15 per cent), and deer (19 per cent) since 1990. Agriculture emissions most recently peaked in 2014, corresponding with a peak in overall cattle numbers. Emissions have decreased since 2014, driven by improved productivity of livestock, combined with reduced livestock populations. Market forces, such as the price of fertiliser and afforestation incentives under the New Zealand Emissions Trading Scheme (NZ ETS), have also played a role.
Between 2021 and 2022, emissions from the Agriculture sector decreased by 1.4 per cent. This followed a 1.3 per cent decrease between 2020 and 2021. The decreases across the Agriculture sector are mainly due to long-term decreases in beef cattle and sheep populations, and decreased synthetic fertiliser use.
Emissions from the Energy sector in 2022 were 20 per cent higher than in 1990 (figures 4 and 5). Most of this increase came from road transport (an increase in emissions of 82 per cent), and the use of fossil fuels for food processing, beverages and tobacco (an increase of 61 per cent). The increases in transport are driven by Aotearoa New Zealand’s increased population and economic activity.
The trend across the Energy sector shows emissions increasing until 2006, before decreasing slightly and remaining steady to 2019 (figures 4 and 5). Since 2019, there has been a decrease in emissions due to the impact of the COVID-19 pandemic and due to high levels of hydro-power generation in 2022.
Between 2021 and 2022, emissions from the Energy sector decreased by 8 per cent due to:
The decrease was partially offset by an increase in emissions from domestic aviation of 24 per cent. Domestic travel in 2022 returned to the level seen in 2019, following reduced activity in 2020 and 2021 due to COVID-19 pandemic-related travel restrictions.
Emissions from the IPPU sector in 2022 were 28 per cent higher than in 1990 (figures 4 and 5). The increase was driven by phasing out ozone-depleting substances under the Montreal Protocol and replacing them with fluorinated gases in refrigeration and air conditioning, and the increased use of household and commercial air conditioning in Aotearoa. In addition, carbon dioxide emissions have also increased – due largely to increased emissions of steel production and production of aluminium – although at a slower rate. Between 2020 and 2022, the increase was offset by reduced emissions due to COVID-19 pandemic restrictions and the gradual shutdown of the Marsden Point Oil Refinery.
Between 2021 and 2022, emissions from IPPU decreased by 5 per cent. This change is mainly the result of decreased steel production, decreased emissions from refrigeration and air conditioning, and further decreased emissions due to ceasing hydrogen production from the Marsden Point Oil Refinery, which was shut in March 2022.
Emissions from the Waste sector in 2022 were 20 per cent lower than in 1990 (figures 4 and 5). Growth in population and economic activity has resulted in increasing volumes of waste since 1990. Despite this, emissions have declined due to improvements in the management of solid waste at landfills, particularly in landfill-gas recovery. Drivers for these improvements include the National Environmental Standards for Air Quality, introduced in 2004, and the NZ ETS which has included large municipal landfills since 2013. Annual emissions increased between 1990 and 2002, before stabilising, then declining steadily since 2005.
Between 2021 and 2022, emissions from the Waste sector decreased by 1.5 per cent. This decrease was largely the result of a decrease in methane emissions from landfill. This is due to improvements and increases in landfill-gas capture, and a reduction in the proportion of garden, food and paper waste disposed to landfill.
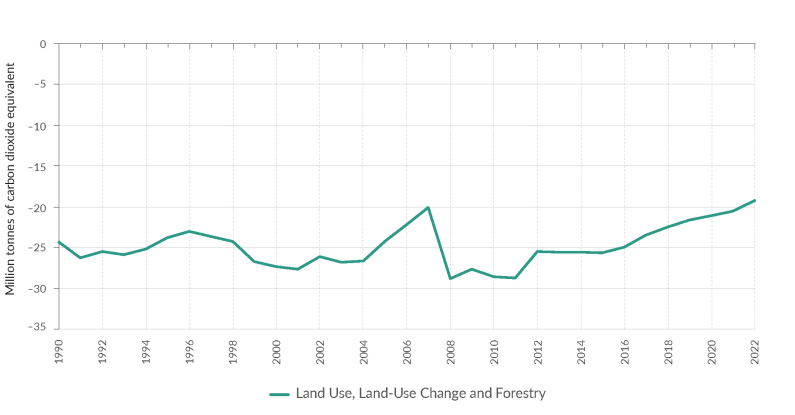
Between 1990 and 2022, net removals from the LULUCF sector decreased by 21 per cent (figures 4 and 6). This decrease is largely due to a reduction in removals from forest growth. This is driven by comparatively high forest-harvest rates currently occurring in Aotearoa New Zealand’s planted forests. Products created from harvested timber, however, keeps the carbon ‘locked up’ in the products and delays the emission of carbon dioxide. Given the high rate of harvesting in recent years, the amount of carbon ‘locked up’ in wood products has also increased.
The long-term trends in LULUCF emissions are driven by harvest and replanting cycles, due to the uneven age-class profile of Aotearoa New Zealand’s planted forest. Over the past decade, net removals from LULUCF have generally been decreasing (figure 6). This is a result of near-historic high levels of harvest rates, due to significant planting in the 1980s and early 1990s. These production forests have progressively been reaching maturity and will continue to throughout the 2020s. As high harvesting rates continue, and harvested forests are replanted, the average age of the planted-forest estate reduces each year. Young stands have low growth rates compared with older, faster growing stands. In the future, as the harvest rate declines and younger stands reach faster growth rates, net removals are likely to increase.
Between 2021 and 2022, net removals from the LULUCF sector decreased by 6 per cent, driven by an increase in net emissions from harvested wood products1. This was due to a small reduction in harvest volumes between 2021 and 2022, which meant that emissions from existing harvested wood products were not offset to the same extent as 2021. Emissions from high levels of afforestation2 in 2022 meant that the reduction in net emissions in planted forests (fdue to the reduction in harvest volumes) was insufficient to offset the increase in net emissions from harvested wood products.
1 Net emissions in the Harvested wood products category are driven by the harvesting of planted forests to produce roundwood, resulting in changes to the carbon stock of this pool. The Harvested wood products pool gains carbon as new harvested wood products are created. Losses from the Harvested wood products pool occur due to products being discarded. To account for these losses through time, a decay profile, or half-life, is applied for each product type. When inputs into the Harvested wood products pool are higher than losses, it acts as a carbon sink; when losses are higher than inputs, it acts as a carbon source.
2 In most cases, afforestation causes an increase in net emissions in the year of planting due to losses in soil carbon and biomass from the land-use change. These forests then become carbon sinks in subsequent years as tree growth rates increase
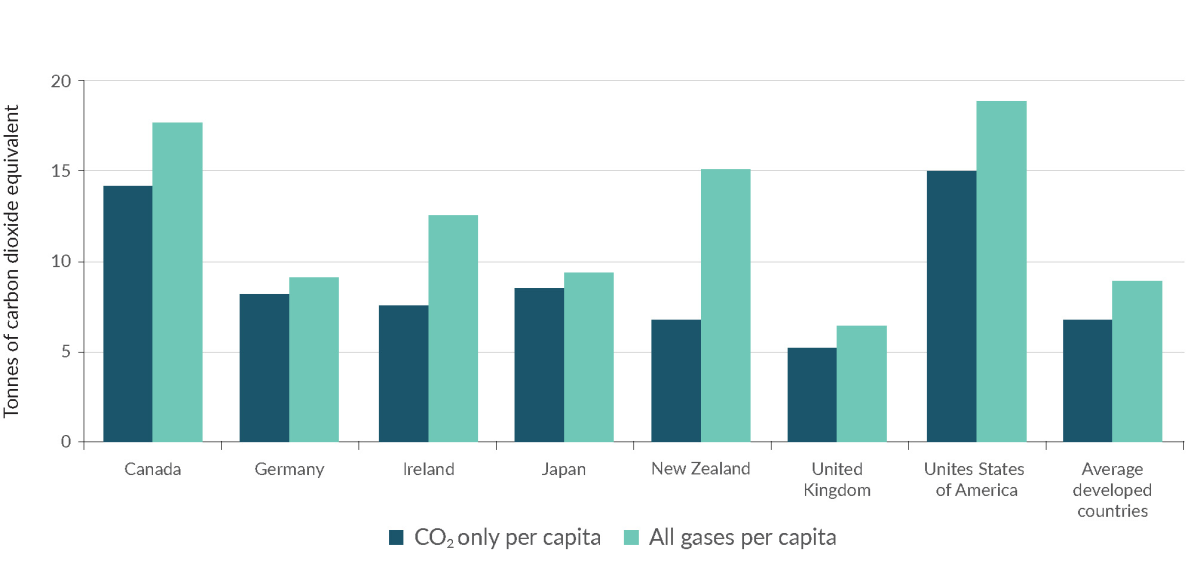
Aotearoa New Zealand’s emissions profile is different compared with most other developed countries. This is because Aotearoa has a relatively:
Aotearoa is the only developed country where carbon dioxide emissions make up less than half of the proportion of greenhouse gases on a CO2-e basis. Ireland is the next smallest at 60.5 per cent.
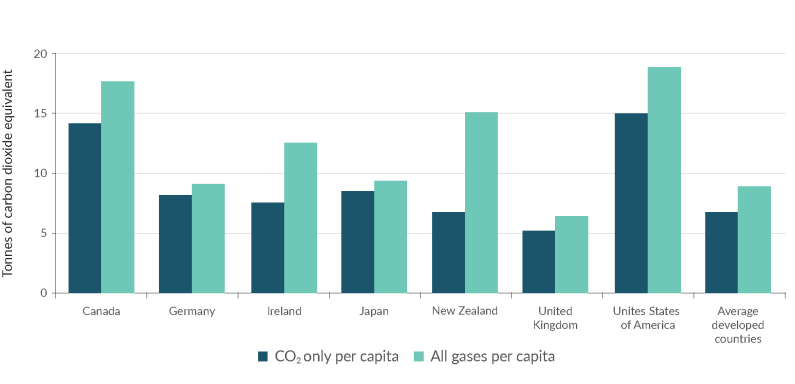
Based on the data for 2021 from last year’s inventories for developed countries, Aotearoa New Zealand’s gross emissions for all gases were 15.1 tonnes of carbon dioxide equivalent (t CO2-e) per capita (figure 7). This is higher than the developed-country average of 8.8 t CO2-e. When looking at gross CO2-only emissions, Aotearoa New Zealand’s per-capita emissions reduce to 6.7 tonnes of CO2 per capita which is very close to the developed-country average of 6.8 tonnes of CO2 per capita (figure 7).
Aotearoa has the highest proportion of Agriculture sector emissions compared to other developed countries, followed by Ireland (37 per cent) and Denmark (27 per cent). Typically, in other developed countries, the Agriculture sector constitutes only a small proportion of gross emissions (13 per cent on average).
Aotearoa New Zealand’s Energy sector emissions per capita are 6.1 t CO2-e, slightly lower than the developed country average of 6.4 t CO2-e. This is because Aotearoa New Zealand's high proportion of renewable electricity generation offsets relatively high transport emissions. Eighty-seven per cent of Aotearoa New Zealand’s electricity supply was generated from renewables in 2022, which is very high by international standards.
Aotearoa has high per-capita transport emissions, at 2.7 t CO2-e compared to the developed-country average of 2.0 t CO2-e. This is due to Aotearoa New Zealand's small but widely distributed population, and long narrow geography, resulting in road transport being the central element of the transport system.
Gross emissions in Aotearoa have increased since 1990, whereas in many other developed countries (eg, the United Kingdom and Germany), emissions are now below 1990 levels. Transforming energy systems by decarbonising electricity generation has provided significant opportunities for many countries to effectively reduce emissions.
In 1990, 81 per cent of Aotearoa New Zealand’s electricity supply was already being generated from renewables, which was very high by international standards and still is.
Aotearoa New Zealand’s electricity demand has increased since 1990, requiring a 37 per cent increase in electricity generation between 1990 and 2022. Aotearoa has kept up with the increased demand for electricity while maintaining a high rate of renewable-electricity generation. While the volume of electricity generated from renewables fluctuates annually due to weather, over the past 10 years the average share of electricity generated from renewable energy sources has been similar to the 1990 proportion, at 82 per cent.
Aotearoa has met the additional electricity demand across the period by increasing capacity for renewable electricity generation, however, the high rates of renewables in 1990 has limited the extent to which electricity emissions could be reduced relative to other countries. Emissions reductions in other areas, such as agriculture and transport, are generally seen as more difficult to achieve.
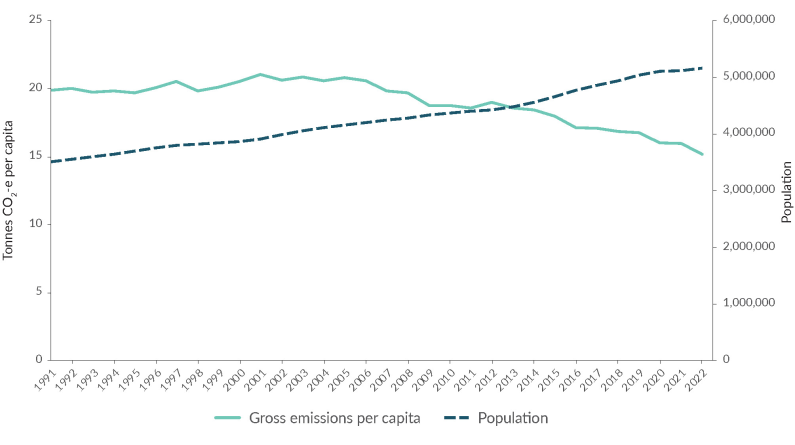
Aotearoa New Zealand’s emissions have increased between 1991 and 2022 while Aotearoa has also had strong economic and population growth. During this time, emissions per capita decreased by 24 per cent while the population increased by 47 per cent (figure 8). Emissions per capita were relatively stable between 1991 and 2005, however, from 2006 they have been declining, while population has continued to increase.
Stats NZ publishes information on the relationship between Gross Domestic Product (GDP) and gross emissions in their GHG emissions (industry and household) update. This update is on a System of Environmental-Economic Accounting (SEEA) basis and enables GDP and emissions to be compared. For information on emissions and GDP for the year ended 2021, including by sector, see Stats NZ's greenhouse gas emissions (industry and household) (opens in new window) [Stats NZ] update. An update for the year ended 2022 will be published in May 2024.
3 Population data is from Stats NZ’s Estimated Resident Population, which is only available from 1991. For this reason, comparisons between population growth and emissions per capita are between 1991 and 2022.
Aotearoa has set domestic emissions reduction goals to drive the transition to a low-emissions economy. Successive emissions budgets have been set to limit domestic emissions and ensure Aotearoa is on track to meet the net-zero 2050 target under the Climate Change Response Act 2002.
Aotearoa New Zealand’s first domestic emissions budget for the period 2022 to 2025 is 290 Mt CO2-e. The first emissions reduction plan, released in May 2022, sets out how Aotearoa will reduce emissions to meet the first emissions budget. The plan includes strategies and policies across every sector to reduce emissions. Aotearoa New Zealand’s second emissions reduction plan will be released by December 2024, and will outline the actions Aotearoa will take to meet the second emissions budget of 305 Mt CO2-e for 2026 to 2030.
Aotearoa is committed to meeting these goals to limit total net emissions to no more than 290 Mt CO2-e from 2022 to 2025 and 305 Mt CO2-e from 2026 to 2030 (Government Target 9: Reduced net greenhouse gas emissions (opens in new window) [DPMC]).
Emissions reduction plans and emissions budgets allow Aotearoa to play our part in the global effort under the Paris Agreement to reduce emissions and limit global temperature increase to 1.5 degrees Celsius.
Aotearoa has also set an international emissions reduction target. This has been communicated through Aotearoa New Zealand’s first Nationally Determined Contribution (opens in new window) (NDC1), as required under the Paris Agreement. NDC1 sets a target of a 50 per cent reduction of net emissions below gross 2005 levels by 2030.
Inventory data provide the basis for tracking progress against Aotearoa New Zealand’s emissions reduction goals including NDC1, emissions budgets and the Government’s commitments taken under Target 9. Accounting rules are applied to the inventory estimates when tracking progress to ensure our contribution is credible and reflects our national circumstances. This means the net emissions estimates reported in the inventory cannot be used directly for tracking progress.
The latest update on how we are tracking towards our emissions reduction goals can be found on the Ministry for the Environment’s webpage New Zealand’s projected greenhouse gas emissions to 2050 (opens in new window).
Aotearoa will submit its first Biennial Transparency Report under the Paris Agreement by December 2024. This report will cover how Aotearoa is tracking towards the achievement of NDC1 and will include updated emissions projections. It will also cover information on adaptation measures and financial contributions to developing countries to address climate change.
The 2024 greenhouse gas (GHG) inventory looks different from previous submissions. This is the first inventory reported under the Paris Agreement and the United Nations Framework Convention on Climate Change (UNFCCC). Previous inventories were submitted under UNFCCC and the Kyoto Protocol.
Under the Paris Agreement, Aotearoa still reports its human-induced GHG emissions and removals back to 1990, as previously required under the UNFCCC, but there are some differences. We no longer report the supplementary information required under the Kyoto Protocol in the annual inventory. Instead, much of that type of information, including how we account for emissions in tracking our Nationally Determined Contributions, will be reported in our biennial transparency reports, the first of which is due by 31 December 2024.
As part of the shift to Paris reporting, we now use the 100-year time horizon global warming potential (GWP100) values from the Intergovernmental Panel on Climate Change (IPCC) Fifth Assessment Report (AR5) when comparing GHGs. Our previous inventory submissions applied GWP100 values from earlier IPCC assessment reports. From 2015 to 2023, inventory submissions were compiled using GWP100 values from the Fourth Assessment Report (AR4).
The decision to move to AR5 GWP100 values was made by all Parties to the Paris Agreement and reflects more up-to-date knowledge. Other reporting under the Paris Agreement, including our Nationally Determined Contribution and GHG projections, also use AR5 GWP100 values.
Global warming potentials are used to compare the warming effects of each GHG to that of carbon dioxide. AR5 updates these comparisons in line with more up-to-date science. Some gases, such as methane, have a higher carbon dioxide equivalence under AR5 than they did under AR4, while some, such as nitrous oxide, have a lower equivalence.
Different sectors emit different proportions of GHGs. For example, the Energy sector has a high proportion of carbon dioxide, while Agriculture and Waste have high proportions of methane. This means that the percentage of Aotearoa New Zealand’s overall emissions that each sector represents looks different in the 2024 inventory, compared to previous inventories. For instance, Agriculture now represents a higher percentage of Aotearoa New Zealand’s total emissions, due to methane having a higher carbon dioxide equivalence under AR5 than under AR4.
While the reported emissions estimates and the proportion of emissions by sector has changed with the shift to AR5, this does not represent a change in actual emissions since the 2023 inventory, instead it means we have a more accurate way to calculate emissions than before.
When global warming potentials, methodologies or underlying data change, we recalculate inventory data for every year across the whole inventory time series – from the base year (1990) to the latest year. This means that emissions comparisons between different years should only be done within the same inventory. Comparing inventories released in different years is not valid, because the underlying methodologies, emissions factors, and data-collection activities are all likely to have changed.
Carbon dioxide equivalent (CO2-e) – Carbon dioxide equivalent is a measure for comparing different greenhouse gases (GHGs) based on the heating effect of each gas relative to an equivalent amount of carbon dioxide over a given time period. CO2-e is used for expressing emissions of different GHGs in a common unit, which allows them to be reported and warming impacts compared.
Carbon sink – A carbon sink is any process, activity or mechanism which removes more GHGs from the atmosphere than it emits. The LULUCF sector in Aotearoa is a net carbon sink as it removes more carbon dioxide from the atmosphere than it emits.
Developed countries – The use of the term ‘developed countries’ for this comparison refers to countries that are classified as Annex I under the UNFCCC. Annex I to the UNFCCC lists the industrialised countries that were members of the Organisation for Economic Co-operation and Development and countries with economies in transition in 1992 (the year in which the UNFCCC was agreed). Countries listed in Annex I that are Parties to the UNFCCC are required to report regularly on their climate change data, policies and measures.
New Zealand's Greenhouse Gas Inventory is the official source of information for Aotearoa New Zealand’s greenhouse gas emissions data, however, other sources of data are derived from the inventory for domestic purposes:
New Zealand’s Greenhouse Gas Inventory 1990–2023 will be published by 15 April 2025.
The Ministry for the Environment thanks the following agencies for their contribution to the production of New Zealand’s Greenhouse Gas Inventory 1990–2022:
The information in this publication is, according to the Ministry for the Environment’s best efforts, accurate at the time of publication. The Ministry will make every reasonable effort to keep it current and accurate. However, users of this publication are advised that:
New Zealand's Greenhouse Gas Inventory 1990–2022: Snapshot
April 2024
© Ministry for the Environment