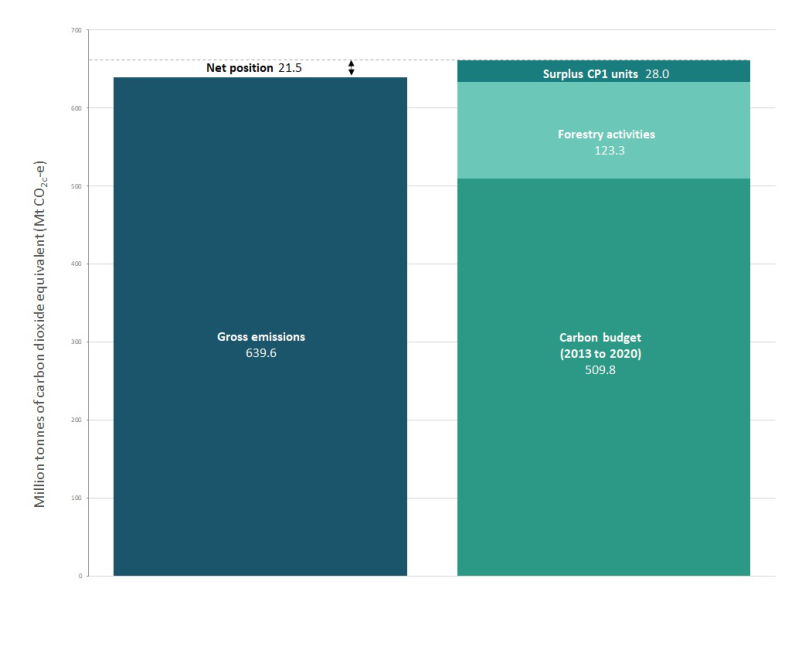
Latest update on New Zealand's 2020 net position
The latest update on New Zealand’s 2020 net position and how it is calculated. We use the net position to track progress towards our emissions reduction target for the period 2013–2020.
The latest 2021 net position update uses:
One unit represents one tonne of greenhouse gas emissions as carbon dioxide equivalent (CO2-e). Carbon dioxide equivalent is a measure used to compare the emissions from various greenhouse gases based on their global warming potential.
For information on how New Zealand’s 2020 net position is calculated and the carbon budget (also referred to as the emissions budget) see New Zealand’s initial report.
To reach its unconditional 2020 emissions reduction target by the end of the 2013 to 2020 period, New Zealand will need to hold units at least equivalent to gross emissions during this period. See the graph below for information on the net position at 15 April 2021.
Emissions and removals from forestry activities are represented by units based on the Kyoto Protocol accounting framework (refer to New Zealand’s Initial Report for further information on the accounting framework).
| 2013 | 2014 | 2015 | 2016 | 2017 | 2018 | 2019 | 2020 | Total | |
|---|---|---|---|---|---|---|---|---|---|
| Historic | Projected | ||||||||
| Units | |||||||||
| 2013 to 2020 carbon budget | 509.8 | ||||||||
| Kyoto Protocol forestry activities | 9.4 | 12.8 | 14.9 | 16.2 | 16.3 | 14.9 | 12.9 | 11.9 | 109.2 |
| Surplus units from CP1 | 28.3 | ||||||||
| Total units | 647.3 | ||||||||
| Emissions | |||||||||
| Stationary energy | 17.9 | 17.8 | 17.7 | 16.1 | 16.7 | 16.3 | 18.1 | 17.6 | 138.2 |
| Transport | 14.41 | 14.4 | 14.9 | 15.0 | 15.9 | 16.2 | 16.2 | 14.6 | 121.2 |
| Industrial processes and product use | 4.8 | 5.0 | 5.2 | 5.0 | 5.1 | 5.2 | 5.1 | 5.8 | 40.3 |
| Agriculture | 39.4 | 40.0 | 39.5 | 39.1 | 39.1 | 39.5 | 39.6 | 38.6 | 314.8 |
| Waste | 3.6 | 3.5 | 3.5 | 3.5 | 3.4 | 3.4 | 3.3 | 3.3 | 27.6 |
| Tokelau | 0.004 | 0.003 | 0.003 | 0.003 | 0.004 | 0.004 | 0.004 | 0.004 | 0.03 |
| Gross emissions | 79.8 | 80.7 | 80.7 | 78.7 | 80.3 | 82.3 | 78.9 | 642.0 | |
| Net position | 5.3 |
Note: All emissions units are in Mt CO2-e. Numbers may not add to totals due to rounding to one decimal place.
After accounting for forestry emissions and removals using the Kyoto Protocol framework of rules, New Zealand is projected to have gross emissions for the 2013–20 period 3.7 per cent higher than the carbon budget available. New Zealand is projected to use 23.1 million surplus units from the first commitment period (CP1) to meet its 2020 target.
In total, New Zealand is projected to hold 647.3 million units at the end of the 2013–2020 period.
This results from:
For a 5 per cent reduction on 1990 emissions by 2020, New Zealand’s carbon budget for 2013 to 2020 is 509.8 Mt CO2-e representing 509.8 million units for accounting purposes.
This budget is based on 1990 emissions reported in New Zealand’s Greenhouse Gas Inventory 1990–2014 and calculated according to United Nations Framework Convention on Climate Change (UNFCCC) guidance (refer to New Zealand’s Initial Report for further information on the accounting framework).
In line with the Kyoto Protocol framework of rules, net emissions and removals from eligible forestry activities can offset gross emissions.
Net emissions and removals from eligible forestry activities are projected to remove 109.2 Mt CO2-e from the atmosphere from 2013 to 2020. Emissions and removals from forestry activities are strongly influenced by historic forest planting rates, harvesting and deforestation activities.
For more information, refer to chapter 11 of New Zealand’s Greenhouse Gas Inventory 1990-2019.
Historic gross emissions are sourced from the inventory and future gross emissions from updated projections for each sector. These gross emissions are reported in the sector categories described below.
| Sector category | Projected gross emissions |
|---|---|
| Stationary energy | Annual energy emissions (including fugitive emissions) without transport decrease over 2013 to 2020 and are expected to total around 138.2 Mt CO2-e during this period. |
| Transport |
Annual transport emissions increase over the 2013 to 2020 period and are expected to contribute a total of 121.2 Mt CO2-e. This increase in emissions is driven by population growth with the demand for petrol and diesel for road transport increasing. |
| Industrial processes and product use |
Annual industrial processes and product use (IPPU) emissions increase slightly over 2013 to 2020 and are expected to total around 40.3 Mt CO2-e for the period. Most of this projected growth is caused by increased consumption of hydrofluorocarbons (HFCs). Emissions of other greenhouse gases from the IPPU sector are projected to remain steady. In October 2016, New Zealand adopted the Kigali Amendment to the Montreal Protocol to phase down HFC consumption and production along with nearly 200 other parties worldwide. New Zealand ratified the amendment, in October 2019 with it entering into force on 1 January 2020. |
| Agriculture |
Agriculture emissions decrease over 2013 to 2020 and are expected to total 314.8 Mt CO2-e over the period. This decrease in emissions is in line with:
|
| Waste |
Waste emissions decline slightly over 2013 to 2018, and are expected to remain relatively steady over 2019 to 2020 to give a total of 27.6 Mt CO2-e. Increasing solid waste disposal amounts are expected to continue at similar historical rates. It is anticipated the resulting increased emissions will be offset by methane capture. Forecasted waste disposal amounts are based off projected trends. |
Changes in sector projections since the previous net position update (in December 2019) are mostly from transport and agriculture activities and are summarised in the table below.
|
(MT CO2-E /MILLIONS OF UNITS) |
APR-20 |
CHANGE |
APR-21 |
|
Stationary energy |
133.4 |
+4.7 |
138.2 |
|
Transport |
126.4 |
-5.2 |
121.2 |
|
Industrial processes and product use |
40.6 |
-0.3 |
40.3 |
|
Agriculture |
299.1 |
+15.8 |
314.8 |
|
Waste |
32.8 |
-5.2 |
27.6 |
|
Other (Tokelau) |
0.03 |
+0.00 |
0.03 |
|
Gross emissions |
632.3 |
+9.7 |
642.0 |
|
Carbon budget |
509.8 |
0.0 |
509.8 |
|
Forestry activities |
108.0 |
+1.2 |
109.2 |
|
Surplus from CP1 |
123.7 |
-95.4 |
28.3 |
|
Units |
741.5 |
-94.2 |
647.3 |
|
|
|||
|
Net position |
109.2 |
-103.9 |
5.3 |
Note: Numbers may not add to totals due to rounding to one decimal place.