This snapshot summarises the latest Greenhouse Gas Inventory, which covers data from the years 1990 to 2024.
For the full Inventory report, see New Zealand's Greenhouse Gas Inventory 1990–2024.
We are working to improve the suite of products that sit alongside the Greenhouse Gas Inventory, like the Snapshot and Interactive Emissions Tracker. We want to ensure these resources are clear, accessible and meet the needs of our users. Your feedback will help shape future updates and guide where we focus improvements.
Please share your thoughts on our products in this short survey (Microsoft forms).
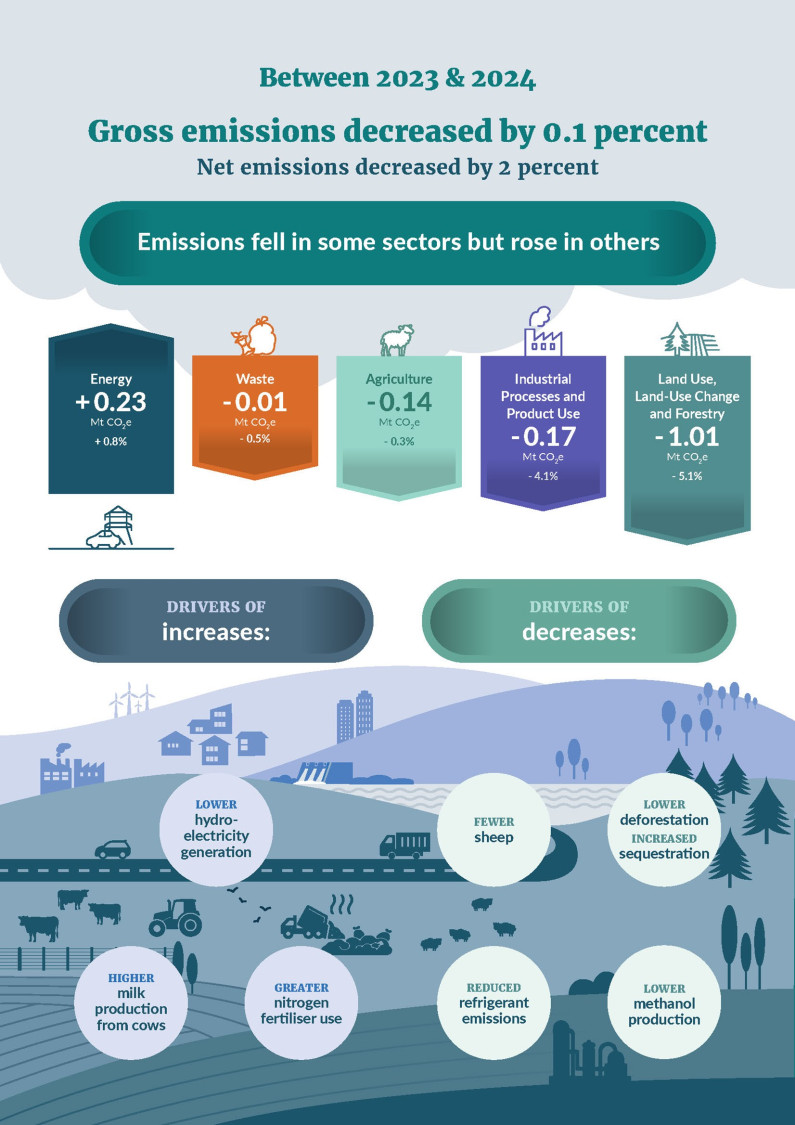
Between 2023 and 2024, New Zealand’s gross emissions decreased by 0.1%, and net emissions decreased by 2%.
Emissions fell in some sectors but rose in others.
A chart shows the emissions changes across the five sectors:
- The energy sector saw an increase of 0.23 million tonnes of carbon dioxide equivalent, a rise of 0.8%.
- The waste sector saw a decrease of 0.01 million tonnes of carbon dioxide equivalent, a drop of 0.5%.
- The agriculture sector saw a decrease of 0.14 million tonnes of carbon dioxide equivalent, a drop of 0.3%.
- The industrial processes and product use sector saw a decrease of 0.17 million tonnes of carbon dioxide equivalent, a drop of 4.1%.
- The land use, land-use change and forestry sector saw a decrease of 1.01 million tonnes of carbon dioxide equivalent, a drop of 5.1%.
An illustrated landscape shows rolling hills, trees, wind turbines, a hydroelectricity dam, houses and roads, a landfill, and an agricultural scene with sheep and cattle.
Throughout the landscape are text bubbles that list the drivers of emissions increases and decreases between 2023 and 2024.
The drivers of increases were:
- lower hydroelectricity generation
- higher milk production from cows
- greater nitrogen fertiliser use.
The drivers of decreases were:
- fewer sheep
- lower deforestation and increased sequestration
- reduced refrigerant emissions
- lower methanol production.
The Inventory is the authoritative source of evidence on New Zealand’s greenhouse gas emissions and removals
New Zealand’s Greenhouse Gas Inventory (the Inventory) is the official annual report of all emissions and removals of greenhouse gases from human activities in New Zealand. It is produced as part of New Zealand’s obligations under the Paris Agreement and United Nations Framework Convention on Climate Change, and is legislated under the Climate Change Response Act (2002).
The Inventory is a Tier 1 statistic under New Zealand’s Official Statistics System. This means it is one of the most important publicly available statistics for making informed decisions, and for monitoring the state and progress of New Zealand.
Accurate emissions data are essential for understanding current emissions and historical trends, informing climate policy, and for developing and monitoring emissions reduction plans and targets. The Inventory is also the official data source used to assess whether New Zealand has met its international and domestic emissions budgets and targets, with assessments undertaken once each target period has concluded.
The Inventory provides a shared evidence base for government, businesses, communities, researchers and households. It shows where progress has been made and more opportunities exist, supporting more focused choices that can have the most impact, from major investments to everyday actions.
The Inventory is prepared based on internationally agreed reporting guidelines
The Inventory is prepared according to Paris Agreement reporting guidelines and the international methodology set out by the Intergovernmental Panel on Climate Change (IPCC). The guidelines govern what the Inventory covers and when it is submitted. The latest year of inventory data is 16 months behind the current calendar year, to give countries time to collect and process the data and prepare the submission. The latest Inventory, published in April 2026, contains data from 1990 (the base year for reporting) to 2024 (inclusive).
Inventory reporting uses carbon dioxide equivalence (CO2e) for comparing greenhouse gases, allowing us to compare the warming effect of different gases on a like-for-like basis. The Inventory applies 100-year global warming potential (GWP100) values from the IPCC Fifth Assessment Report (AR5). This is the required common metric under the Paris Agreement.
Inventory estimates are continuously improved
Data for each year in the Inventory, from 1990 to the latest year, is recalculated every year so it always reflects the best available evidence. As new information becomes available, or as methodologies improve, this recalculation means the whole time series stays consistent. Only the latest Inventory contains the most up-to-date set of numbers. If you want to compare emissions over time you should always use data from the most recent Inventory.
Further information on the improvements that have been introduced this year, and their emissions impacts, are described in Chapter 10 of the Inventory.
The Inventory groups emissions and removals into five sectors:
- Agriculture, eg from livestock, fertiliser and manure
- Energy, eg from road transport, electricity production and fuel use
- Industrial Processes and Product Use (IPPU), eg from production of metals and chemicals, and use of refrigerants
- Waste, eg landfills and wastewater treatment
- Land Use, Land-Use Change and Forestry (LULUCF), eg land uses such as forest land, cropland and grassland
Gross emissions are total emissions from the Agriculture, Energy, IPPU and Waste sectors, as well as emissions from Tokelau1. Net emissions are gross emissions, plus emissions and removals from forests and other land uses (the LULUCF sector).
Gross emissions in 2024 decreased
In 2024, New Zealand’s gross emissions were 75.8 million tonnes of carbon dioxide equivalent (Mt CO2e). This is a 0.1 percent lower than 2023, a decrease of 0.087 Mt CO2e.
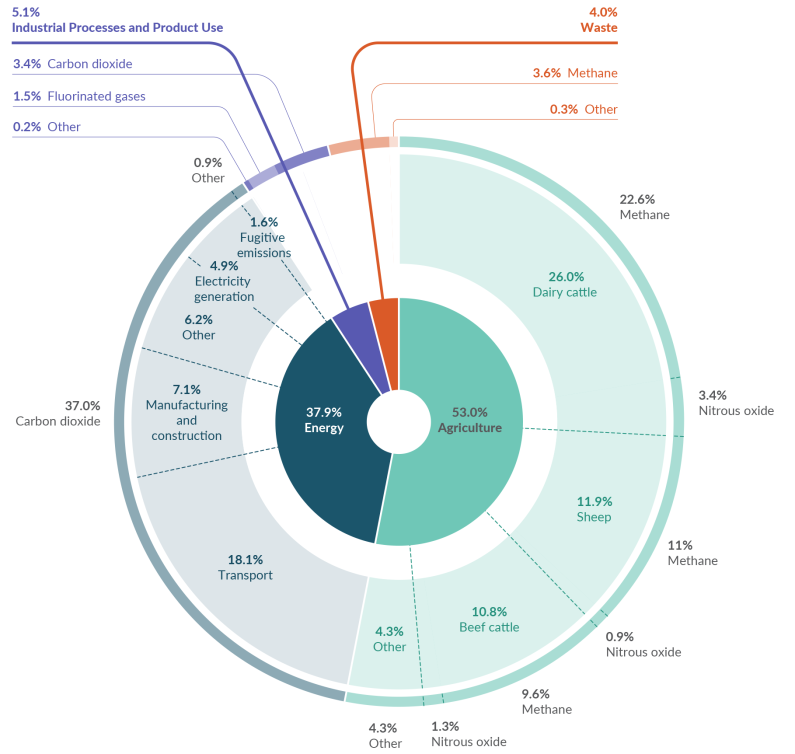
The Agriculture and Energy sectors remained the greatest contributors to gross emissions, at 53 and 38 percent, respectively (figure 1). Over half of gross emissions were from methane (48 percent) and nitrous oxide (9 percent), largely from agricultural sources (figure 2). The remaining emissions were mostly carbon dioxide (41 percent), largely from the Energy and IPPU sectors.
1 New Zealand extended its ratification of the United Nations Framework Convention on Climate Change and Paris Agreement on 13 November 2017 to include Tokelau, an overseas dependent territory of New Zealand. Emissions from Tokelau have been included since the 2019 submission of the Inventory.
Figure 1: Breakdown of New Zealand’s emissions (in Mt CO2e) by sector in 2024
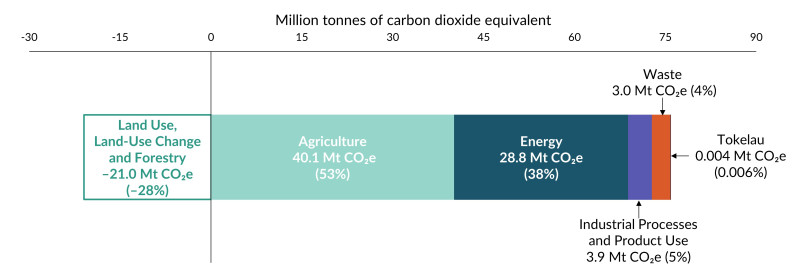
Figure 2: Gross greenhouse gas emissions percentages in 2024 by sector, category and gas type
Despite a small decrease in gross emissions, there were still some large changes within sectors
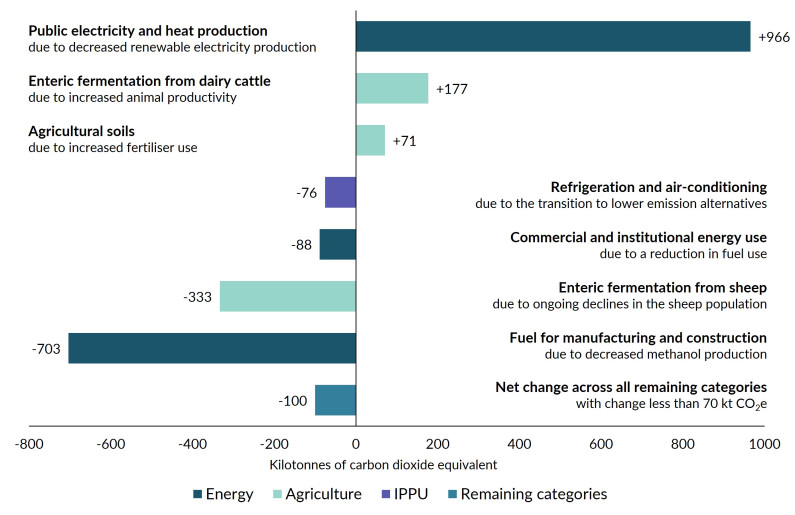
While gross emissions levels decreased slightly between 2023 and 2024, within the sectors there were significant changes in underlying activities, resulting in large increases in some categories and large decreases in others (figure 3).
Changes in emissions across categories are often linked. For example, in 2024 low rainfall reduced hydroelectricity generation, and more fossil-fuel generation was required to meet demand. This was the biggest category increase in 2024. Because more fuel was being used for electricity generation, some manufacturing slowed or ceased to free up fuel supplies and reduce electricity consumption. In particular, methanol production decreased, resulting in lower emissions from fuel use for manufacturing. Most New Zealand methanol is exported for use in products ranging from plastics to construction materials.
Figure 3: Categories with the biggest increases and decreases to gross emissions between 2023 and 2024
Net emissions are influenced by forest planting cycles
Net emissions in 2024 were 54.8 Mt CO2e, 2 percent (1.1 Mt CO2e) lower than in 2023. Net emissions trends are strongly influenced by forest planting cycles. Forests absorb carbon dioxide from the atmosphere as they grow, but also release it after being harvested, deforested, or following disturbances like storm damage. This means that, in New Zealand, net emissions often have greater annual fluctuations than gross emissions (figure 4).
New Zealand’s LULUCF sector is a net carbon sink, meaning it absorbs more carbon dioxide than it emits. In 2024, the LULUCF sector absorbed 28 percent (21.0 Mt CO2e) of gross emissions.
In 2024, removals from the LULUCF sector increased and emissions decreased, leading to an overall increase in removals for the sector. This is because there were less emissions from deforestation in 2024 compared to 2023. There were also increased removals in forests planted since 2019. As young forests age and their growth rates increase, their sequestration rates also increase.
Figure 4: New Zealand’s gross and net emissions (in Mt CO2e) from 1990 to 2024
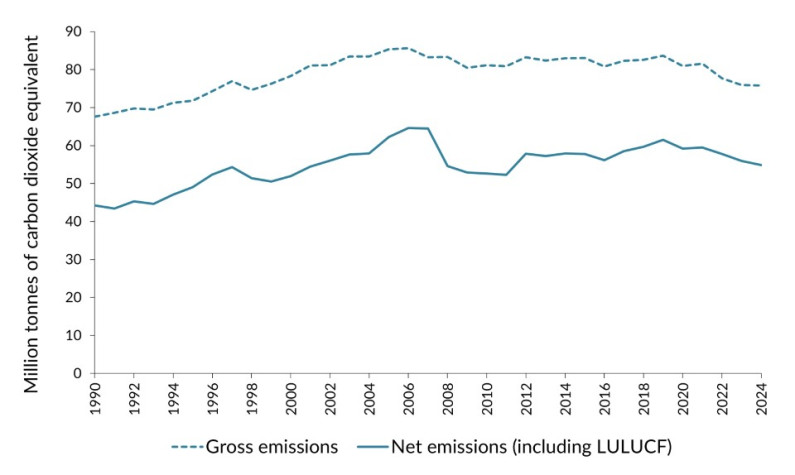
Gross and net emissions peaked in 2006
New Zealand’s gross and net emissions increased steadily from 1990, reaching a peak in 2006 at 85.6 Mt CO2e and 64.6 Mt CO2e respectively (figure 5). Gross emissions stayed relatively stable for more than a decade, before beginning a period of general decline from 2019. A small increase between 2020 and 2021 reflects rebounds following the COVID-19 pandemic.
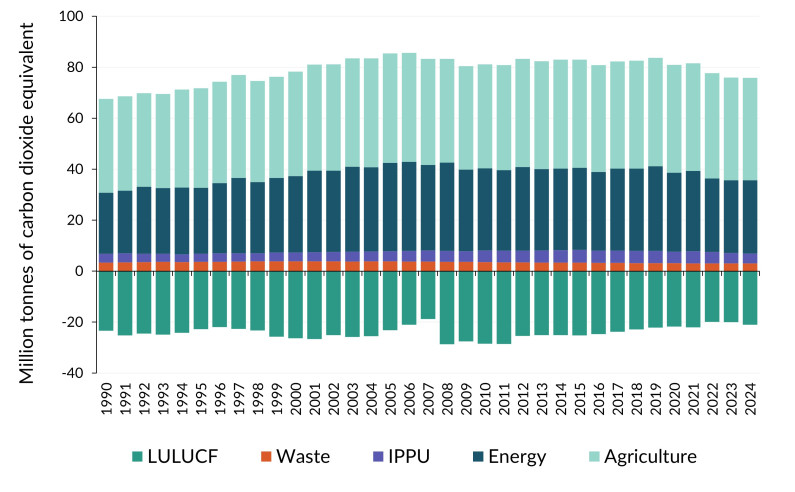
These long-term trends reflect wider changes in New Zealand’s economy, population and land use, as well as how we do things – such as increasing renewable electricity generation, improving waste management, and farming and manufacturing differently.
- Population and economic growth since 1990 have driven increases in vehicle traffic, and manufacturing and construction, resulting in increased emissions.
- While electricity demand has risen with the growing population, emissions from electricity generation have declined since 2005 due to increased renewable electricity generation. Emissions still fluctuate annually as the amount of renewable electricity generated is tied to rainfall.
- Population growth has also resulted in increased waste volumes. Despite this, emissions from waste have been in steady decline since 2002 due to improved waste management at landfills.
- New Zealand’s agriculture sector has been through a significant change since 1990, shifting from predominantly sheep farming to dairy farming. With this has come increased emissions from dairy cattle and fertiliser application, and a steady decline in emissions from sheep.
Further trends by sector, including drivers, are outlined in table 1.
Figure 5: New Zealand’s greenhouse gas emissions (in Mt CO2e): Trends by sector from 1990 to 2024
Drivers of emissions trends by sector
Agriculture
2023–2024
Emissions change: 0.3% decrease
Drivers: Continued reductions in sheep numbers and lower urea and limestone application, partially offset by higher dairy cattle emissions due to increased animal productivity (more milk being produced per cow).
Long-term trends
1990–2024 emissions change: 9% increase
2005–2024 emissions change: 6% decrease
Drivers: Emissions rose to a peak in 2005, then decreased after the 2008 financial crisis and a nationwide drought, before rising to just below 2005 levels by 2014. They were relatively stable between 2015 and 2021 but have been decreasing since. Increases have been driven by dairy herd growth and increased fertiliser use, while decreases have been driven by declines in sheep and beef cattle populations. Decreases since 2022 reflect lower livestock numbers and market factors such as fertiliser prices.
Energy
2023–2024
Emissions change: 0.8% increase
Drivers: In 2024, low rainfall reduced hydroelectricity generation, and more fossil-fuel generation was required to meet electricity demand. Because more fuel was required for electricity generation, some manufacturing slowed or ceased to free up fuel supplies. In particular, methanol production decreased, resulting in lower emissions from fuel use for manufacturing.
Long-term trends
1990–2024 emissions change: 20% increase
2005–2024 emissions change: 17% decrease
Drivers: Emissions increased steadily until 2006, driven by increased population and economic growth, which increased demand for transport and industrial energy. Between 2007 and 2019 emissions were steady, with declines in 2020 due to COVID-19, and in 2022 and 2023 due to increased hydropower generation.
Industrial Processes and Product Use (IPPU)
2023–2024
Emissions change: 4% decrease
Drivers: Ongoing decreases in emissions from refrigerants, as New Zealand transitions to lower emitting alternatives, and decreased methanol and aluminium production in response to dry year conditions.
Long-term trends
1990–2024 emissions change: 12% increase
2005–2024 emissions change: 4% decrease
Drivers: Emissions increased steadily to 2015, largely due to ozone depleting substances being replaced with higher emitting hydrofluorocarbons (HFCs) for refrigeration and air conditioning, alongside growth in the use of household and commercial air conditioning. Since 2022, emissions have declined as the sector phases down the use of high-emissions HFCs.
Waste
2023–2024
Emissions change: 0.5% decrease
Drivers: Improved landfill gas capture and ongoing reductions in the proportion of garden, food and paper waste disposed to landfill.
Long-term trends
1990–2024 emissions change: 10% decrease
2005–2024 emissions change: 21% decrease
Drivers: Emissions increased between 1990 and 2002, before stabilising, then declining steadily since 2005. This is due to improved management of solid waste disposal at landfills. Drivers for these improvements include the 2004 National Environmental Standards for Air Quality and the New Zealand Emissions Trading Scheme, which has included large municipal landfills since 2013.
Land Use, Land-Use Change and Forestry (LULUCF)
2023–2024
Removals change: 5% net removals increase
Drivers: Less deforestation and conversion to grassland in 2024 compared to 2023, decreasing emissions reported from grassland. There were also increased removals in forest land from forests planted since 2019, as the increasing growth rate of these young forests increases the amount of carbon they sequester.
Long-term trends
1990–2024 removals change: 10% net removals decrease
2005–2024 removals change: 9% net removals decrease
Drivers: Long-term trends are driven by harvest and replanting cycles. Since 2008, net removals have generally been decreasing due to the large proportion of maturing planted forests undergoing harvest. In the future, as harvest rates begin to decline and younger stands mature, net removals are likely to increase.
See more on...
New Zealand’s Greenhouse Gas Inventory 1990–2024: Snapshot
April 2026
© Ministry for the Environment