New Zealand’s varying land-cover patterns are the result of human and natural pressures, such as land-use changes and geological and ecosystem processes.
Land cover
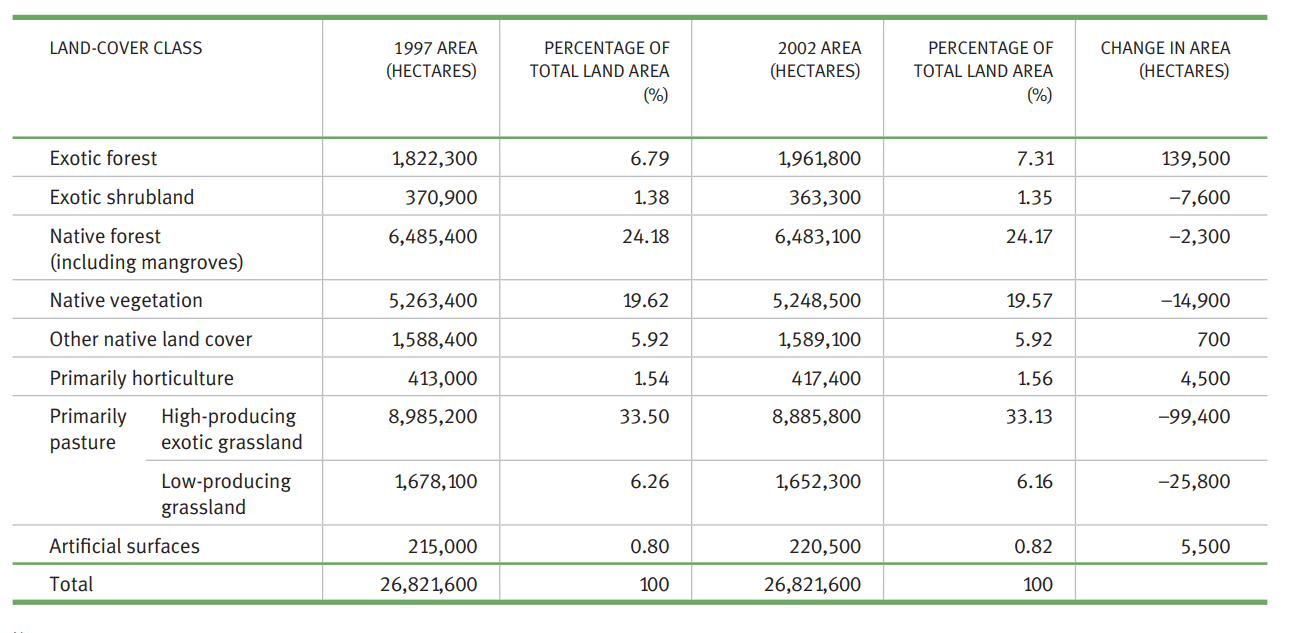
Table 9.3 shows the area of the nine major land-cover classes from the LCDB, including the percentage contribution each class makes to New Zealand’s total land area. The table also illustrates the change within each class for the five-year period between 1997 and 2002.
North and South Island maps showing these same nine land-cover classes for 2002 are presented in chapter 1, ‘Environmental reporting’. Changes in native vegetation since human settlement, between 1997 and 2002, are reported in chapter 12, ‘Biodiversity’.
Table 9.3: Changes in land cover between 1997 (LCDB 1) and 2002 (LCDB 2)
Note:
Figures rounded to the nearest 100 hectares.
Data source: Ministry for the Environment.
Vegetation cover
As shown in Table 9.3, exotic forest covered 7.31 per cent of New Zealand’s total land area in 2002. Between 1997 and 2002, exotic forest increased in area by 139,500 hectares. During this time, native forest (including mangroves), native vegetation, and primarily pasture land-cover classes reduced in area by 142,400 hectares. Over the same period, exotic forests were primarily planted onto pasture with some exotic forest replacing exotic shrubland and, in some cases, native vegetation (mānuka and kānuka).
Table 9.3 also shows that land area in exotic shrubland reduced by 7,600 hectares between 1997 and 2002. Much of this was gorse and broom which may have been converted to forestry land, left to revert to native scrub, or converted into vineyards. (See discussion under ‘Primarily horticulture’ and ‘Primarily pasture’ below.)
Between 1997 and 2002, native forest decreased by 2,300 hectares. In 2002, native forest, native vegetation, and other native land cover made up around 50 per cent of New Zealand’s total land area – just over 13 million hectares. (See chapter 12, ‘Biodiversity’ for more information about changes in native forest, native vegetation, and other native land cover.)
Native vegetation (excluding native forest and other native land cover) reduced in area by 14,900 hectares between 1997 and 2002. This reduction was predominantly due to changes in land area covered by:
-
broadleaved native hardwoods (a reduction of 6,600 hectares)
-
mānuka and kānuka (a reduction of 5,400 hectares)
-
tall tussock grassland (a reduction of 2,500 hectares).
LCDB analysis shows that 83 per cent of the land area in broadleaved native hardwoods was converted into exotic forest land cover and 12.5 per cent was converted into pasture and grassland. Of the mānuka and kānuka, 52.5 per cent was converted into exotic forest land cover, 36 per cent into low-producing grassland, and 10 per cent into high-producing exotic grassland. All tall tussock grassland that experienced land-use change was converted into exotic forest land cover.
Overall, about 65 per cent of the 14,900 hectare reduction in native vegetation was converted into exotic forest land cover, with 7 per cent into high-producing exotic pasture and 17 per cent into low-producing grassland.
Primarily horticulture
Horticultural, viticultural, and cropping land-cover classes made up just under 1.6 per cent (or 417,400 hectares) of New Zealand’s total land area in 2002. This included:
-
58,300 hectares in orchard and other perennial cropland (for example, nuts, berryfruit)
-
25,400 hectares in vineyard
-
333,700 hectares in short rotation cropland (for example, arable cropping such as grains and fodder crops for livestock feed, or market gardens for vegetables).
There was little change between 1997 and 2002 in the land area in orchard and perennial cropland (an increase of 0.39 per cent or 200 hectares) and short rotation cropland (a reduction of 0.37 per cent or 1,200 hectares). However, LCDB analysis shows the land area in vineyards increased by 28 per cent (or 5,500 hectares). Part of this increase was due to conversion of short rotation (arable) cropland.
Primarily pasture
‘Primarily pasture’ classes (high-producing exotic grassland and low-producing grassland) covered just over 39 per cent of New Zealand’s total land area in 2002. There was a reduction in high-producing exotic pasture of 99,400 hectares (or 1.1 per cent) between 1997 and 2002. LCDB analysis shows that some of this land area was converted into urban areas (see ‘Artificial surfaces’ on the following page). Over the same period, the land area in low-producing grassland reduced by 25,800 hectares (or 1.54 per cent), and was mainly converted to exotic forestry.
As a comparison, New Zealand’s Agricultural Production Statistics surveys between 1972 and 1996 show that the land area in grassland including lucerne (that is, pastoral land cover) was about 8.0 million hectares in 1972 and just over 9.1 million hectares in 1996 – an increase of 1,153,992 hectares or about 15 per cent over 24 years. The total land area in pasture increased to just over 9.5 million hectares by 1992, but dropped to 9.4 million hectares by 1994. Over the same 24-year survey period, pasture for dairy farming increased from about 1.4 million hectares to just over 1.9 million hectares or 39 per cent (Ministry of Agriculture and Forestry, pers comm; Statistics New Zealand, 1972–1996).
Artificial surfaces
Artificial surfaces include urban and built-up areas (towns and cities), landfills and surface mines, transport infrastructure, and urban parkland and open space. Artificial surfaces covered 220,500 hectares (just under 1 per cent) of New Zealand’s total land area in 2002.
Table 9.3 above shows a 2.5 per cent increase, or 5,500 hectares, for artificial surfaces between 1997 and 2002. The land areas in surface mines and landfills, however, reduced over this same period. Built-up areas (human settlements) made up 5,300 hectares or 96 per cent of the 5,500 hectare total, and increased by 3 per cent over the same period.
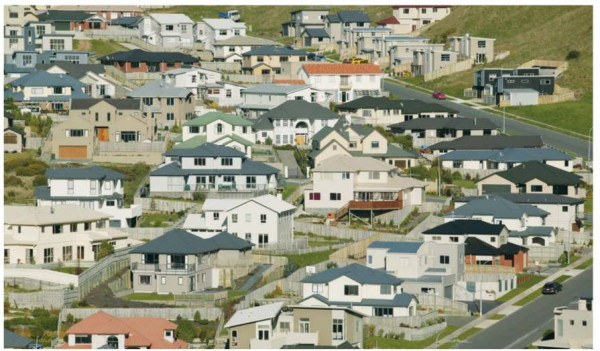
The increase in built-up areas is mainly occurring on the fringes of cities and towns through rural subdivision. For example, 88 per cent of the 5,300 hectare increase was urban and built-up areas that came from pastoral land, with a further 6 per cent from exotic forest land not replanted. Growing rural towns, such as those in the Waimakariri District in the South Island, illustrate this trend in rural subdivision.
Human settlement in New Zealand increased by just over 3 per cent between 1997 and 2002.
Source: Ministry for the Environment.
Land use
The map in Figure 9.3 provides a snapshot of land use for 2004. It also provides a baseline (that is, a reference point) for ongoing reporting on the state of the environment. This map shows the location and extent of 18 predominant land-use classes and four land-cover classes in New Zealand. Table 9.4 shows the total area and percentage of land use of these mapped classes.
Figure 9.3: Land use in New Zealand, 2004
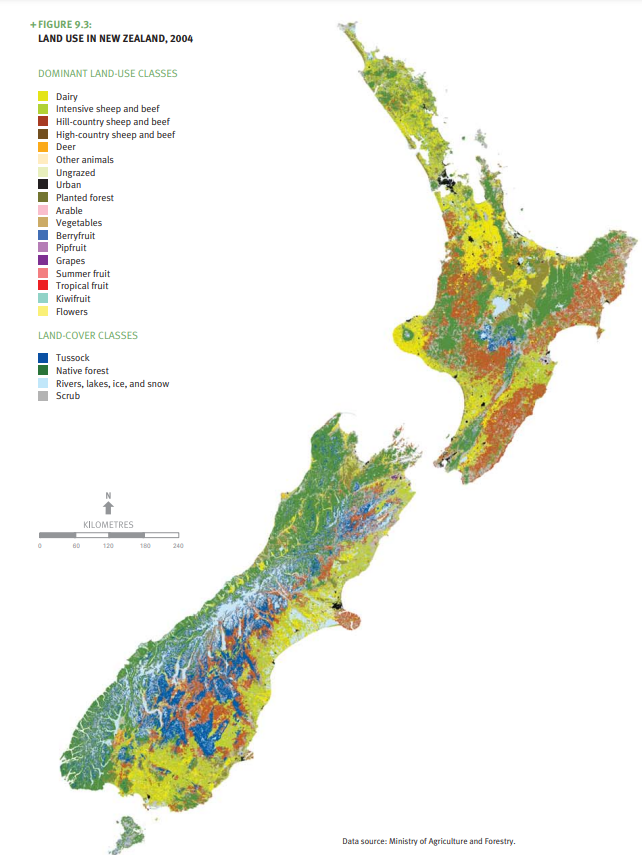
Table 9.4: Dominant land use and selected land cover in New Zealand, 2004
| Land-use classes | Hectares | Percentage of total land area (%) |
|---|---|---|
|
Dairy |
1,879,600 |
7.00 |
|
Intensive sheep and beef |
3,841,100 |
14.32 |
|
Hill-country sheep and beef |
4,023,200 |
15.00 |
|
High-country sheep and beef |
48,900 |
0.18 |
|
Deer |
249,700 |
0.93 |
|
Other animals |
64,900 |
0.24 |
|
Ungrazed |
659,800 |
2.46 |
|
Urban |
203,600 |
0.76 |
|
Planted forest |
1,957,000 |
7.30 |
|
Arable crops |
1,200 |
0.0044 |
|
Vegetables |
2,200 |
0.0083 |
|
Berryfruit |
1,200 |
0.0045 |
|
Pipfruit |
10,200 |
0.038 |
|
Grapes |
18,800 |
0.070 |
|
Summer fruit |
1,800 |
0.0069 |
|
Tropical fruit |
1,600 |
0.006 |
|
Kiwifruit |
6,400 |
0.024 |
|
Flowers |
57 |
0.0002 |
|
Land-cover classes |
||
|
Tussock |
2,645,200 |
9.86 |
|
Native forest |
6,567,200 |
24.48 |
|
Rivers, lakes, snow, and ice |
2,094,200 |
7.81 |
|
Scrub |
2,543,600 |
9.48 |
|
Total |
26,821,500 |
100 |
Data source: Ministry of Agriculture and Forestry.
Figure 9.3 and Table 9.4 show that in 2004, pastoral land use (for example, sheep, beef, and dairy farming) was New Zealand’s largest human land use at just over 37 per cent of New Zealand’s total land area. In the same year, natural land cover – such as tussock, native forest, rivers, lakes, snow, ice, and scrub – covered just over 52 per cent of New Zealand’s total land area. Natural land cover is expected to be primarily used for recreation and conservation purposes.
These figures support land cover measurements taken by LCDB satellite in 2002, which recorded that natural land cover was 50 per cent of New Zealand’s total land area that year, with land cover in pasture at 39 per cent.
More about intensive land use
Recent trends in land use in New Zealand include an increase in intensive pastoral land use with higher stocking rates and stocking densities.
According to the United Nations Food and Agriculture Organisation’s Agricultural Production Index 2006 (cited in Organisation for Economic Co-operation and Development, 2007), production rates from pastoral farming increased in New Zealand by 38 per cent between 1990 and 2003. The increase in production is mainly attributable to:
-
more intensive farming (that is, an increase in stocking rates or more livestock numbers per hectare)
-
more productivity per animal (for example, increased milk production per cow, or higher lambing percentages and carcass weights) (Organisation for Economic Co-operation and Development, 2007).
Figure 9.4 shows trends in livestock numbers in New Zealand over the past three decades. Sheep and beef cattle numbers have fallen since the early 1980s, while dairy cow and deer numbers have increased.
While the total area of New Zealand land in pasture has been decreasing since 1972, the area of land in dairy pasture has increased (Ministry of Agriculture and Forestry, pers comm). Figure 9.4 shows that dairy cow numbers have almost doubled (from 2.92 million in 1981 to 5.22 million by 2006) even though the number of dairy farms has decreased, as shown in Table 9.5. More recent figures indicate that the national dairy herd has grown by 24 per cent between 1996 and 2006.
This intensification of agricultural land use has occurred as farmers have responded to economic signals by converting suitable dry-stock pasture, exotic forestry, and existing dairy farms into more intensive dairy farms.
A change to more intensive farming in some regions has resulted in:
- further reduction of freshwater quality in lowland rivers and waterways
- changes in soil health
- increases in some greenhouse gas emissions (for example, methane).
The intensification of dairy and deer farming has been particularly notable in the South Island. Intensive agriculture is most common in the lowland areas of Northland, Waikato, Taranaki, Manawatū, Canterbury, and Southland.
Table 9.5 shows that dairy farms decreased in number from 16,843 in 1994 to 12,810 in 2005. As the area farmed fell, agricultural productivity increased (Organisation for Economic Co-operation and Development, 2007).
Figure 9.4: Livestock numbers in New Zealand, 1981–2006
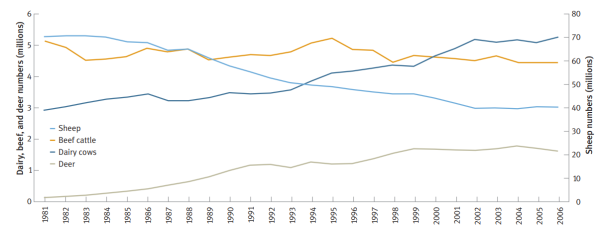
Table 9.5 Number of dairy farms in New Zealand, 1994–2005
| Year | 1994 | 1995 | 1996 | 1999 | 2002 | 2003 | 2004 | 2005 |
|---|---|---|---|---|---|---|---|---|
|
North Island |
14,808 |
14,387 |
14,170 |
13,515 |
11,928 |
10,791 |
10,707 |
10,362 |
|
South Island |
2,035 |
2,134 |
2,296 |
2,436 |
2,424 |
2,160 |
2,280 |
2,448 |
|
Total New Zealand |
16,843 |
16,521 |
16,466 |
15,951 |
14,352 |
12,951 |
12,987 |
12,810 |
Note: No Agricultural Production Survey was conducted for 1997, 1998, or 2001. In 2000, the survey related only to horticulture. Farm counts have been based on New Zealand Standard Industrial Classifications.
Data source: Statistics New Zealand.
The intensification of pastoral land use has led to a noticeable increase in the use of fertilisers and irrigation in high-producing exotic pastures, both of which have increased the environmental pressures on our waterways and groundwater (see chapter 10, Freshwater).
Figure 9.5 shows the change in nitrogen and phosphorus inputs to agricultural catchments since the mid-1980s. The amount of nitrogen fertiliser used in New Zealand has increased by about 10 times since 1985 and doubled since the mid-1990s. This is in line with the findings of a 2004 report on agriculture in New Zealand. The report found that the use of synthetic fertilisers based on fossil fuels on dairy farms had increased in recent decades. This doubled energy inputs into the average New Zealand dairy farm over the past 20 years, mostly due to the increase in nitrogen fertiliser usage (Parliamentary Commissioner for the Environment, 2004).
Nitrogen from livestock manure, which contributes around five times the amount of nitrogen to the land as nitrogenous fertilisers, has also steadily increased. This increase is consistent with the recent trend towards more intensive forms of farming in New Zealand; particularly dairy farming. The high density of grazing stock on dairy farms delivers more nutrients 6 to the land than other forms of farming.
Figure 9.5: Sources of nitrogen and phosphorus in agricultural catchments, 1985–2004

Local action for sustainable land management
Increasingly, farmers are taking collective action to achieve sustainable land use. Over 250 land-care or community-based groups have formed throughout the country to address local land-management issues. Projects these groups are working on include:
-
land and water monitoring
-
pest and weed control
-
revegetation and research into alternative land management techniques.
Many projects are worked on in partnership with local authorities and research agencies. Federated Farmers, farm discussion groups, and producer boards are also working on a variety of issues related to sustainable land care.
While some of these issues are significant to New Zealand as a whole, the decision rests with individual farmers as to how they respond to the challenge of changing to more sustainable land-use practices.
The nature and scale of land management issues vary from farm to farm. Some can be dealt with by an individual farmer using existing information. Other issues, for example, poor water quality, will require a partnership of some kind, such as neighbours working together, or a group of farmers working with a researcher and a local authority.
New Zealand Landcare Trust
The New Zealand Landcare Trust was established in 1996. Currently more than 250 landcare groups operate around New Zealand with the vision of promoting sustainable land management. Each group’s level of activity depends on the community in which they are based and the specific issues they are trying to address. Landcare groups are particularly active where regional councils have programmes for biodiversity protection and offer incentives or assistance to landholders.
New Zealand Farm Forestry Association
The New Zealand Farm Forestry Association (NZFFA) was formed in 1957. Membership is spread over 29 branches throughout New Zealand. NZFFA estimates their members own or manage up to 100,000 hectares of forest, and influence the management of a similar area. These forests consist of radiata pine, cypresses, eucalypts, douglas fir, blackwoods, poplars, and other hardwoods, as well as native species. Around 800 members will each harvest, on average, 12.7 hectares of plantation forest over the next five years. NZFFA provides a forum for members to share advice with one another on farm forestry.
Diversification of land use
The last decade has seen the diversification of many land-use activities in New Zealand. This diversification is particularly evident in the horticultural industry – changing land use to viticulture is just one example. In both 1997 and 2002, horticulture, including vineyards, orchards, and perennial crops, covered just under 1.6 per cent of our land. However, the area of vineyards grew by 28 per cent over the same period, illustrating the changing face of horticultural land. Horticultural land use has also diversified in other ways. Over the past 20 years, in response to niche market demand, certification schemes have enabled the development of organic land use, such as dairy, vegetable, and meat products.
Exotic forestry land use
The last decade has also seen a decrease in activity in the forestry sector resulting in reductions in new exotic forest plantings and replantings following harvesting. In April 2006, planted forests were estimated to cover 1.8 million hectares of New Zealand’s total land area (Ministry of Agriculture and Forestry, 2007a). Figure 9.6 shows the estimated total area of exotic forest land cover from 1990 to 2005. It illustrates that while the total land area in exotic forestry in New Zealand between 1991 and 2005 remained higher than that in 1990, the trend of increasing land area in exotic forestry peaked in 2003, and the total land area in exotic forestry has begun to decline since that time.
Over the past 10 years, greater diversification of land use has been evident in New Zealand.

Source: Courtesy of Devcich Design.

Exotic forestry land use is monitored for new plantings and for replantings of harvested plantations.
In the period 1992 to 1998, new area planting rates were high – averaging 69,000 hectares per year (Ministry of Agriculture and Forestry, 2007a). Since 1998, the rate of new forest plantings has declined. In 2005, only 5,000 hectares were planted – the lowest level since 1959 (Ministry of Agriculture and Forestry, 2007a). Figure 9.7 shows the change in the total area of new forest plantings from 1920 to 2005.

Figure 9.8 shows the trends in new plantings and replantings of exotic forestry between 1990 and 2005. The reduction in new plantings since the mid-1990s means that New Zealand’s land area in exotic (commercially planted) forest is no longer increasing (as shown in Figure 9.6). The maintenance of the current area of exotic forestry land will depend on replanting trends, that is, whether forestry land use is maintained after harvest.
Historically, most commercially planted forest was replanted after harvest. However, in 2004, a new trend of not replanting forest after harvesting started to become apparent. In a few cases immature forest has been converted to pasture. The 2006 National Exotic Forest Description survey indicates that approximately 12,900 hectares of forest (33 per cent of the total area harvested) will not be replanted after clear-felling (Ministry of Agriculture and Forestry, 2007a). This compares with a historical average of 2 to 5 per cent of exotic forests not being replanted after harvesting (Ministry of Agriculture and Forestry, 2007a).

If low replanting rates continue, New Zealand’s total exotic (production) forest land area will continue to decline. A reduction in total exotic forest land area will have implications for the sequestration of carbon dioxide, a greenhouse gas (see chapter 8, ‘Atmosphere’). It may also affect flood management, nutrients and soil health, soil erosion, and ecosystem processes related to the displacement of species living in exotic forest habitats. The impacts of deforestation on the environment will largely depend on the land use that is replacing forestry, how that land use is managed, and the management of the surrounding catchment.
Soil health
Seventeen per cent of New Zealand’s gross domestic product depends on the top 15 centimetres of our soil (Sustainable Land Use Research Inititative, no date). Soils underpin food and fibre production in New Zealand and protect our environment by:
-
acting as buffers and filters to reduce nutrient loss
-
limiting the need for irrigation
-
breaking down pollutants
-
regulating greenhouse gas emissions
-
acting as a fundamental part of the water cycle.
Monitoring under the 500 Soils Project (and subsequent regional council programmes) shows there have been changes over time to the health of New Zealand soils. Results of monitoring show:
-
widespread moderate compaction under pastures and some cropping land uses
-
a loss of organic matter and soil structural stability under cropping
-
nitrogen build-up under some dairy pastures, coupled with high levels of available phosphate (Sparling, 2007).
Table 9.6 shows the soil health variables used to assess the biological, chemical, and physical state of New Zealand’s soils nationally for seven major land-use types (arable cropping, mixed cropping, drystock pasture, dairy pasture, tussock grasslands, exotic forestry, and native forests) monitored across New Zealand’s 15 soil orders. Monitoring New Zealand’s soils by major land-use types and soil orders helps us to better understand how different soils respond to land-use pressures.
Table 9.6: Soil properties under the 500 Soils Project, arranged by land-use categories
View soil properties under the 500 Soils Project, arranged by land-use categories (large table).
Because pasture lands are so widespread in New Zealand, the condition of pasture soils has a major bearing on soil health nationally. Most declines in soil health are potentially reversible, but the shift towards more intensive farming practices in many regions around New Zealand may make a reversal difficult to achieve for some soils.
Chemical and biological soil health
Organic matter
As Table 9.6 shows, total organic carbon (a measure of soil organic matter) was lowest on cropping land and on tussock grasslands. Arable and mixed cropland soils often have lower organic matter than soils under pasture because the cropland soil is regularly cultivated.
On a national scale, horticulture in New Zealand, including vineyards, orchards, and perennial crops, covers 1.6 per cent of the total land area, compared with 24 per cent in Europe, making environmental effects from cropping in New Zealand comparatively localised.
Because tussock grassland grows on drier soils, they are naturally low in organic carbon. Drier soils build up organic matter very slowly because the growing conditions result in lower productivity.
Monitored pasture topsoils all had high levels of organic matter in the top 10 centimetres of the soil (total carbon, total nitrogen, and mineralisable nitrogen). This result was found to be similar or greater than organic matter levels under long-standing native vegetation. However, evidence in the soil profile down to 0.5 metres shows that over the past 25 years organic matter losses have occurred on intensively farmed pastures (Sparling, 2007).
Nitrogen and phosphorus
As Table 9.6 shows, both total nitrogen and mineralisable nitrogen were greater under pastures than under other land uses. While a supply of mineralised nitrogen is essential for pasture productivity, there is a risk that when supply exceeds demand (when saturation is reached) any excess soluble nitrogen can be leached from the soil and adversely affect water quality (see chapter 10, ‘Freshwater’). Excess soluble nitrogen is of particular concern given the high proportion of New Zealand land area in pasture.
The monitored dairy pastures and cropland soils exhibited high Olsen phosphate results (plant-available phosphate). This result reflects the regular application of superphosphate to New Zealand soils to stimulate the growth of introduced grasses, clovers, and arable crops.
Monitoring suggests continued soil compaction in pastures (macroporosity of less than 10 per cent) along with increased (possibly excess) levels of phosphate and nitrogen are likely to continue. Overall, results from soil health monitoring may indicate that storage of nitrogen in organic forms, particularly in dairy pasture topsoils, is nearing saturation point.
Acidity
Soil pH (acidity or alkalinity) under exotic forests was found to be similar to that under native forests. Other agricultural land uses exhibit higher pH values (that is, they are more alkaline). Higher pH values under agricultural land reflect the widespread topdressing of lime following the clearance of forest land cover and the change in land use to more intensive pastoral farming.
Physical soil health
Macroporosity
Moderate soil compaction (low macroporosity) was found on a large proportion of monitored pasture soils. Soil compaction is caused by farm animals treading on pastures, and vehicle traffic and cultivation on croplands.
Macroporosity below a 10 per cent threshold has been shown to adversely affect pasture production. About half the monitored sites under dairy land use were below this desirable threshold. Mixed cropping soils also had low macroporosity.
Maintaining healthy soils
Maintaining healthy soils is fundamental to sustainable land use. See box ‘More about maintaining healthy soils’, which outlines:
-
why healthy soils are important
-
what happens when soil health is compromised.
More about maintaining healthy soils
Soil forms a thin skin of mineral and organic matter on the earth’s surface and maintains the ecosystems on which we depend. The soil resource is non-renewable in a human lifespan (Doran et al, 1996). Monitoring soil health identifies whether soils are degraded and the factors that contribute to degraded soils. The results of this monitoring provide the opportunity to evaluate and redesign land management systems for sustainability.
Degraded soil can result from:
-
soil compaction
-
reduced organic matter
-
an imbalance in soil nutrient status
-
a mismatch between soil pH in relation to land use
-
changes to the biological, chemical, and physical characteristics of a particular soil order.
Soil compaction
Soil compaction reduces pasture growth and, when coupled with high-surface soil fertility (that is, high availability of soil nutrients), increases the risk of phosphates and nitrogen reaching streams and lakes through greater surface run-off.
Organic matter
The terms ‘soil organic matter’ and ‘soil organic carbon’ are used interchangeably. Total (organic) carbon is a measure of soil organic matter. When measured over time, the rate of soil organic matter turnover (total carbon content) provides information about soil health, for example:
-
the loss of soil biological activity (animal and plant communities in the soil such as worms and fungi)
-
soil nutrient depletion
-
changes in water infiltration and storage potential.
Soil nutrients
Soil nutrients are essential for plant growth and for maintaining soil health. Levels of nutrients may be affected by the excessive build-up of soil nutrients (from high stocking rates, imported feed high in nitrogen, or use of nitrogen fertiliser) or their removal. When excess nutrients are flushed through the soil by water flow, they can cause imbalances in the soil system or surrounding environment. For example, the excessive use of nitrogenous fertilisers may result in a build-up of nitrates in groundwater and rivers.
In the reverse situation, the mining of soil nutrients can also create a problem. Removing vegetation or animal products from the land can result in loss of soil nutrients. Cultivation and vegetation burn-off can also reduce soil fertility. Soil nutrients can be replaced by returning organic matter to the soil, using fertiliser, and using nitrogen-fixing pasture plants (such as clovers).
Soil acidity
Soil acidity is relevant to the nutrient management and biological function of soils. Soil acidification affects plant productivity. Acidification occurs naturally in soils but it can be accelerated by different land uses. For example, the application of fertilisers that contain ammonium or elemental sulphur can lead to acidification, as can the removal of soil nutrients (through cropping and nitrate leaching). Acidity can be manipulated with the addition of lime. In general, as soils become more acidic, their ability to support most kinds of vegetation is reduced.
Soil intactness of erosion-prone hill country
Soil intactness (the ability of soils to stay in place) on erosion-prone hill country is important for three main reasons.
-
Soil loss (through actions of water or wind erosion) accelerates sedimentation and nutrient run-off, and degrades water quality in adjacent or downstream water bodies.
-
Downstream erosion debris causes rivers to become filled in with silts and gravels, increasing the risk of flooding in heavy rainfall.
-
The gradual loss of topsoil affects the general health of the soil and reduces the fertility and productive capacity of the soil resource – the restoration of which may take hundreds of years (under natural conditions a centimetre of topsoil takes 100 to 400 years to build) (Doran, 1996).
Resource and policy managers are primarily concerned with soil erosion caused by human activity (induced erosion), rather than natural erosion processes. Soil erosion caused by human activity has been accelerated in many hill-country areas of New Zealand because of a mismatch between land cover and land use. Where pasture covers soft erodible soils, there is no appropriate vegetation to hold the soils in place.
Soil slip erosion on hill-country pasture.

Source: Ministry for the Environment.
Figures 9.9 and 9.10 show hill-country areas in pasture that are at risk of soil erosion. The measure of risk is based on information from the Land Cover Database and the Land-Use Capability survey classes from the New Zealand Land Resource Inventory (NZLRI). The NZLRI is a national database and inventory of land-use capability classes according to five major physical factors that control productive land uses: geology, soils, relief (slope), erosion potential, and vegetation cover.
Tussock grasslands (high-country sheep and beef areas) are not included in this analysis.
Erosion risk is classified by degree: severe, very severe, or extreme. This classification is based on:
-
soils and underlying geology – areas with yellow-brown earths situated on weakly consolidated mudstones and sandstones pose greater erosion risk
-
slope or altitude – areas with more than 21 degrees or that are 1,000 metres above sea level pose greater erosion risk
-
land cover – whether erosion-prone areas are in pasture or other more appropriate vegetation to hold the soils in place.
Figures 9.9 and 9.10 can be compared with Figures 9.1 and 9.2 (soil order maps), Table 9.1 (soil orders and land uses), and Figure 9.3 (land-use map identifying hill-country sheep and beef areas for 2004).
New Zealand’s geological and land-use histories have worsened hill-country erosion. See box ‘More about hill-country erosion and our geological history’.
More about hill-country erosion and our geological history
New Zealand’s land management problems are compounded by its unique geological history. Much of our land is mountainous and still undergoing uplift. Many land slopes are close to the maximum for pastoral farming. Thirty per cent of our land is hilly with a slope of more than 25 degrees (Sparling, 2007). Many areas are underlaid by soft, erodible materials. About 10 per cent of New Zealand is classed as severely erodible. The removal of native forest between the 1880s and 1920s for pastoral land use increased erosion rates.
All these factors mean that many parts of the country are prone to mass movement soil erosion (that is, extreme landslip, tunnel gully, gully, and earth-flow forms of soil erosion). The loss of soil through erosion, and transport by rivers to the sea, was estimated in 1996 to be 400 million tonnes a year (Ministry for the Environment, 1996).
Earth flows, soil slips, and gully formations seriously impair the viability and productivity of farms in erosion-prone areas. After hill-country slip erosion, for example, pasture production takes approximately 20 years to recover to within 70 to 80 per cent of its pre-erosion levels (Ministry for the Environment, 1996). Downstream, erosion debris causes rivers to become filled in with silts and gravels, with the consequential increased risk of flooding. Erosion can also contribute to water quality problems such as loss of aquatic habitat and increased sediment loads.
New Zealand’s soil erosion problem on the East Coast of the North Island is unique in that the magnitude of the problem is far greater than elsewhere in New Zealand. The Gisborne region comprises 7.8 per cent of the North Island and 26 per cent of the country’s severely erodible land. The impacts of erosion (flooding and sedimentation) in the Gisborne region are considered greater than in other areas of New Zealand, particularly for the southern part of the region, the Waipoa catchment.
Other regions that have erosion-prone hill country include Waikato, Bay of Plenty, Hawke’s Bay, Taranaki, Manawatū–Wanganui, Wellington, Tasman, and Marlborough.


Monitoring of erosion-prone hill country includes measuring changes in land cover from pastoral vegetation. Table 9.7 shows the satellite measurements of land-cover change for areas at risk of erosion in 1997 and how many hectares of pasture in these areas underwent a land-cover change by 2002.
While the percentage change from pasture is small, the results do show a reduction of just over 36,000 hectares nationally between the two periods of land-cover monitoring. Just over half of this total was in the Gisborne, Hawke’s Bay, and Manawatū–Wanganui regions (17,481 hectares in total). In the South Island, the Marlborough and Tasman regions experienced a combined pastoral land-cover change of 4,119 hectares.
LCDB analysis shows that of the 36,400-hectare reduction in pasture on erosion-prone hill country, 36,300 hectares were converted to exotic forestry or retired and left to revert to scrub.
The changes in the land area under pastoral land cover highlight efforts to replace pasture with more stabilising vegetation on erosion-prone hill country. For example, planting bare land in trees has a noticeable impact on erosion rates. In four to five years, the tree roots will have intertwined, the tree foliage will intercept the strike of heavy rainfall, and the soil will begin to be protected. This process is complete when the tree canopy closes.
A number of programmes and initiatives have been set up to help promote sustainable land management, including afforestation of hill-country pasture on erosion-prone land. See box ‘Government action on sustainable land management’.
Table 9.7: Area (in hectares) of pasture on hill-country erosion-prone land by region between 1997 (LCDB 1) and 2002 (LCDB 2)
Government action on sustainable land management
Plan of Action for Sustainable Land Management and Climate Change
In 2006, a discussion document, Sustainable Land Management and Climate Change: Options for a Plan of Action, was released for public consultation. $170 million has been committed between 2007–2012 to develop and deliver the plan of action, which includes:
-
A five-year adaptation programme that will help the land management sector build the capability to address the risks and opportunities from climate change. As part of this programme a $5.7 million community irrigation fund will be established to help rural communities adapt to increasing drought risk.
-
A range of complementary measures to the Emissions Trading Scheme, including the establishment of farm-scale greenhouse gas monitoring and reporting, and a $50 million Afforestation Grant Scheme that allows landowners who elect not to enter the Emissions Trading Scheme to realise the climate change benefits of afforestation.
-
A five-year work programme aimed at addressing barriers that hinder the private sector capitalising on climate change opportunities. This includes the development of a greenhouse gas footprint response for the primary sector and reviewing market opportunities such as the creation of markets for emission-reducing technologies.
-
A strategic framework for research and technology to underpin the plan of action and coordinate the investment of $10 million per annum by 2010 in new research funding to better enable the agricultural and forestry sectors to reduce their emissions and adapt to climate change This will build on the work of the Pastoral Greenhouse Gas Research Consortium discussed in Chapter 8, ‘Atmosphere’.
-
A Technology Transfer work programme to enhance the ability of the sector to quickly roll out and adapt to new technology.
Sustainable Land Management Programme
The Ministry of Agriculture and Forestry leads government initiatives to achieve sustainable land management. The Ministry’s Sustainable Land Management Programme:
-
makes sound science and good information available to support land-management decisions
-
provides regulatory support through various local and national regulatory tools
-
helps establish partnerships for long-term sustainable land-use solutions
-
builds knowledge and capacity in both central and local government.
As part of this programme, the Ministry of Agriculture and Forestry has completed a Sustainable Land Management Framework. The framework guides:
-
government funding for local sustainable land management
-
assessment of the quality and effectiveness of initiatives under the Sustainable Land Management Fund.
Sustainable Land Management Fund
The Sustainable Land Management Fund supports local projects to achieve sustainable land management. A water and soil section of this fund is aimed specifically at reducing non-point-source water pollution (pollution that does not have a single source of origin) from land use. The funding includes working with hill-country farmers to manage erosion and encourage afforestation of erosion-prone land to reduce sediment flows and protect communities in lower catchment areas.
East Coast Forestry Project
The East Coast Forestry Project was established in 1992 to plant 200,000 hectares of commercial forest over 28 years on erosion-prone land on the East Coast of the North Island. In late 1999, the project changed its focus to target the worst 60,000 hectares of severely eroding land.
To date, approximately 32,000 hectares of erosion-prone land have been planted and a further 5,000 hectares have been approved for planting in the near future. The project offers grants to land owners towards the cost of establishing and managing planted forest areas on erosion-prone land. The project has an annual budget of $6.5 million (Ministry of Agriculture and Forestry, no date).
Contaminated land
Inappropriate storage and use of hazardous substances, and disposal of hazardous wastes, can contaminate the environment. Contamination is not always limited to a specific site (see chapter 6, ‘Waste’).
Hazardous substances may:
-
seep through the soil into groundwater
-
be carried to nearby land and waterways in rainwater or as small dust-like particles
-
pollute our air.
Industrial, domestic, and rural activities have all contributed to contaminated land in New Zealand. However, as our economy relies on primary production to a larger degree than most of our OECD counterparts, many of our contaminated sites are due to historical agricultural, horticultural, and silvicultural practices. In particular, contaminated sites have often resulted from past:
-
manufacture and use of pesticides and fertilisers
-
production of coal and gas
-
mining
-
timber treatment
-
sheep dipping.
Many of these activities were not known to be hazardous in the past. For example, using DDT in sheep dips and insecticides was a common activity from the 1940s to the 1960s, undertaken without protective clothing or other protective apparatus.
To date, most of the effort to identify, manage, and clean up contaminated sites has focused on urban and rural sites contaminated by activities and industries on the Hazardous Activities and Industries List (HAIL). The HAIL sets out activities and industries that are considered likely to cause contamination from hazardous substance use, storage, or disposal.
Local authorities use the HAIL to systematically identify potentially contaminated sites. Further investigation of an individual site is needed to determine whether the site is in fact contaminated land. To date, only a small proportion of HAIL sites have undergone sufficient investigation to determine whether or not they are contaminated.
Local authorities use a national risk screening system to set priorities for investigating potentially contaminated sites. Using readily available information, the risk screening system ranks potentially contaminated sites according to a standard set of criteria.
A total of 4,424 sites have now been screened across the country. Of the 559 high-risk sites that have been identified, 56 per cent have been cleaned up or have a programme in place to either clean up or manage the contamination (Ministry for the Environment, 2007b).
The Resource Management Act 1991 is the core piece of environmental legislation for controlling the effects of contaminated land on the environment and people. See the box ‘Resource Management Act 1991 and contaminated land’.
Resource Management Act 1991 and contaminated land
In 2005, the Resource Management Act 1991 was updated to include a definition of contaminated land. This definition is wider in scope than that implicit under the Hazardous Activities and Industries List. Local authorities will be reviewing their processes to reflect this new definition.
The Resource Management Amendment Act 2005 also clarified the roles and responsibilities of:
-
regional councils in investigating, identifying, and monitoring contamination
-
territorial authorities in preventing or mitigating the effects of the development, subdivision, or use of contaminated land.
Managing the health and environmental effects of developing, subdividing, or using contaminated land is especially important. Our growing population and increasing urban development have accelerated changes in land use at the perimeters of built-up areas. This growth in residential areas has led to increased development and subdivision of former agricultural or industrial land, some of which may be contaminated.
The Building Act 2004 and the Local Government Official Information and Meetings Act 1987 also help the public access information about contaminated land. For example, under the Local Government Official Information and Meetings Act, territorial authorities must include information about the likely presence of hazardous contaminants on land information memoranda (LIM reports).
The identification of contaminated sites in New Zealand has proven to be a challenge even with tools such as the HAIL, the risk screening system, and the new definition and provisions under the Resource Management Act 1991.
Significant resources are needed to confirm the determination of contaminated sites from potentially contaminated sites. In the 1990s, the number of contaminated sites in New Zealand was estimated at between 7,000 and 8,000 (Worley Consultants Ltd, 1992). About 1,500 of these were deemed to be high risk to human health or the environment (Organisation for Economic Co-operation and Development, 2007). However, there are now thought to be over 50,000 contaminated sheep-dip sites alone (Ministry for the Environment, 2006).
There are presently no standards that set maximum levels for contaminants in soil to determine whether or not a site is contaminated. Local authorities may therefore interpret the definition of contaminated land differently and apply different maximum thresholds for levels of contamination.
Land owners and tenants are not presently required to report contaminated sites to local authorities. For example, former sheep-dip sites can be difficult to locate, and knowledge of these sites may be lost when original land owners sell their land or retire.
In the past, assessments of contaminated sites were not carried out to a consistent standard. Some sites may not have been correctly identified as being contaminated and the extent of contamination may be unknown.
Contaminated sites by region
Ten regions in New Zealand have self-reported on contaminated sites. Table 9.8 shows the total number of sites reported as contaminated, and the number of reported sites which have been confirmed as contaminated, cleaned up, or managed.
To date, 1,238 sites have been reported as contaminated. Most of these sites are likely to be industrial sites (that is, contaminated sites under the HAIL), rather than sites that come under the Resource Management Amendment Act 2005 definition of contaminated land. Of these sites, 545 have been cleaned up, and 301 are being managed to make sure they do not significantly affect the environment. The remaining 392 sites have not yet been dealt with.
The figures show that most reported contaminated sites are in more populated regions with high industrial and agricultural activity:
-
Auckland (368)
-
Waikato (258)
-
Wellington (149)
-
Canterbury (134).
The greatest numbers of confirmed contaminated sites yet to be dealt with are also in more populated regions:
-
Waikato (118)
-
Auckland (93)
-
Wellington (77).
Some of the contaminated sites listed in Table 9.8 are likely to have been caused by leaking underground tanks used to store petroleum products. The petroleum industry has largely taken responsibility for cleaning up or managing these sites (Environment Canterbury, pers comm, May 2007).
Table 9.8: Self-reported information on contaminated sites in 10 regions, 2006–2007
View self-reported information on contaminated sites in 10 regions, 2006–2007 (large table).
Up until now, most cleaning up of contaminated sites has been done voluntarily by site owners. It is difficult to establish who is liable for clean-up costs because most land contamination occurred before the Resource Management Act 1991, and potentially liable companies may no longer exist (Organisation for Economic Co-operation and Development, 2007). It can also be difficult to establish liability for contamination from unregulated activities since 1991, such as illegal discharges of chemicals into waterways.
Some types of land contamination have been addressed through changes in policy or regulation. See box ‘Removal of lead from petrol’.
Removal of lead from petrol
The past use of lead additives in petrol caused high concentrations of lead in urban air. Vehicle emissions during this time also caused widespread accumulation of lead in urban soils. Land closest to busy roads and intersections received the most lead. Most urban gardens in New Zealand show elevated levels of lead from vehicle emissions, although usually not enough to meet the Resource Management Act 1991 definition of contaminated land. For example, in the 1990s, the average lead concentration in a sample of 80 front-lawn soils in Hamilton was found to be about 75 milligrams per kilogram of lawn soil or five times the natural concentration (Environment Waikato, pers comm). This source of land contamination was eliminated in 1996 when leaded petrol was prohibited.
Several tools have been developed to help identify, manage, and clean up contaminated sites in New Zealand. These include guidelines, funds to assist local government, and tax deductions for business-related costs.
Central government guidelines have been established for identifying, assessing, and managing contaminated sites. These guidelines illustrate and promote best practice in:
-
reporting
-
risk screening
-
classifying sites
-
investigating sites
-
analysing soils.
Industry-based guidelines have been developed for hazardous substances in soil, water, and air. These guidelines establish best practice, recommend safe levels, and protect health and the environment in:
-
timber-treatment chemicals
-
gasworks sites
-
petroleum industry sites
-
sheep-dip sites
-
application of biosolids (sewage sludges or sewage sludges mixed with other materials) onto land.
The Contaminated Sites Remediation Fund (CSRF) was established in 2003 to help local government investigate and clean up contaminated sites. Over $10 million has been awarded to 33 projects since the fund was established. CSRF’s funding has been increased to $3.7 million per year for 2006 to 2009.
The Income Tax Act 2004 provides for tax deductions for business expenditure related to cleaning up and managing contaminated land.
Local clean-ups
Local government, industry, and community groups are all involved in contaminated site investigations and clean-up work. Examples of local projects include:
-
investigating agricultural land potentially contaminated by pesticide use (including sheep-dip sites)
-
cleaning up old gasworks and landfill sites
-
investigating and cleaning up timber treatment and wood-waste disposal sites
-
cleaning up former petrol station sites.
Companies involved in oil and petroleum, timber treatment and processing, and property development are particularly active in managing contaminated sites.
The former Tui mine near Te Aroha in the Waikato is about to be cleaned up. Heavy metals seeping from the old mine shafts, tailings, and dumps have affected the water quality of two streams that flow into the Waihou River. The tailings dam is also at risk of collapse. Environment Waikato, Matamata–Piako District Council, and the Ministry for the Environment are working in partnership to clean up the site by 2010. This project was allocated $9.88 million in the 2007 Budget.
The abandoned Fruitgrowers Chemical Company site at Mapua, near Nelson, was heavily contaminated by a range of toxic pesticides such as DDT, aldrin, lindane, and dieldrin. Central government and the local council, working in partnership, provided $8 million to clean up the site.
By August 2007, all known contaminated soil had been treated on-site, and decommissioning of the plant had begun. The project is on target to be completed in late 2007, when the land will be handed back to its owners, Tasman District Council. About 40 per cent of the land is to be set aside as public space, and the rest is designated residential and commercial.
Aerial view of the abandoned Fruitgrowers Chemical Company site at Mapua.

Source: Courtesy of John Roosen.
6 Dairy cows excrete almost seven times the amount of nitrogen and phosphorus in their faeces and urine as do breeding ewes, and around three-and-a-half times that of breeding hinds (Environment Southland, 2000).
Current state and trends
September 2007
© Ministry for the Environment