Freshwater in New Zealand
Water is essential to New Zealand’s social, cultural, and economic well-being. It is also a focal point for recreational activities and our outdoor-focused way of life. New Zealand has 425,000 kilometres of rivers and streams, almost 4,000 lakes that are larger than 1 hectare, and about 200 aquifers.
By international standards, freshwater in New Zealand is both clean and plentiful in supply. However, demand for water is increasing. At the same time, some aspects of water quality are getting worse in areas that are dominated by intensive land use.
River and lake water quality
Land-use impacts on river water quality
Rivers in catchments that have little or no farming or urban development make up about half of the total length of New Zealand’s rivers and have good water quality. Water quality is generally poorest in rivers and streams in urban and farmed catchments. This reflects the impact of non-point-sources of pollution in these catchments, that is, pollution that does not have a single identified point of origin, such as urban stormwater, animal effluent, or fertiliser run-off. The proportion of the total river length that is in farmed catchments is more than 40 times the proportion that is in urban catchments.
Nutrients in rivers
While the levels of nutrients (which, in excessive amounts, reduce water quality) in our most polluted rivers are only about half the average for all rivers reported by countries to the Organisation for Economic Co-operation and Development (OECD), nitrogen and phosphorus levels have increased over the past two decades. Nitrogen levels have increased most rapidly in rivers that are already nutrient-enriched.
Point-source pollution of rivers
Pollution from organic waste in rivers has reduced since the late 1980s. This indicates improved management of point-source discharges of organic waste, that is, pollution from a single facility at a known location, such as discharges from wastewater treatment plants, meatworks, and farm effluent ponds.
Nutrients in lakes
Two-thirds of New Zealand’s lakes are in natural or partially developed catchments, such as native bush, and are likely to have good to excellent water quality. Small, shallow lakes surrounded by farmland have the poorest water quality of all our lakes.
Water quality at swimming spots
Over the 2006–2007 summer, 60 per cent of the swimming spots on rivers and lakes that were monitored had low levels of bacteria, indicating that these sites have good water quality and are suitable for swimming. Ten per cent of the monitored swimming spots frequently had levels of high bacteria, indicating that they are generally unsuitable for swimming. Bacteria levels appear to have improved in our recreational waters over the past few years.
Groundwater quality
Sixty-one per cent of the groundwaters in New Zealand that are monitored have normal nitrate levels; the remainder have nitrate levels that are higher than the natural background levels, and 5 per cent have nitrate levels that make the water unsafe for infants to drink. Twenty per cent of monitored groundwaters have bacteria levels that make the water unsafe to drink. High levels of nitrates and bacteria are particularly common in shallow, unconfined aquifers. These aquifers are the most vulnerable to pollution from land-use activities, such as farming and urban development.
Freshwater demand
Abundance of freshwater
Because New Zealand has a low population and high average rainfall, it has more total freshwater per person than more than 90 per cent of almost 200 other countries around the world. However, not all of this water is in the right place at the right time; some areas experience a surplus or shortage of water.
Demand and allocation
It is estimated that total water use in New Zealand currently equates to two to three times more water per person than in most other OECD countries. Demand for water is increasing, particularly in areas that are already short of water. Drier parts of the country have the highest demand. For example, Canterbury accounts for over half of all water allocated in New Zealand; that is, the amount of water that is permitted to be used. Several eastern regions, including Canterbury and Ōtago, have surface water catchments that are highly allocated, so come under pressure during drier times of the year.
The allocation of water in New Zealand increased by 50 per cent between 1999 and 2006. This is mainly a result of an increase in the area of irrigated land. Irrigation now uses almost 80 per cent of all water allocated.
Present and future management
Because pollution of freshwater from point-source discharges is now largely controlled under the Resource Management Act 1991, attention of resource managers has turned to reducing non-point-source pollution from intensive land use. As a result, there is greater emphasis than in the past on managing intensively used land through stream-bank (riparian) planting, nutrient management, and excluding stock from waterways using bridging and fencing.
Water allocation and pollution caused by intensive rural and urban land use will continue to be the focus of freshwater management in New Zealand. Balancing the competing needs of water users – recreational users, town water suppliers, hydro-electricity generators, tourist operators, and farmers – is likely to become increasingly important.
New Zealand has 425,000 kilometres of rivers and streams, almost 4,000 lakes that are larger than 1 hectare (Ministry for the Environment, 2006c), and about 200 groundwater bodies (aquifers) (White, 2001).
Freshwater is among our most valuable natural assets. New Zealand’s rivers, streams, and lakes are a focal point of our national identity and outdoor way of life. They are highly valued for recreational activities such as swimming, boating, and fi shing, and are the centrepiece of some of the country’s best-known tourist destinations.
Clean and plentiful water provides us with a safe drinking supply, and also sustains the natural ecosystems that are home to many of New Zealand’s native species.
In addition, freshwater is a vital part of the New Zealand economy: it is used to irrigate crops and pastures, dispose of or dilute trade wastes and sewage, and produce hydro-electric energy (see chapter 5, ‘Energy’).
Water is also a fundamental taonga (treasure) for Māori. Waterways are considered the arteries of Papatūānuku (Mother Earth) (Ministry for the Environment, 2005b). Māori have cultural, historical, and spiritual links with many of the country’s springs, wetlands, rivers, hot pools, and lakes. They also value having healthy water bodies for mahinga kai (customary food and resource gathering).
By international standards, freshwater in New Zealand is both abundant and clean. Rainfall, which is the source of replenishment for our streams, rivers, lakes, and groundwater, is generally plentiful. With a population of just over 4 million and limited heavy industry, New Zealand’s human pressures on freshwater are relatively light compared with the pressures on such resources in many other developed countries.
However, protecting the country’s freshwaters is a growing challenge. With land-use practices becoming more intensive, particularly in farming, there is greater demand for water now than ever before, and evidence is building that its quality is declining in many water bodies.
Freshwater environments of New Zealand
New Zealand is a narrow, mountainous country characterised by relatively small catchments and fast-flowing rivers and streams. Half of its 425,000 kilometres of rivers and streams are small headwater streams.
Of New Zealand’s total length of rivers and streams, 51 per cent lies in catchments with predominantly natural land cover, such as native bush or alpine rock and tussock. The remaining 49 per cent of river length is in catchments that have been modified by agriculture (43 per cent), plantation forestry (5 per cent), or urban settlement (1 per cent).
New Zealand has 3,820 lakes that are larger than 1 hectare. Of these, 229 have an area greater than 50 hectares (Ministry for the Environment, 2006b). About 40 per cent of all lakes are in catchments in which the predominant land cover is pasture. Less than 2 per cent of lakes are in towns and cities (Ministry for the Environment, in press c).
The underground areas in which groundwater collects are known as aquifers. In New Zealand, the largest aquifers are porous gravels. Examples include the Heretaunga Plains in Hawke’s Bay and the Wairarapa, Manawatū, Canterbury, and Southland Plains. Other forms of aquifer include the fractured basalts of the Auckland region and the Coromandel Peninsula’s coastal sand aquifers.
Natural factors that affect freshwater
Three main natural factors influence the quantity and quality of freshwater in New Zealand: climate, topography, and geology.
Rainfall patterns vary across the country and between seasons. Generally, rainfall is much higher on the western side of both the North and South Islands, because the prevailing westerly winds pass over mountains that form the backbone of much of the country.
Rainfall is also higher in the winter than in the summer. This seasonal variation is more extreme on the east coast of both main islands, where summers are relatively dry, compared with on the west coast. Not only does rainfall control the amount of water that flows in rivers and aquifers, it can also affect water quality by carrying pollutants from the surface of the land to water bodies. The pattern of rainfall in New Zealand is expected to change in the future; the anticipated effects on freshwater quantity and quality are summarised in the box ‘More about climate change and freshwater’.
More about climate change and freshwater
Current research suggests that New Zealand will experience changes in the frequency of droughts, rainfall patterns, and evaporation rates, which are likely to change water flows and worsen existing problems with water availability. Irrigation needs will increase in the east of both main islands, where pressure on available water resources is already significant. At the same time, water quality is likely to deteriorate in some areas because of lower flows in rivers and streams. Algal blooms may occur more frequently because of higher water temperatures.
The shape and geology of New Zealand’s catchments also strongly influence water quality. Catchments that are steep-sided (such as those in mountainous regions) or made up of soft sediments are more prone to natural erosion. As a result, rivers draining from these catchments may carry high levels of sediment.
The type of rock and soil the water moves past and the time over which this interaction takes place also determine the characteristics of our freshwater. For example, groundwaters moving through volcanic rocks or geothermal areas are more likely to contain higher concentrations of minerals (such as sulphates and/or chloride) and metals (such as arsenic) than are fast-moving river waters.
Human factors that affect freshwater
The main pressures on freshwater quantity and quality are the growing demand for water to meet society’s various needs and pollution resulting from human activities on land.
Water quantity
Demand for freshwater resources is increasing as New Zealand’s population grows and more intensive forms of land use, particularly farming, become increasingly widespread. This is especially noticeable in drier regions, such as Canterbury, where relatively high volumes of water are needed to irrigate pasture.
Damming and diverting water to meet needs for power generation, irrigation storage, and human consumption can deplete flows in rivers and reduce groundwater levels. As well as having effects on water quality (described below), flow depletion can lead to insufficient water being available to meet the needs of downstream users.
Draining land to improve farming productivity or enable urban development also reduces the size of water bodies. The Waikato region’s shallow peat lakes are examples of lakes that have shrunk in size and number as the surrounding farmland has been drained.
Water quality
Figure 10.1 summarises the main sources of pollution in rivers, lakes, and groundwater. These are identified as point-sources and non-point-sources. Point-sources refer to discharges of pollutants from a single facility at a known location (for example, a wastewater treatment plant). Non-point-source pollutants do not have a single point of origin (for example, they may include pollutants that have run off wide areas of disturbed or developed land after rainfall).
Figure 10.1: Common Sources of Freshwater Pollution
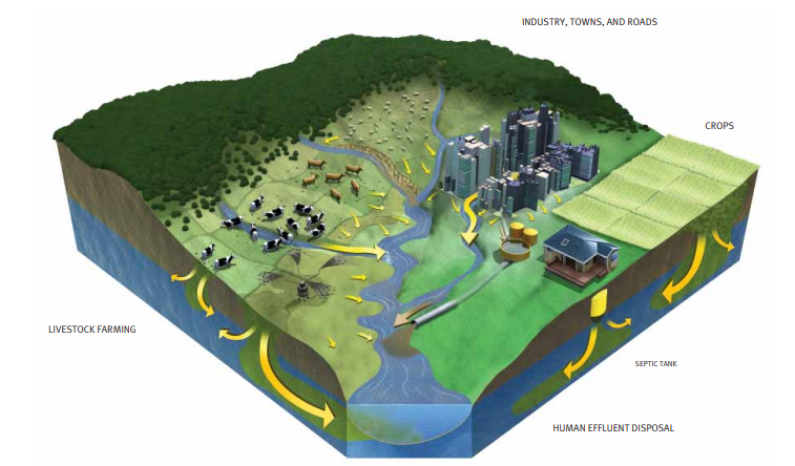
Image: Source: Ministry for the Environment.

Image: Source: Ministry for the Environment.
Point-source and non-point-source pollution
Until the 1970s, the major cause of deterioration in water quality in New Zealand was the discharge of poorly treated sewage, stock effluent, and other wastes from primary production and industry directly into water bodies. These discharges came from both urban and rural point-sources. However, stricter controls on discharge practices were introduced with the Water and Soil Conservation Act 1967 and the Resource Management Act 1991. Wastewater treatment systems have been upgraded and there has been a continuing trend towards applying effluent to land, rather than discharging it into waterways (see Figure 10.2). Pollution from point-sources has declined significantly as a result of these measures.
Figure 10.2: consents for effluent discharges to water, 1995 and 2005, by source

Image: Note: These percentages are averaged from resource consent data provided by regional councils and unitary authorities in Auckland, Hawke’s Bay, Manawatü–Wanganui, Wellington, and Marlborough. Data source: Ministry for the Environment.
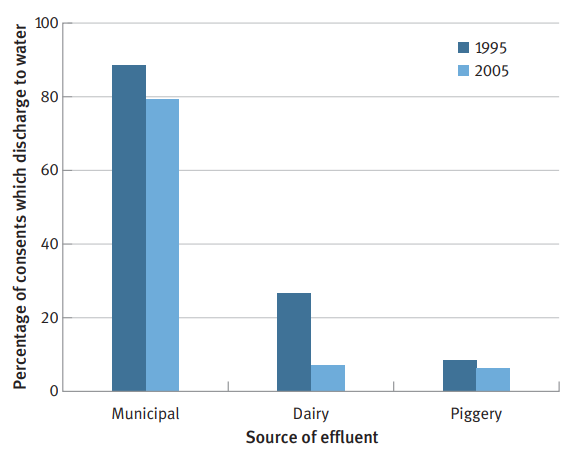
Image: Note: These percentages are averaged from resource consent data provided by regional councils and unitary authorities in Auckland, Hawke’s Bay, Manawatü–Wanganui, Wellington, and Marlborough. Data source: Ministry for the Environment.
While sewage and wastewater discharges from point-sources are still a significant influence on water quality in some areas, the effects of non-point-sources of pollution on streams, rivers, and lakes have been identified as the most serious freshwater management challenge in New Zealand today (Hill Young Cooper, 2006).
Urban land use
Urban land use affects the quality of our freshwater; 86 per cent of people live in towns and cities and produce large amounts of different types of pollution. The most significant source of bacteria and nutrients (nitrogen and phosphorus) in urban streams is human wastewater and sewage leaking from broken sewer pipes, or being discharged into stormwater systems through faulty connections. In addition, run-off to streams from paved surfaces, gardens, and disturbed land commonly has high levels of sediments (see the photo opposite) and can contain pollutants, including bacteria from animal faecal matter, herbicides, pesticides, detergents, and other household chemicals.
Run-off from busy roads carries pollutants such as metals (particularly zinc, copper, and lead), and hydrocarbons. (These pollutants come from the road itself, through asphalt wear, and from vehicles using the road, through exhaust emissions, brake linings, and tyre wear.)
Agricultural land use
As the dominant land use in New Zealand, agriculture has the most widespread impact on water quality. Agricultural pasture makes up almost 40 per cent of New Zealand’s total land area and occupies about four times the area of planted forestry and all other modified types of land cover combined (that is, horticultural, viticultural, industrial, and other urban land uses). (See chapter 9, ‘Land’.)
In recent years, the impact of agricultural land use on water quality has grown as a result of increased stocking rates and use of nitrogen fertilisers. Within the agricultural sector, there has also been a move away from low-intensity to high-intensity land use (for example, converting from sheep farming to dairy or deer farming). The net effect of most intensifi ed land use is to increase the amount of nutrients, sediment, and animal effluent dispersed into water bodies (Davies-Colley et al, 2003).

Image: Source: Courtesy of Greater Wellington Regional Council.
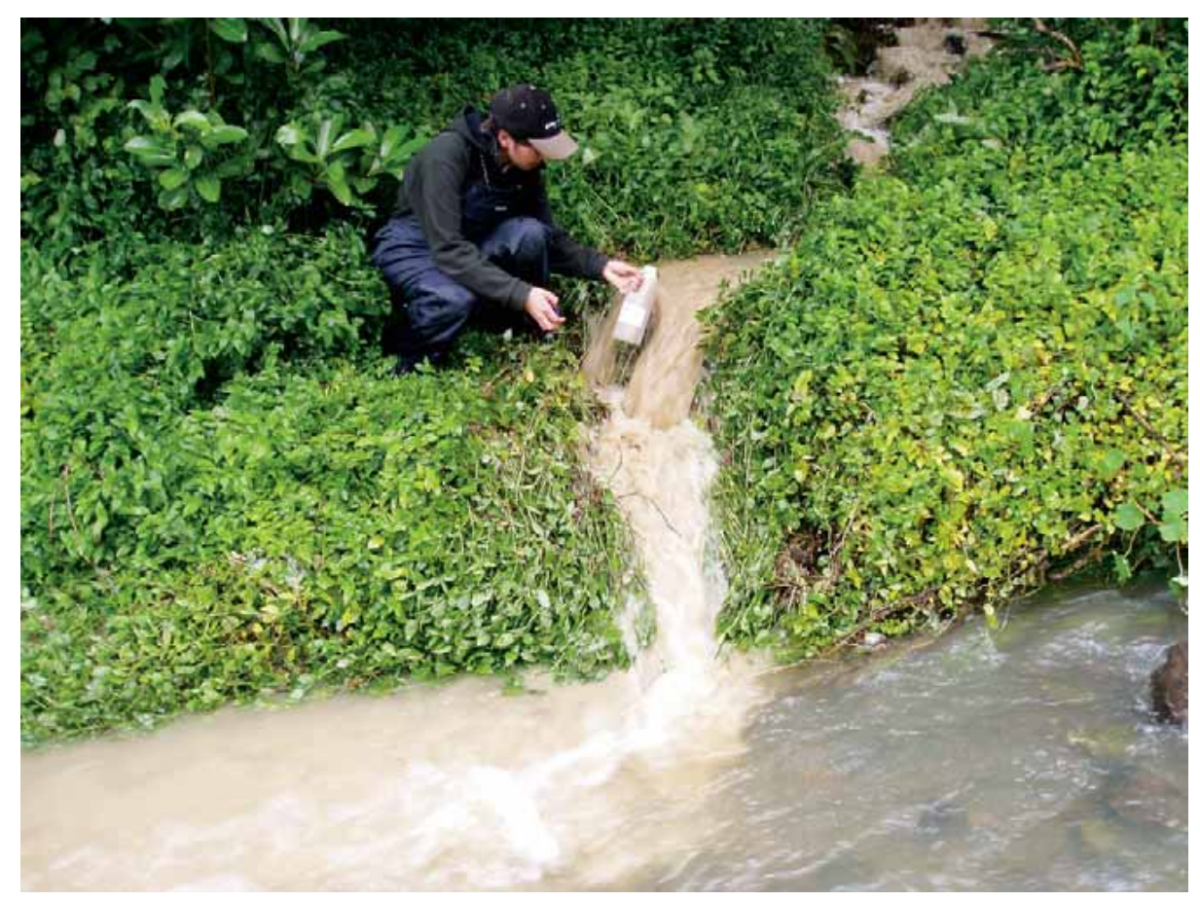
Image: Source: Courtesy of Greater Wellington Regional Council.
Horticultural and arable land use
Horticultural and arable land use occupies a small proportion of New Zealand land (less than 2 per cent of total land area) compared with the land occupied by agricultural farming. Most of the land producing arable, vegetable, and fruit crops in New Zealand has flat to gently rolling terrain. As a result, the surface run-off is low. However, nutrients (from fertiliser application) and herbicides and pesticides leaching through soils may still pollute freshwater in some areas (particularly those where market gardening is common).
Plantation forestry and other forms of land use
The pressure on freshwaters from plantation forestry is comparatively low. Nutrient yields from plantation forestry are very similar to those from native forest (Davies-Colley et al, 2003). However, when forest is being harvested, the sediment dispersed to waterways, particularly from roadways and landings, can increase.
Other forms of land use can affect water quality. As noted earlier under ‘Water quality’, the damming of rivers can change a river’s natural flow and cause increased sedimentation, higher water temperatures, and reduced oxygen concentrations. Algae and other nuisance plants may proliferate downstream from dams because the high flows that regularly flush the river system have been reduced.
See chapter 1, ‘Environmental reporting’ for more information on the core national environmental indicators and how they are used.
There are two national environmental indicators for freshwater.
The first provides information on water quality in rivers, lakes, and groundwater aquifers. This indicator is reported using the following measurements:
- concentrations of nutrients (nitrogen and phosphorus in rivers and lakes, and nitrate in groundwater)
- concentrations of the bacterium Escherichia coli (E. coli) in rivers and lakes, including freshwater swimming spots
- visual clarity in rivers and lakes
- water temperature in rivers
- dissolved oxygen in rivers
- richness of macroinvertebrate species (%EPT) in rivers.
The second freshwater indicator provides information on freshwater demand. This indicator is reported using the following measurement:
- volume of water allocated to human uses. This is also known as total (consumptive) water allocation.
Understanding how these indicators change over time will allow us to improve our response to existing and emerging pressures on New Zealand’s water resources.
In addition to the measurements listed above, further measurements of freshwater quality in this chapter include:
- organic pollution of rivers (as shown by measurements of biochemical oxygen demand)
- salinity and concentrations of metals (iron, manganese, and arsenic) and chemicals (sodium, sulphate, and chloride) in groundwater.
Freshwater quality
Concentrations of nutrients
Aquatic plants need many types of nutrients for growth, including nitrogen and phosphorus. (This includes the dissolved forms of nitrogen (nitrate) and phosphorus (dissolved reactive phosphorus)). However, increased levels of these nutrients in water bodies cause plant growth rates to increase excessively, especially if water flows, sunlight, and temperature conditions are favourable to them. This can lead to algal blooms, as well as an over-abundance of aquatic weeds in river channels and on lake margins. Excessive algal or weed growth can reduce the recreational and aesthetic value of water bodies, and alter water quality (for example, by changing the acidity or oxygen levels).
Fertilisers and stock effluent are major sources of the nitrogen and phosphorus in water bodies in agricultural catchments. The erosion of soil also contributes significant amounts of soil-bound phosphorus to waterways.
Concentrations of bacteria
E. coli is a bacterium that indicates the presence of faecal material in freshwater. This, in turn, indicates the presence of disease-causing (pathogenic) micro-organisms caused by discharges of treated human sewage (from wastewater plants, septic tanks, or faulty sewerage systems) and dung from birds and animals.
A high concentration of E. coli indicates an increased risk of digestive and respiratory system diseases among people who come into contact with, or drink, the contaminated water. Very young children, the elderly, or people with impaired immune systems are particularly vulnerable to this risk. The health of livestock that drink contaminated water may also be affected.
Visual clarity
Visual clarity refers to how far you can see through the water in rivers and lakes. It provides an indication of the levels of suspended sediment: high clarity indicates low levels of suspended sediment.
Rivers and lakes with high clarity appear clean and are often highly valued for fi shing and other recreation. A river or lake with low clarity will have murky water, which may indicate significant erosion in the catchment (producing suspended sediment) or abundant algal growth in the water. Murky water prevents sunlight penetrating, while sediment can smother aquatic habitats, which affects the feeding and spawning habits of fish and other animals, and the growth rates of plants.
Visual clarity is reported on its own as an indicator for rivers. However, it is combined with measurements of nutrients and algae (to form a Trophic Level Index) to indicate the water quality of lakes (see box ‘What is the Trophic Level Index?’ in the ‘Current state and trends’ section of this chapter).
Water temperature
If water temperatures increase beyond their usual ranges for too long, plants and animals in waterways can become stressed and die. (Low elevation streams and rivers in New Zealand typically have a water temperature that fluctuates within the range 10–20˚C across seasons. Alpine or spring-fed streams and rivers can be much colder, and the water temperature in un-shaded shallow streams may rise to nearly 30˚C in the peak of summer.) Temperature changes can be caused by changes in climate, or by human activities such as removing stream-bank vegetation, storing water in dams, or discharging heated or cooled water after it has been used in industrial processes (for example, in power generation). Taking too much water from a river or stream (referred to as ‘over-abstraction’) can also increase its temperature.
Dissolved oxygen
Dissolved oxygen is an indicator of the health of freshwater ecosystems. Fish and other aquatic life require dissolved oxygen to breathe. When dissolved oxygen levels are depleted, aquatic animals can become stressed and die. Oxygen depletion is commonly caused by organic pollutants breaking down in waterways, elevated water temperatures, or night-time respiration by dense algal blooms in nutrient-rich waters.
Macroinvertebrate richness (%EPT)
Freshwater macroinvertebrates are aquatic animals such as insects, worms, and snails. Sampling both the type of macroinvertebrate taxa (that is, groups of similar individuals) present in a waterway, and the population of each of these taxa provides an indication of overall river or stream health and water quality.
Some macroinvertebrates are particularly sensitive to pollution, so are good indicators of water quality degradation that has been caused by human activity. In particular, Ephemeroptera, Plecoptera, and Trichoptera taxa together form a measurement called ‘%EPT’. Low %EPT indicates a river or stream is under pollution stress.
Freshwater demand
Allocation of water to consumptive uses
Regional councils are responsible for granting resource consents in New Zealand. These consents are generally required before surface water or groundwater may be removed for irrigation, drinking water supply, industrial and manufacturing works, and other activities. Smaller volumes of water, such as for low-level home supply, can also be allocated through permitted activity rules under councils’ regional plans.
The consent process, which is generally set up through regional plans, is also known as ‘the allocation of freshwater’. It can determine both the maximum volume of water that may be taken, and the maximum rate at which water may be taken.
The allocation indicator in this report assesses consumptive water use only (that is, water that is taken from a river, lake, or aquifer, and not returned directly to that source). Allocation of water for hydro-electric power generation is not a consumptive use, although hydro-electric schemes can significantly alter the pattern of water flow in rivers and lakes.
Limitations of the indicators
While the indicators for freshwater provide an overview of the quality and level of allocation in New Zealand, they do not provide a complete picture of the health of the freshwater resource. The indicators do not include several other pollutants that can affect water quality, such as herbicide and pesticide residues, dissolved metals, pharmaceuticals, and hydrocarbons (although some information on metals and pesticides in groundwater is presented in the section ‘Current state and trends’ later in this chapter).
The indicators also do not cover many aspects of freshwater ecosystem health, such as the type and abundance of fi sh and aquatic plants. While many regional councils undertake such monitoring as part of their freshwater management programmes, data is not yet readily available for this to be reported at the national level. Some aspects of freshwater biodiversity, including the distribution of native and invasive (introduced) aquatic animals and plants, are discussed in chapter 12, ‘Biodiversity’.
Similarly, while many councils and other agencies monitor changes in water quantity (river and groundwater flows) in New Zealand, this data is not yet readily available for national reporting. Therefore, the indicator for water quantity focuses on demand (allocation).
This section describes the current state of freshwater quality and demand in New Zealand. Trends are also described, where possible, using data collected over the past 20 years.
Surface water quality
The section begins by assessing the water quality of surface waters (rivers, streams, and lakes) by considering their nutrient and bacteria levels, visual clarity, and their biochemical oxygen demand. The water quality of groundwater is then assessed, primarily by considering nitrate and bacteria levels, then water demand is assessed by considering levels of allocation.
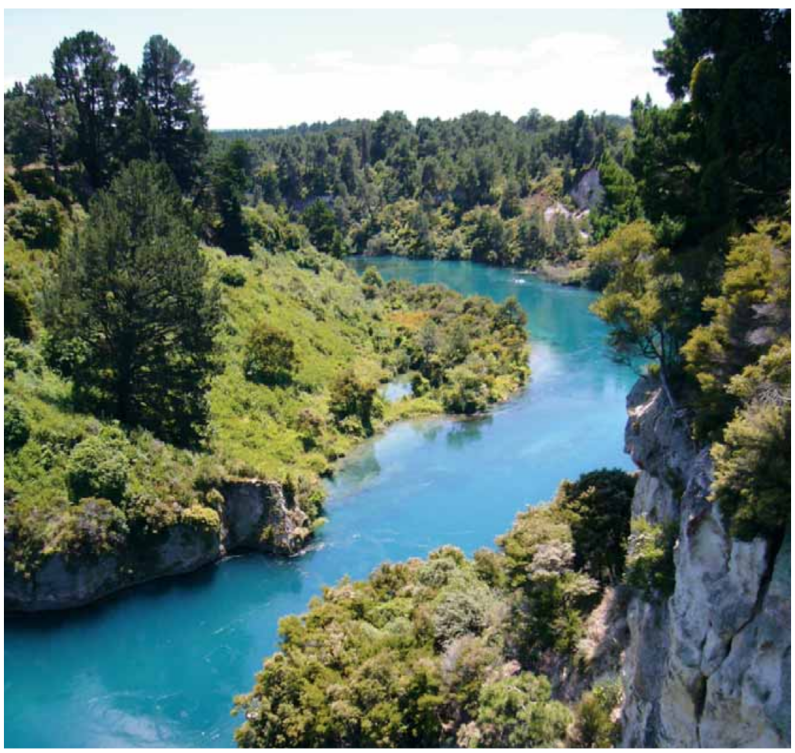
Image: Source: Ministry for the Environment.
Monitoring river water quality
More than 800 sites on New Zealand rivers and streams are regularly monitored for water quality (Ministry for the Environment, 2006a), including the Waikato River, shown in the photo on the previous page. Of these sites, 77 are located on 35 rivers throughout New Zealand and collectively make up the National River Water Quality Monitoring Network operated by the National Institute of Water and Atmospheric Research (see Figure 10.3). The remaining sites, located on both rivers and smaller streams, are part of monitoring networks operated by regional councils.
All national monitoring networks consist of river and stream sites found towards the top of a catchment where water quality is typically relatively good (often termed ‘reference sites’) and sites found lower down in catchments, where the water quality is more likely to be affected by human activities (referred to as ‘impacted sites’).
In addition to monitoring the physical, chemical, and biological properties of rivers and streams, agencies have developed other, complementary, approaches to assessing stream health in recent times. One example is the Cultural Health Index for Streams and Waterways, described in more detail in the box ‘More about iwi monitoring of freshwater: Cultural Health Index’ in ‘Changes since the 1997 report’ section of this chapter.
Nutrient levels increasing (nitrogen and phosphorus)
Figure 10.3 shows changes over time in the concentration of major nutrients in rivers within the national monitoring network (see box ‘Monitoring river water quality’). The dark blue line in each graph represents the rivers’ median nutrient concentration. The orange and light blue lines show trends for the rivers that have the highest and lowest concentrations of nutrients, respectively; that is, the rivers with nutrient concentrations in the top and bottom 5 per cent of the range of monitored sites.
The median levels of nitrogen and phosphorus have increased in rivers within the national monitoring network over the past two decades. More specifi cally, over 1989–2003, there was an average annual increase in levels of total nitrogen and dissolved reactive phosphorus of 0.5 per cent to 1 per cent (Ministry for the Environment, 2006d). While this increase may seem small, and is diffi cult to detect from the slope of the median (dark blue) lines in Figure 10.3, it signals a long-term trend towards nutrientenriched conditions that are likely to trigger undesirable changes to river ecosystems.
Furthermore, New Zealand rivers with relatively high levels of nitrogen are deteriorating – becoming more enriched – more rapidly than rivers with low levels of nitrogen. This is illustrated most clearly in Figure 10.3 by the strength of the trends for nitrate nitrogen and total nitrogen (that is, the relatively steep orange lines).
Figure 10.3: Nutrient trends in rivers in the National Monitoring Network, 1989–2005

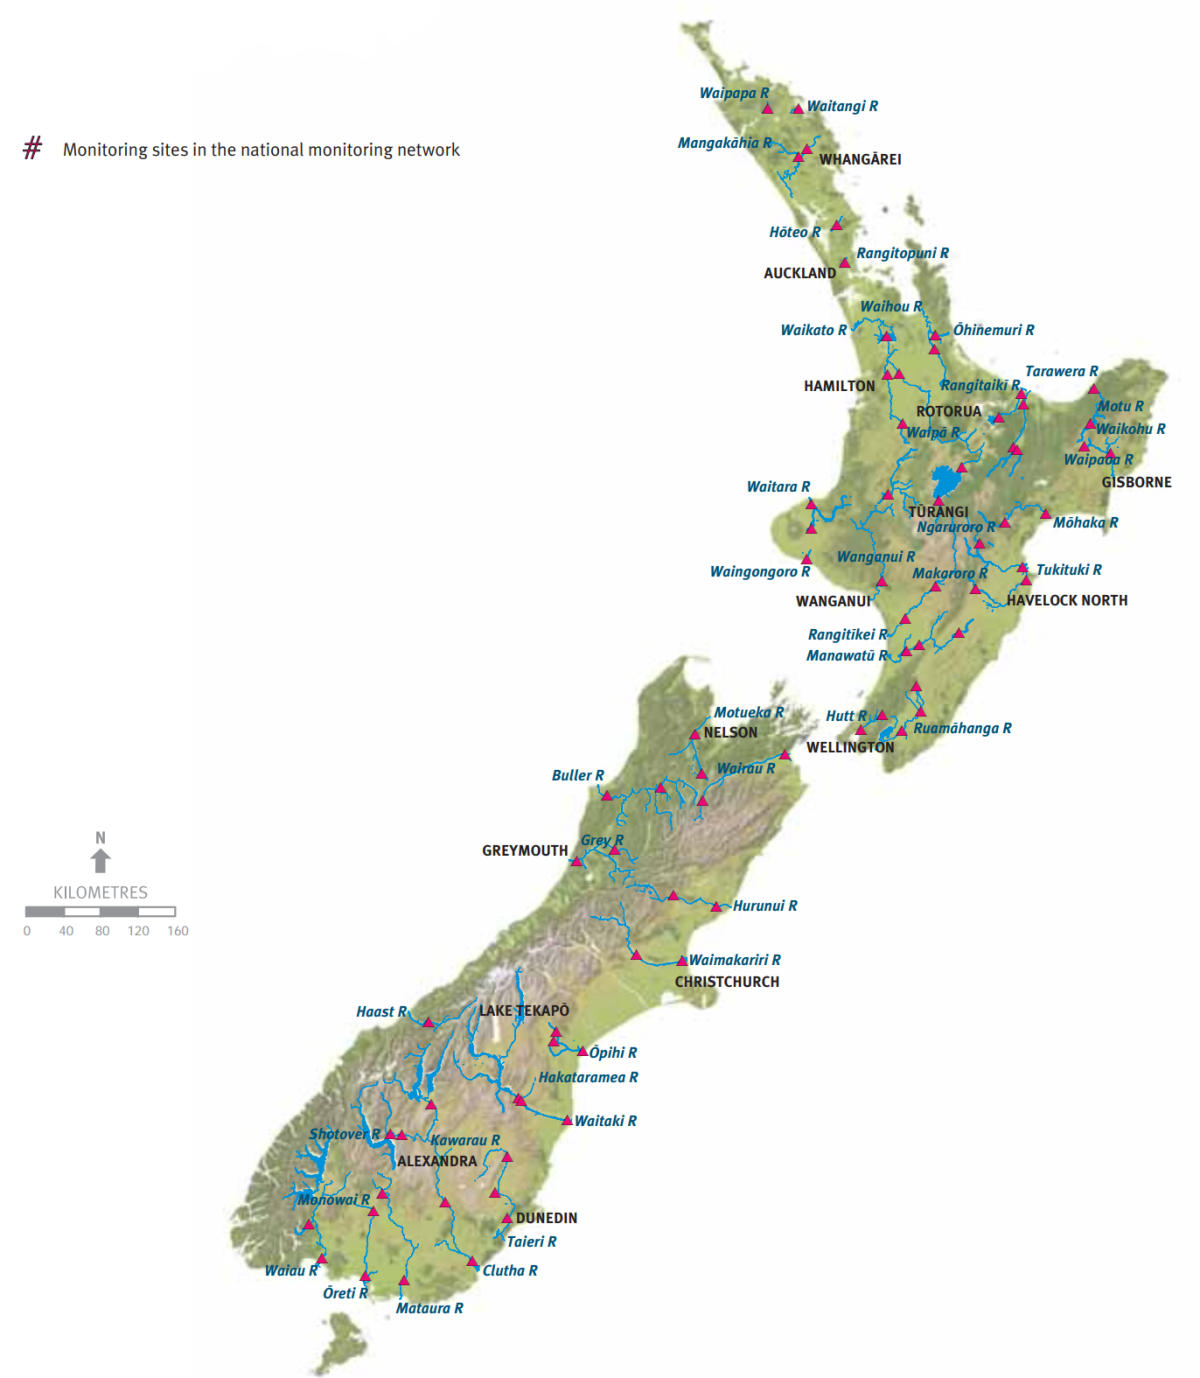

Image: Source: Adapted from Ministry for the Environment, 2006d.
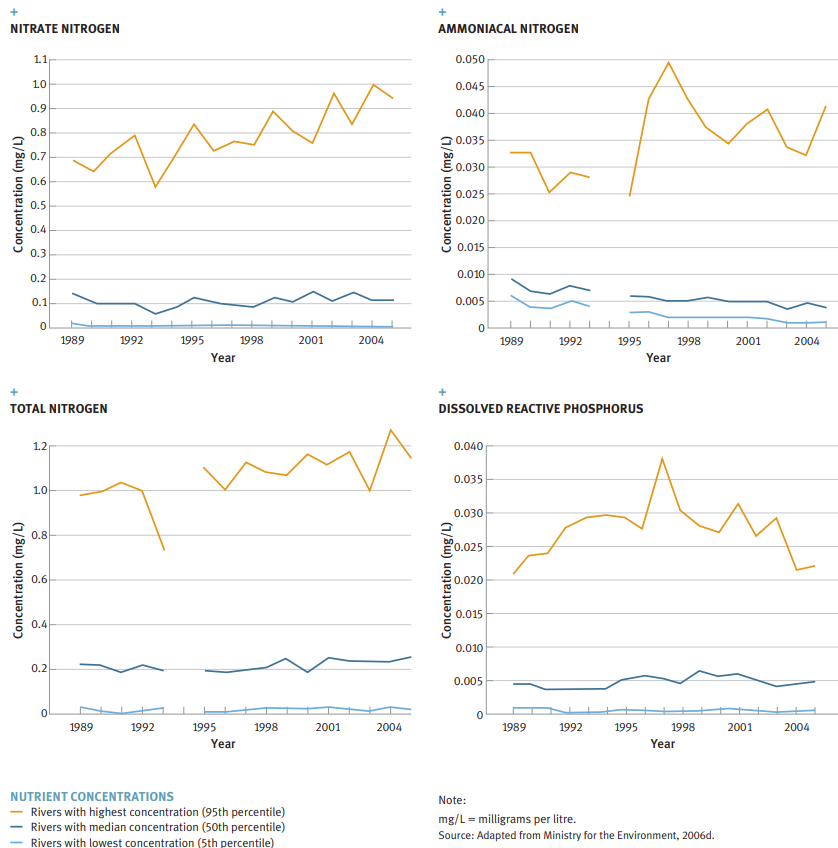
Image: Source: Adapted from Ministry for the Environment, 2006d.
Comparison with nutrient levels in other countries
The trend of increasing nitrogen in New Zealand rivers is consistent with patterns observed in other countries around the world. Globally, 30 per cent of 82 major river basins have higher nitrogen concentrations now than they had in the late 1970s (United Nations Educational, Scientific and Cultural Organization, 2006).
Nutrient levels in New Zealand rivers are still low by international standards. Our most nutrient-enriched rivers have about half the average nutrient levels of rivers in Europe, North America, and Asia that have been reported by the Organisation for Economic Co-operation and Development (Organisation for Economic Co-operation and Development, 2006).
Note that it is reasonable to compare only our most nutrientenriched rivers with rivers reported by the Organisation for Economic Co-operation and Development (OECD). This is because, in general, OECD measurements are taken at the mouths of rivers flowing from large catchments. As a result, the OECD data represents relatively highly nutrient-enriched river systems that do not compare readily with New Zealand’s less nutrient-enriched and, in many cases, smaller river systems.
Rivers with high levels of nutrients
The most nutrient-enriched rivers (represented by the orange lines in Figure 10.3) are located throughout the country and include the Mataura (Southland), Waingongoro (Taranaki), Waihou (Waikato), and the lower Manawatū. While these rivers are in lowland areas and are surrounded by predominantly pastoral farmland, factors unrelated to the predominant landscape may be contributing to their poor water quality. For example, in the past, a large point-source discharged effluent from a meatworks on the mid-reaches of the Waingongoro River (Taranaki Regional Council, 2006), although it now discharges to land during periods of low river flow.
Some improvement in nutrient levels
On average, levels of dissolved reactive phosphorus have increased in rivers of the national monitoring network (described earlier). However, there has been a steady decrease in phosphorus in rivers with high levels of this nutrient since a peak in the mid-1990s (indicated by the orange line in the graph for dissolved reactive phosphorus in Figure 10.3). This may signal improved pasture management in intensively farmed areas (for example, through reduced erosion and better fertiliser application practices), which may have led to reductions in the amount of phosphorus run-off to waterways.
Effluent, particularly from humans and farmed animals, such as sheep and cows, is the primary source of ammoniacal nitrogen. In contrast with other nutrients, levels of ammoniacal nitrogen have decreased in most of New Zealand’s rivers over the past two decades. This improvement is consistent with reductions in point-source pollution, particularly the trend in recent decades towards applying ammonia-rich stock effluent to land, rather than discharging it into waterways (see Figure 10.2).
Land use and nutrient enrichment in rivers
The level of nutrients in our rivers is influenced by natural factors such as rainfall and river flow patterns. For example, rivers in areas with relatively low rainfall have higher median nutrient (and bacteria) levels than rivers in wetter areas (Ministry for the Environment, 2005a). This is because contaminants are able to accumulate in stagnant or slow-flowing waters rather than being flushed downstream. However, the largest impact on nutrient levels in our rivers comes from land use.
Figure 10.4 compares the median nutrient levels in rivers and streams in unmodified catchments with the levels in rivers and streams in pastoral and urban catchments.
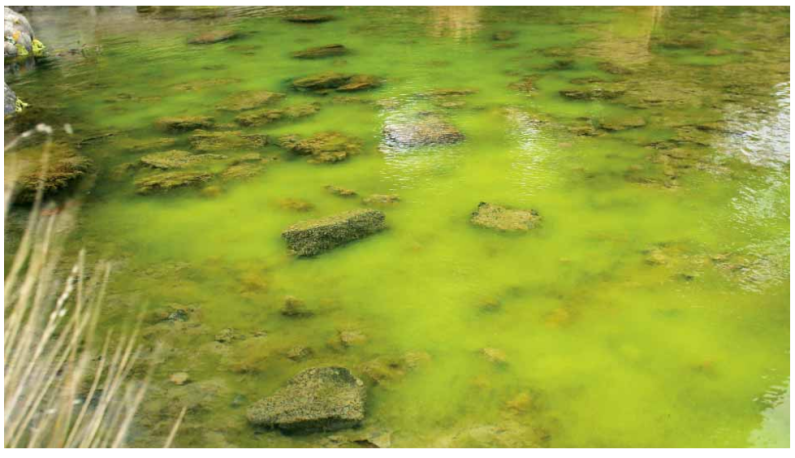
Image: Source: Nature’s Pic Images.
Figure 10.4 shows urban streams are the most nutrient-enriched waterways in New Zealand, followed by rivers and streams in predominantly pastoral catchments. The median nutrient concentrations in both urban and pastoral waterways breach the Australia and New Zealand Environment Committee Council guidelines (see the notes to Figure 10.4) for ecosystem protection (Australia and New Zealand Environment Committee Council, 2000). Rivers and streams in unmodifi ed catchments, such as those that are covered in native bush or alpine tussock, have the lowest levels of nutrients measured in New Zealand waterways.
Nutrients in urban waterways
The main source of nutrients in urban waterways is human wastewater (sewage). Wastewater may leak from broken sewer pipes or be discharged into stormwater systems through faulty pipe connections and sewer overflows. Some nutrients may also come from run-off from suburban lawns and gardens that have had fertilisers applied.
Urban streams with poor water quality can also have downstream impacts. Because most large towns and cities in New Zealand are situated on the coast, urban streams commonly discharge into harbours and estuaries (see chapter 11, ‘Oceans’).
Impact of agricultural activity
In rural environments, agricultural fertilisers and stock manure and urine are the major non-point-sources of nitrogen and phosphorus. These nutrients can enter water bodies relatively quickly if they are carried across the land surface by rainfall run-off, particularly if there are drains such as the mole and tile drains that are common on farmed pasture in Otago and Southland. (Mole and tile drains are subsurface channels constructed to drain surplus water.)
There is strong evidence at both the regional level (Environment Waikato, 2004; Hamill and McBride, 2003) and nationally that the levels of nutrients in rivers increase in proportion to the levels of agricultural activity in river catchments. The amount of nutrients going into the land from fertiliser application and livestock continues to increase in New Zealand as farming becomes more intensive (see box ‘More about intensive farming and land use’ in chapter 9, ‘Land’).
Figure 10.4: Comparison of Median Nutrient Levels in Rivers and Streams by Catchment Land Use, 1997–2002

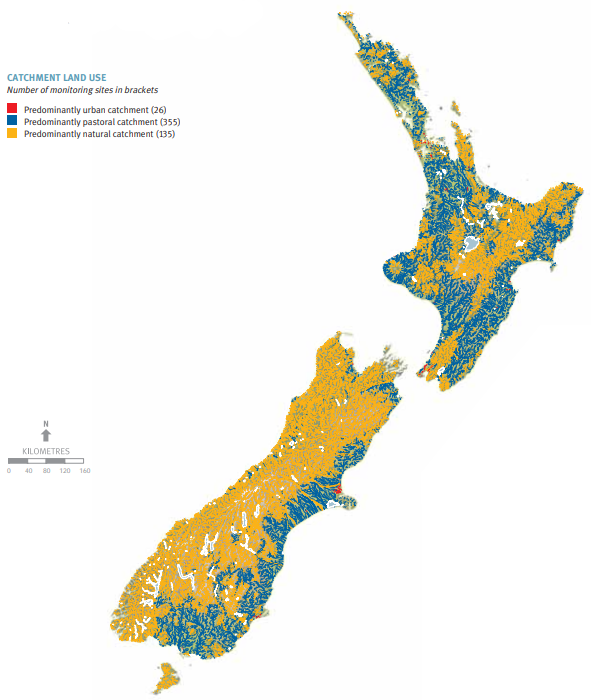
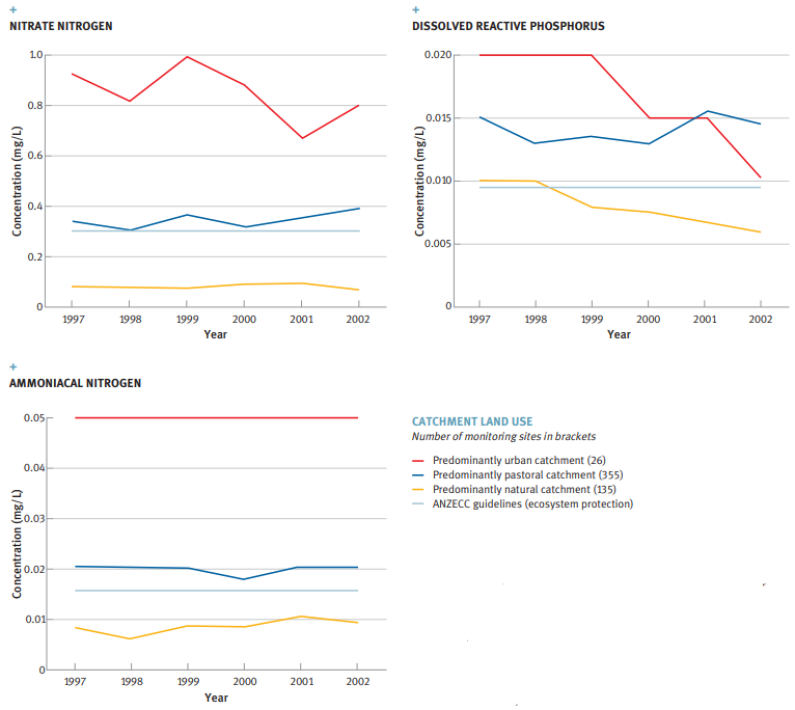
Image: Data source: Adapted from Ministry for the Environment, in press a.
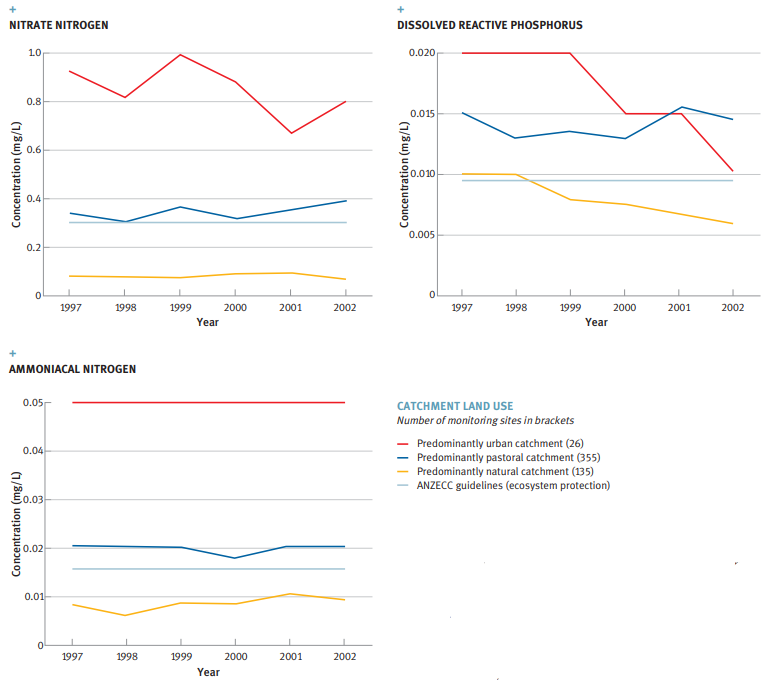
Image: Data source: Adapted from Ministry for the Environment, in press a.
Notes:
- River environments have been defi ned using the River Environment Classifi cation (see chapter 1, ‘Environmental reporting’). Catchments are defi ned as ‘natural’ unless pasture exceeds 25 per cent of the catchment area (in which case, it is classed as ‘pastoral’), or unless urban land use exceeds 15 per cent of the catchment area (in which case, it is classed as ‘urban’).
- The Australia and New Zealand Environment Committee Council (ANZECC) guidelines provide ‘trigger values’ for the protection of ecosystems and the recreational and aesthetic values of waterways (Australia and New Zealand Environment Committee Council, 2000). If a trigger value is reached, it does not necessarily mean that ecosystem damage is occurring or that recreation is no longer possible, but it provides advance warning that a problem may be emerging.
- mg/L = milligrams per litre.
GOVERNMENT ACTION to manage freshwater quality
The Sustainable Water Programme of Action
In 2003, the Ministry for the Environment and the Ministry of Agriculture and Forestry jointly launched the Sustainable Water Programme of Action (SWPoA) to identify priorities for government action to improve freshwater management in New Zealand. The SWPoA has a particular focus on addressing the pressures on water bodies from land-use change and intensifi cation. Extensive consultation in 2005 revealed broad support for the development of policy in a number of areas of freshwater demand and quality management.
By 2007, Cabinet had approved the development of a national policy statement on freshwater, as well as two national environmental standards, including one that will ensure methods used to allocate water are geared to safeguard aquatic ecosystems. Another focus of the SWPoA is to produce tools and best-practice guidance for regional councils on aspects of water quality and land-use management. See also box ‘Government action to manage freshwater demand’.
National environmental standard for drinking water sources
In November 2006, the Government gave approval for a national environmental standard (NES) for sources of human drinking water. The purpose of this NES is to reduce the risk of contaminating sources of human drinking water (eg, rivers and groundwater). The NES will prevent resource consents from being granted, or permitted activity rules being included in regional plans, if they were to result in drinking water becoming unsafe to drink (after treatment by existing means).
Guidance and standards for freshwater management
Government has published various non-regulatory guidelines and standards since the late 1990s to help resource managers assess the quality of New Zealand’s freshwater. These include:
- Australian and New Zealand Guidelines for Fresh and Marine Water Quality. (Australia and New Zealand Environment Committee Council, 2000)
- Microbiological Water Quality Guidelines for Marine and Freshwater Recreational Areas (Ministry for the Environment and Ministry of Health, 2003)
- Drinking-water Standards for New Zealand 2005 (Ministry of Health, 2005)
Nutrients in lakes
Monitoring lake water quality
The long-term monitoring of lakes in New Zealand is undertaken primarily by regional councils. Councils currently monitor the nutrient status of about 120 lakes around the country (although there are 134 lakes for which recent nutrient data are available). About half of all the lakes monitored are shallow (less than 10 metres deep) and about half are smaller than 50 hectares.
Of the 229 lakes in New Zealand that are larger than 50 hectares, about one-third are monitored. Many of the large unmonitored lakes are in national parks (such as Fiordland) or are reservoirs for hydro-electric power generation. Regular monitoring is not regarded as being necessary at these lakes because they generally do not experience the same land-use pressures as lakes in developed catchments, and changes to the quality of their water are expected to be much slower.
What is the Trophic Level Index?
In New Zealand, the Trophic Level Index is widely used to measure changes in the nutrient (trophic) status of lakes. This index considers phosphorus and nitrogen levels, as well as visual clarity and algal biomass. It takes account of both particulate and dissolved nitrogen (nitrate) and phosphorus in the water, which is important because water generally remains in lakes for long periods, so that even particulate nutrients can eventually be used to boost growth in aquatic plants.
Monitored lakes make up only a small proportion (4 per cent) of all lakes in New Zealand, and many of the lake monitoring programmes focus on lakes that have poor water quality or are at risk of water quality being impaired by land use in their catchment (see box ‘Monitoring lake water quality’). This means care should be taken when interpreting the results of the monitoring of water quality of New Zealand lakes.
A more balanced picture of lake water quality across the country can be obtained by classifying all unmonitored lakes according to the environmental factors that drive water quality (such as climate, lake depth, and the size and types of land cover in the lake catchment).
Key fi ndings for both monitored and unmonitored lakes are presented in the following section.
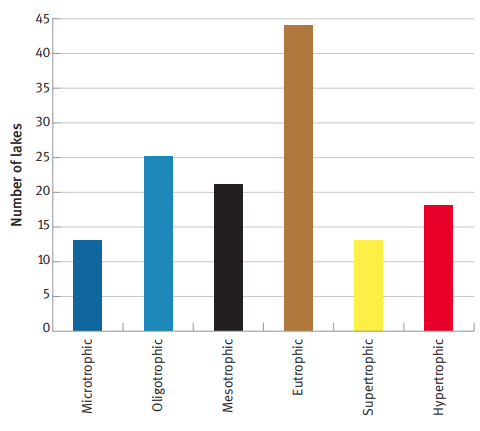
Nutrient levels in monitored lakes
Seventy-fi ve of the 134 lakes in New Zealand for which nutrient data are available have high to very high levels of nutrients (see Figure 10.5). Thirteen per cent of these lakes are known as ‘hypertrophic’, meaning they are ‘saturated’ with nutrients and their water quality is extremely degraded. In such lakes, algal blooms are common and the health of aquatic animals is often at risk. While some recreation may take place on the surface of these degraded lakes (such as sailing), activities such as swimming are restricted because of the lakes’ prolifi c weed growth and poor water clarity.
Deep lakes hold more water than shallow ones and have a greater capacity to absorb incoming nutrients before showing defi nite signs of deterioration in water quality. In addition, the nutrient status of lakes is strongly related to their depth and the type of land use and human activities in the catchment.
All of the monitored lakes that have high levels of nutrients are shallow. They include lakes surrounded by farmland in the Waikato (for example, Lake Hakanoa and Lake Mangakawhere), several of the dune lakes in Northland (Lakes Ömäpere, Kapoai, Rotokawau, and Waiporohita), and two coastal lagoons in Canterbury (Lake Ellesmere/Te Waihora and Lake Forsyth/ Te Wairewa).
The monitored lakes with the lowest levels of nutrients are nearly all deep lakes in mountain country in the South Island (for example, Lakes Coleridge, Pükaki, Wänaka, and Tekapö) and do not have particularly intensive farming or urban activity in their catchments.
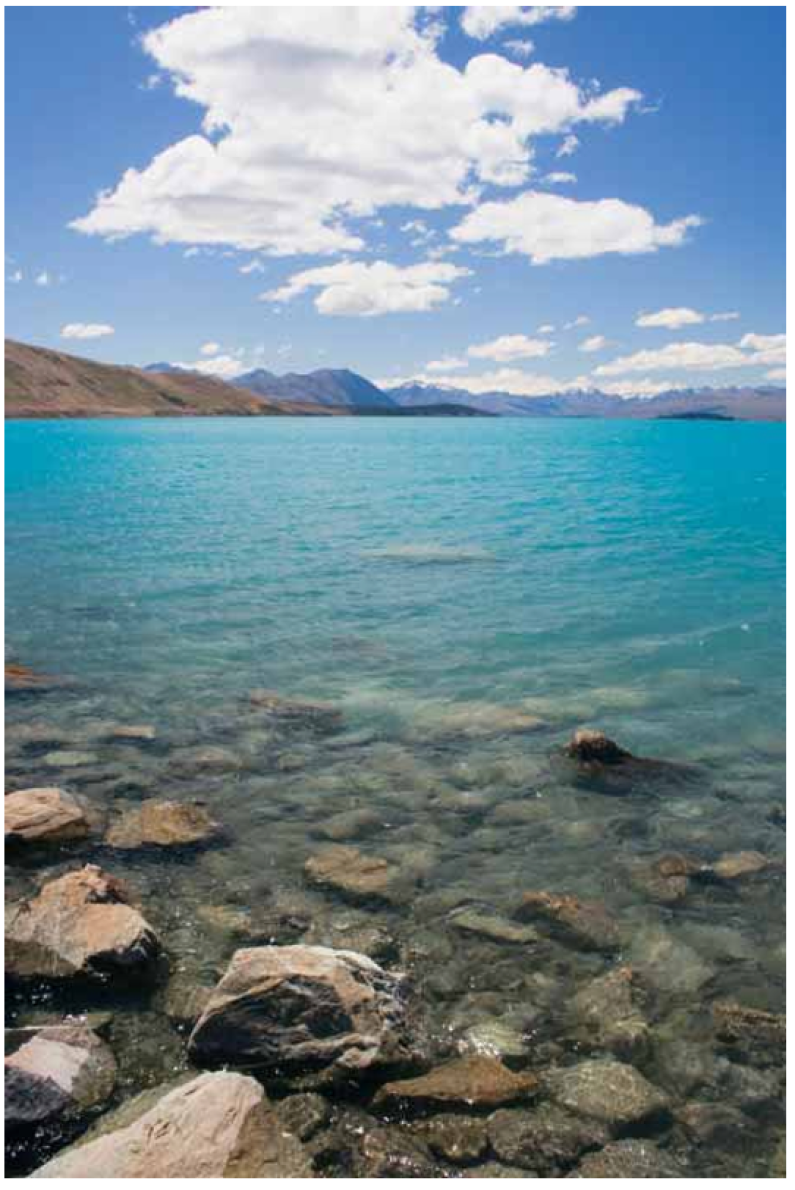
Image: Source: iStockphoto
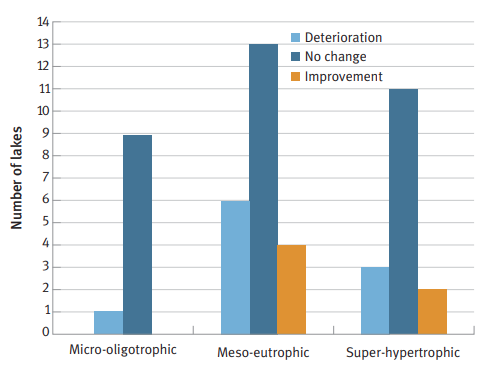
Figure 10.5: Trophic (Nutrient) Level (Most Recent to 2005) and Trends (1990–2006) of Monitored Lakes

Image: Source: Adapted from Ministry for the Environment, 2006b and Ministry for the Environment, in press c.
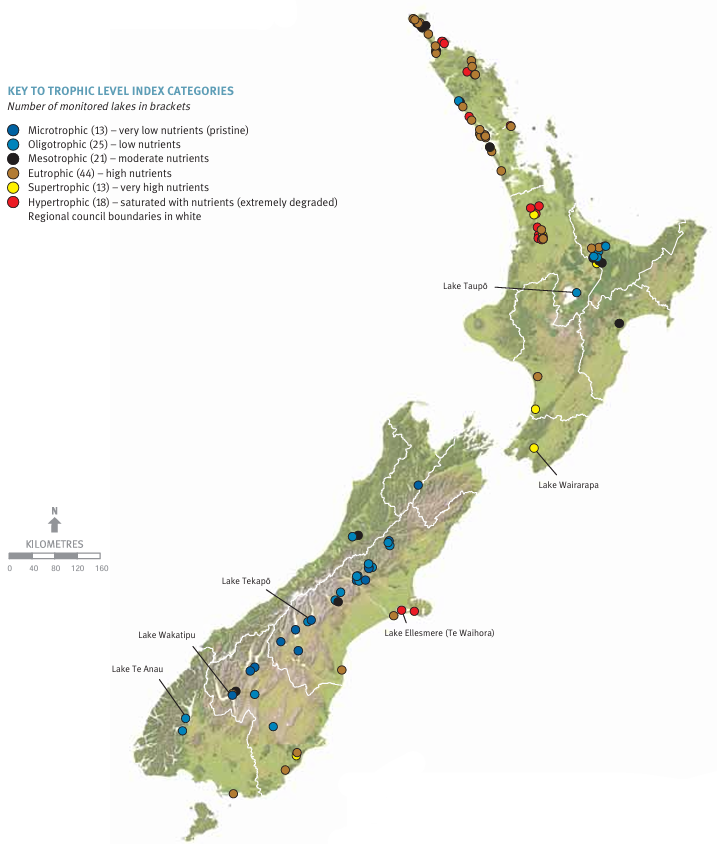
Image: Source: Adapted from Ministry for the Environment, 2006b and Ministry for the Environment, in press c.
Note:
Lakes have been categorised in this fi gure using the Trophic Level Index and trends have been calculated using the Burns methodology (Burns et al, 2000).


An estimate of water quality in unmonitored lakes
A large majority of the 3,820 lakes greater than 1 hectare in area in New Zealand are not monitored. By extrapolating the results for monitored lakes, it is estimated that the majority (about two thirds) of all lakes are likely to have relatively low concentrations of nutrients and good to excellent water quality because they lie in natural, or only partially developed, catchments (Ministry for the Environment, in press c). The remaining third of lakes are likely to have high levels of nutrients and poor water quality.
Measured trends in lake water quality
Trends in water quality have been assessed for 49 lakes. Figure 10.5 shows that the levels of nutrients in most of these lakes have shown no signs of change since 1990. Ten of the 49 lakes show possible or defi nite signs of deterioration (that is, an increase in nutrient or algae levels or a decrease in visual clarity), and six show signs of improvement. Many of the lakes showing signs of deterioration are already moderately nutrient-enriched (meso-eutrophic) and lie in largely developed catchments (for example, Waikere in Northland, and Waikare and Rotomanuka in the Waikato).
Land use and lake water quality
Figure 10.6 compares the water quality of monitored lakes in predominantly pastoral catchments with lakes in catchments with predominantly natural land cover. Levels of nutrients (nitrogen and phosphorus) and algae are between two and six times higher in lakes in pastoral catchments than in lakes that are in natural catchments.
Figure 10.6: Comparison of Trophic Level Index Water Quality Variables Between Lakes in Pasture Catchments and Lakes In Natural Catchments, 2004–2006
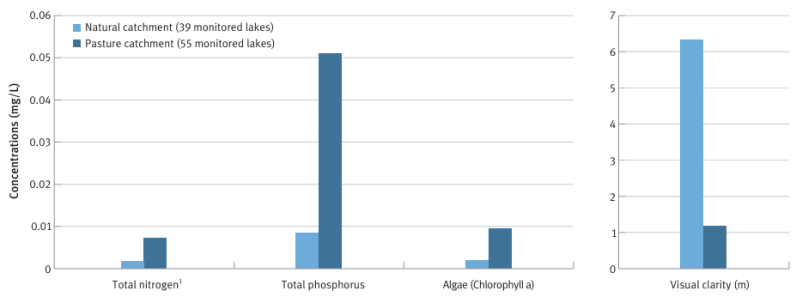
Image: Data source: Ministry for the Environment, in press c.
Notes:
- Total nitrogen concentrations are much higher than total phosphorus concentrations, but nitrogen values have been scaled down by 100 in this graph for the purposes of presenting information on both nutrients together.
- mg/L = milligrams per litre
Because algal concentrations affect water clarity, the lakes in natural catchments have water that is, on average, five times clearer than water in lakes in pastoral catchments. For example, lakes in the mountainous terrain of the South Island commonly have underwater visibility for more than 10 metres (Ministry for the Environment, 2006b), although this is lowered naturally in some cases by tannins leaching from beech forests or by fi ne glacial sediment.
The photo opposite shows an example of a degraded lowland lake that is surrounded by farmland – Lake Spectacle in the Auckland region. Many lakes that lie in intensively used catchments are the subject of management programmes that aim to stem the inflow of pollutants from the surrounding land (see box ‘Local action to protect water quality in Lake Taupō and the Rotorua Lakes’).
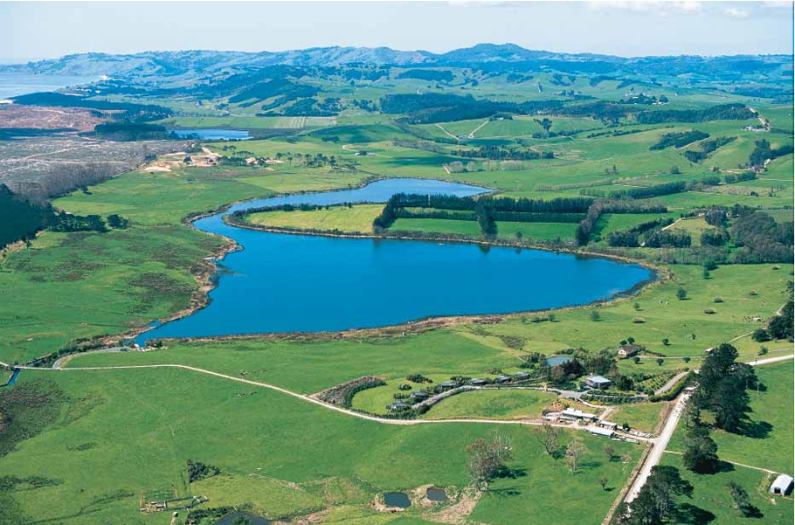
Image: Source: Courtesy of Auckland Regional Council
LOCAL ACTION to protect water quality in Lake Taupō and the Rotorua Lakes
The Bay of Plenty and Waikato regional councils are working with district councils, Māori trust boards, land owners, and the wider community to protect the water quality of Lake Taupō and the Rotorua Lakes.
In the Rotorua district, action plans are under development for each of 12 lakes to reduce their nutrient (nitrogen and phosphorus) levels. One example of action planned is the construction of a channel that will limit the input of nutrient-rich water to Lake Rotoiti.
Environment Bay of Plenty has produced Rule 11, a set of regional rules designed to limit the loss of nitrogen and phosphorus from land-use activities.
In the Waikato, a proposed variation to the regional plan sets a water quality objective for Lake Taupō and changes land-use controls on nutrients entering the lake from urban and rural sources.
In addition, higher than previous standards are proposed for domestic wastewater treatment and disposal near the lake, as well as limits on nitrogen leaching from all land in the catchment. For the first time, farmers in the Waikato region will be required to cap the amount of nitrogen that may leach from their farming activities.
The Government has committed $81.5 million to the long-term Lake Taupō protection programme and $4 million towards remedial work to improve water quality in Lake Rotoiti.
Other factors affecting lake water quality
Natural factors such as air temperature and wind are also important determinants of water quality in lakes. Algal blooms are more likely to occur in lakes in warmer climates (those at lower elevations and in the north) and in the summer. Wind can create waves and currents, particularly in shallow lakes, and lift sediments from the lake bed into the water. As well as reducing the clarity of a lake’s water, this can cause the amount of nutrients that are available for algal growth to increase. Clarity and the appearance of lake water may be affected by soil type. For example, lakes surrounded by peaty soil, such as those commonly found in Westland and Waikato, have water that is naturally brown-stained or ‘dirty’ looking.
Bacterial (faecal) pollution in rivers and lakes
Monitoring swimming spots
Across the country, 230 sites on rivers and lakes are regularly monitored for recreational water quality. These are sites where water-based activities such as swimming, water-skiing, and diving are common. Water samples are typically taken once a week over the summer (November to March) and are tested for E. coli, the indicator of faecal pollutants in freshwater. (The 230 sites monitored include only those sites where at least 10 water quality samples are taken over the summer. Another 33 sites are monitored, but less frequently.)
When E. coli levels are higher than those recommended by the Microbiological Water Quality Guidelines for Marine and Freshwater Recreational Areas (Ministry for the Environment and Ministry of Health, 2003), councils liaise with health authorities to ensure the public is warned (by signs or other means) that there is an unacceptable health risk.
Water quality at freshwater swimming spots
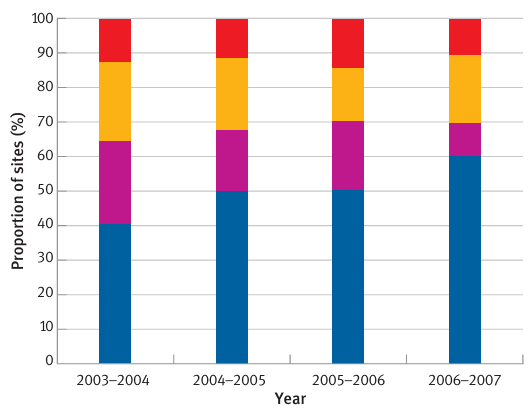
Figure 10.7 shows that over the 2006–2007 summer, 60 per cent of the 230 monitored freshwater swimming spots had water quality that met New Zealand guidelines for water based (contact) recreation almost all of the time (that is, at least 95 per cent of the samples taken at these sites had concentrations of E. coli that were within acceptable levels). Ten per cent of the sites breached the guidelines regularly (that is, more than 25 per cent of the samples taken from these sites were non-compliant), indicating that these sites often have poor water quality and are not suitable for swimming.
The number of freshwater sites meeting the New Zealand guidelines in 2006–2007 is higher than in previous years for which data has been reported (2003–2004 and 2005–2006). (See the graph in Figure 10.7.) While this increase is encouraging, the period of monitoring is not yet long enough to be able to determine whether there is a trend of improving recreational water quality over time.
Several natural and human factors may cause variations in water quality between seasons. For example, during a wet summer (with frequent rain), more faecal matter is carried from the land into rivers and lakes. Therefore, bacteria levels in the water during wet summers are often high compared with dry summers. Also, sediment mixing as a result of wind and wave action can elevate bacteria levels.
Freshwater swimming spots generally have higher background levels of bacteria and longer-lasting contamination events than coastal beaches. This is largely because faecal matter is more rapidly diluted and dispersed by currents and the large volumes of water at the coast. The difference between bacteria levels at freshwater and coastal swimming spots is illustrated by comparing monitoring results for the 2006–2007 summer; the water quality of 80 per cent of monitored coastal beaches met the guidelines for swimming almost all of the time (compared with 60 per cent of freshwater sites), while only 1 per cent of the coastal beaches breached the guidelines regularly (compared with 10 per cent of freshwater sites) (see chapter 11, ‘Oceans’).

Image: Source: Ministry for the Environment.
Figure 10.7: Bacterial Water Quality at Monitored Freshwater Swimming Spots, 2003–2007
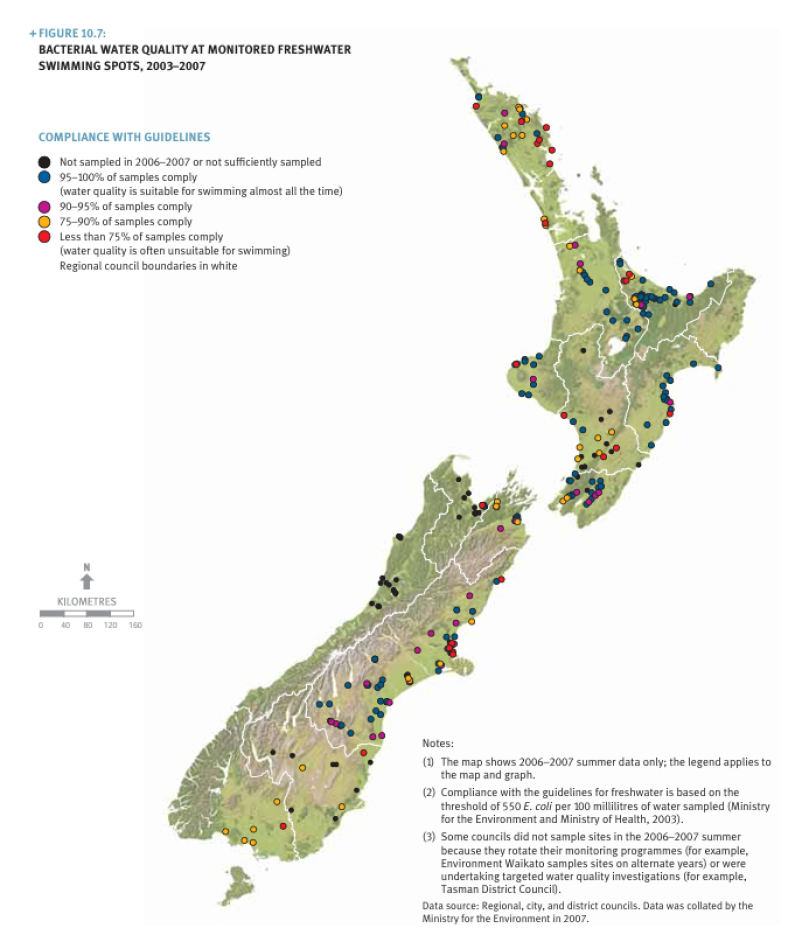
Image: Data source: Regional, city, and district councils. Data was collated by the Ministry for the Environment in 2007.

Image: Data source: Regional, city, and district councils. Data was collated by the Ministry for the Environment in 2007.
Notes:
- The map shows 2006–2007 summer data only; the legend applies to the map and graph.
- Compliance with the guidelines for freshwater is based on the threshold of 550 E. coli per 100 millilitres of water sampled (Ministry for the Environment and Ministry of Health, 2003).
- Some councils did not sample sites in the 2006–2007 summer because they rotate their monitoring programmes (for example, Environment Waikato samples sites on alternate years) or were undertaking targeted water quality investigations (for example, Tasman District Council).

Land use and bacterial (faecal) pollution in rivers
Rivers and streams with the highest average levels of faecal pollution are those in towns and cities (see the comparison of median levels in Figure 10.8). Faecal matter from birds, cats, and dogs may be carried by stormwater into urban waterways, although there is little evidence that this source on its own results in infectious levels of bacteria (Ministry for the Environment, 2002). A significant amount of faecal material comes from human waste leaking from sewerage systems.
Like those in urban areas, rivers and streams in pastoral areas also have high levels of bacteria (relative to waterways in natural catchments). While the levels of bacteria in pastoral waterways are lower than in urban sites, the worst pastoral sites that are monitored have significantly higher levels of bacteria than the worst urban sites that are monitored (as indicated by the relatively high 95th percentile for pastoral sites in Figure 10.8).
It is known that farm stock with access to river and stream beds can contribute high amounts of faecal matter directly to the water. One study has shown that if cows cross a stream on their way to and from milking, they are 50 times more likely to defecate in the water than on adjacent raceways (Davies Colley et al, 2004).
Many sites in predominantly natural catchments, where land-use pressures are considered to be lowest, also have high levels of bacteria. These high levels could be caused by faecal matter from birds and other wild animals, such as possums, deer, and goats. Predominantly natural catchments may also have small pockets of urban or pastoral land use that deliver significant amounts of faecal material to the water.
Figure 10.8: Concentrations of Escherichia Coli (E. Coli) Bacteria in Rivers and Streams in Catchments With Different Land Uses, 1997–2002

Image: Data source: Ministry for the Environment, in press a.
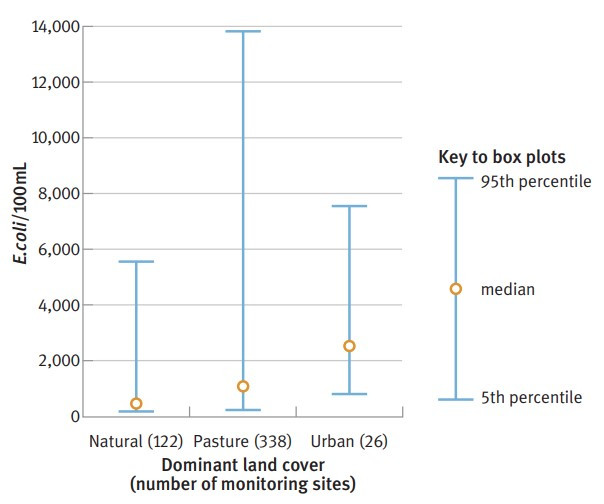
Image: Data source: Ministry for the Environment, in press a.
Notes:
- Statistics in the graph are derived from 95th percentile data.
- These results include winter sampling results, when faecal-bacteria loads are typically relatively high. This is because there is increased run-off from higher winter rainfall and bacteria tend to live longer in cooler temperatures. However, in general, recreational activities such as swimming do not take place in winter.
- mL = millilitres (of water).
Visual clarity
Between 1989 and 2003, the median visual clarity improved in rivers within the national monitoring network. Almost half of the 77 monitored sites showed increases in visual clarity of more than 1 per cent per year over this time. Since 2000, the median visual clarity for monitored New Zealand rivers ranged between 1.0 and 1.9 metres (Ministry for the Environment, 2006d). This meets the requirements for ecosystem protection (Australia and New Zealand Environment Committee Council guidelines state that clarity of less than 0.7 metres, averaged for upland and lowland rivers, is unacceptable) but has, at times, been below the recommended minimum for human recreation (1.6 metres) (Australia and New Zealand Environment Committee Council, 2000).
Water clarity varies widely between rivers around the country. Visual clarity of only 10 to 40 centimetres is common in rivers with very high levels of sediment. These rivers include the lower Manawatü, the Waitara in Taranaki, and the Waipaoa in the Gisborne district.
Soil erosion is a common cause of low levels of clarity in New Zealand rivers and streams. This may be a consequence of poorly managed farmland (for example, the collapse of unprotected stream banks and sediment run-off from paddocks). Urban development and harvesting of plantation forestry can also produce high volumes of sediment run-off.
Natural factors can also determine clarity. For example, the low level of clarity in the Waipaoa River is caused by the geology of the catchment. Sandstones, mudstones, and gravels are easily eroded, which leads to high suspended-sediment loads (Gisborne District Council, no date). See also box ‘More about hill-country erosion and our geological history’ in chapter 9, ‘Land’.
Visibility of more than 10 metres is common in the country’s clearest rivers (the upper Motueka, Clutha, and Monowai in the South Island high country). The upper catchment of the Motueka River is almost entirely native bush or bare mountain rock and, as a result, the amount of sediment-laden run-off that enters the upper reaches of the river after rainfall is minimal. The photo on the opposite page shows an example of a river with high visual clarity – the Waiohine River in the Wairarapa.
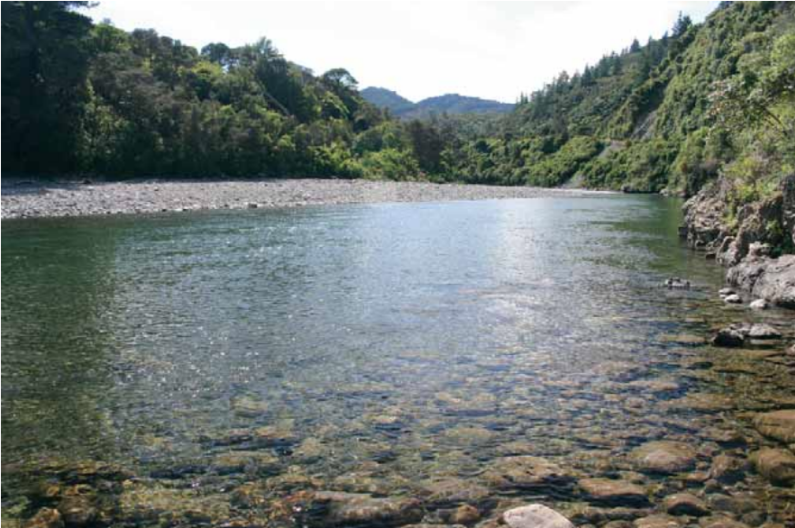
Image: Source: Courtesy of Greater Wellington Regional Council.
It is not yet possible to identify why the water clarity in rivers has improved. However, the improvement may be related to a reduction in sediment in the water as a result of better forestry and farm management (for example, fencing to prevent stock trampling river and stream banks).
Water temperature and dissolved oxygen
Water temperatures and levels of dissolved oxygen remained stable in rivers in the national monitoring network over 1989–2005 (see Figure 10.9). This is encouraging because trends towards higher temperatures and lower levels of dissolved oxygen would indicate water quality was declining.
Large rivers are less susceptible to significant temperature changes than streams. There is some evidence from regional council reporting (for example, Tasman District Council, 2005) that streams in developed catchments regularly experience water temperatures that are high enough to threaten their ecology. These streams are typically unshaded because the riparian vegetation has been cleared.
Figure 10.9: Trends in Dissolved Oxygen and Water Temperature in Rivers in the National Monitoring Network, 1989–2005
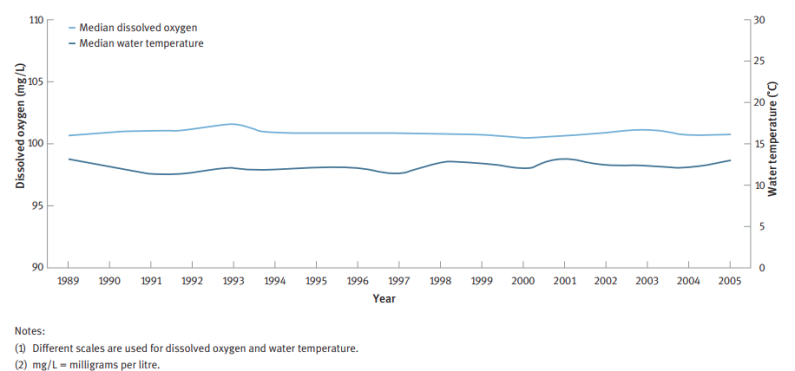
Image: Source: Adapted from Ministry for the Environment, 2006d.
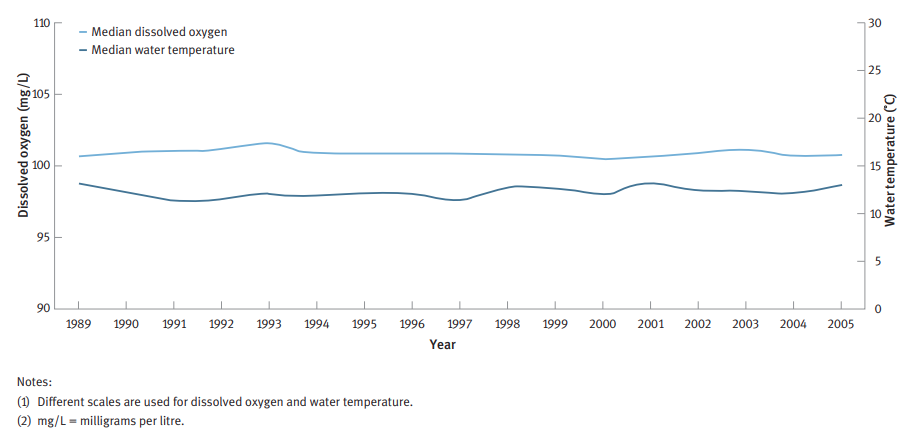
Image: Source: Adapted from Ministry for the Environment, 2006d.
Macroinvertebrate richness (%EPT)
High macroinvertebrate richness (%EPT) indicates good water quality. Monitoring of rivers in the national network over 1989–2005 showed that the relative abundance of macroinvertebrates sensitive to pollution (as measured by %EPT) increased in rivers that had low or median numbers of macroinvertebrates to start with (see Figure 10.10). These increases are consistent with decreases in ammoniacal nitrogen and biochemical oxygen demand (reported in earlier sections of this chapter), and further indicate that levels of organic pollution have decreased.
Figure 10.10: Trends in Macroinvertebrates (%ept) in Rivers in the National Monitoring Network, 1989–2005
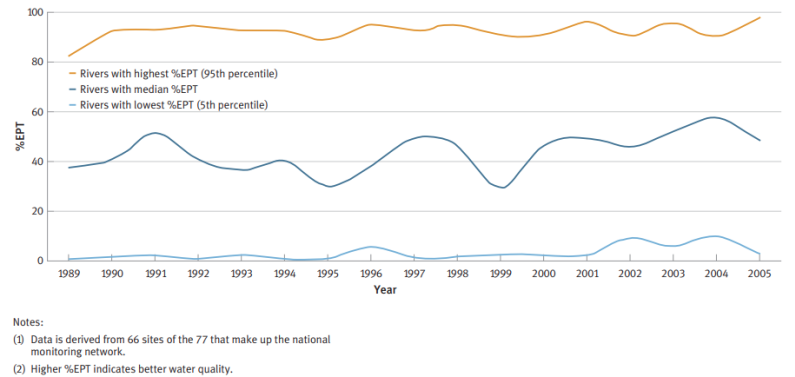
Image: Data source: National Institute of Water and Atmospheric Research.
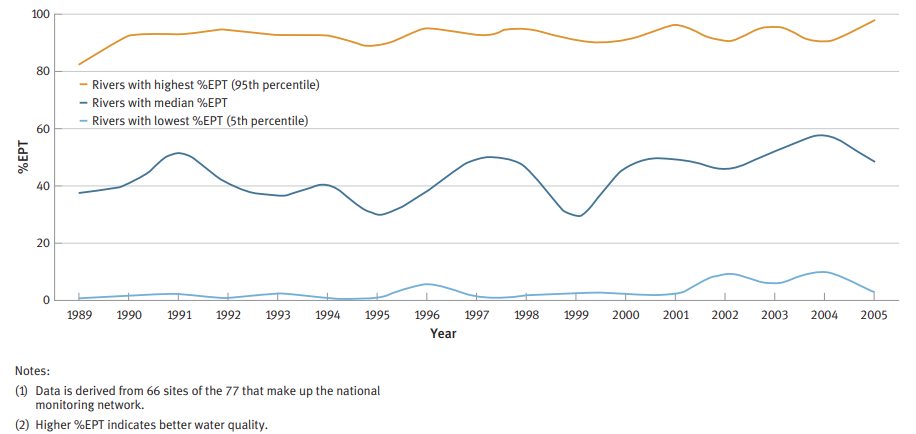
Image: Data source: National Institute of Water and Atmospheric Research.
Biochemical oxygen demand
Biochemical oxygen demand (see box ‘What is biochemical oxygen demand?’) decreased steadily in rivers across the country in 1989–2002, indicating an improvement in water quality. This is illustrated in Figure 10.11, which shows that about half of the 77 sites monitored have had significant decreases in organic pollution and none of them has worsened over 1989–2002. This improved water quality is probably the result of better management of point-sources of pollution, such as dairyshed and factory wastewater discharges.
What is biochemical oxygen demand?
Biochemical oxygen demand (also known as ‘BOD5’) indicates the amount of organic waste in the water. Common sources of organic waste are point-source discharges of sewage from wastewater treatment plants and discharges of carbohydrate and protein material from timber treatment plants, meatworks, and dairy factories.
Biochemical oxygen demand is not a national environmental indicator. However, it is reported in this chapter because biochemical oxygen demand levels have changed significantly over the past two decades, which illustrates the effects of freshwater management during and before that period.
Figure 10.11: Trends in Biochemical Oxygen Demand (Bod5) for Rivers in the National Monitoring Network, 1989–2002
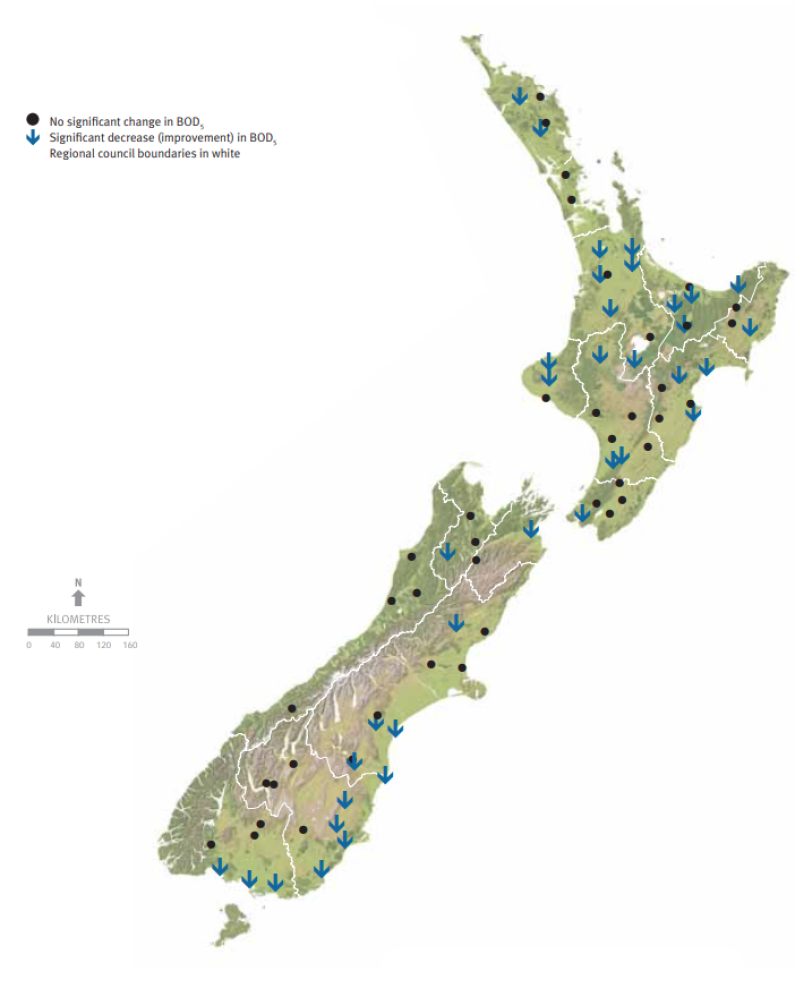
Image: Source: Adapted from Ministry for the Environment, 2006d.

Image: Source: Adapted from Ministry for the Environment, 2006d.
The average levels of biochemical oxygen demand in New Zealand’s most polluted rivers are three times lower than in large rivers in other OECD countries (Organisation for Economic Co-operation and Development, 2006).
The Mataura River in Southland is an example of a major New Zealand waterway in which water quality has improved since point-source discharges of organic waste were reduced and/or received improved treatment before discharge. In 1975, 15.5 tonnes of organic waste were discharged into the river each day. By 2000, because of improvements to effluent treatment at a large meatworks alongside the river, the organic waste discharged had decreased to just over 3 tonnes a day. Similar reductions in the amount of suspended-solid material were achieved over the same period.
While the Mataura River still has elevated nutrient and bacteria levels from non-point-sources, marked improvements in the appearance of the river (less surface scum and foam) have been attributed to the reduction in organic matter entering it (Environment Southland, 2000).
The most extensive aquifers in New Zealand are shallow, unconfined sand and gravel sediments. These aquifers contain relatively young, well-oxygenated, and fast-flowing groundwater. While the mineral content of this groundwater is typically low, it is vulnerable to pollution from human activities on the land. These pollutants, particularly nutrients and faecal material, can quickly reach the water table and, once there, disperse over wide areas.
Nutrients (nitrate) in groundwater
Nitrogen is found in groundwater in the form of nitrate, and is monitored for health and environmental reasons. Excessive levels of nitrate in drinking water have been linked with blood disease in infants (commonly known as ‘blue baby syndrome’) (Davies, 2001).
From an environmental perspective, elevated levels of nitrate often indicate the potential presence of other pollutants from human activities, such as faecal pathogens and pesticides (that is, nitrate can be a good indicator of general groundwater degradation). In addition, groundwater that is rich in nitrate has the potential to elevate nutrient levels in the surface water it drains into.
Current nitrate levels
More than one-third (39 per cent) of groundwater monitoring sites in New Zealand have levels of nitrate that are elevated above natural background levels, probably as the result of human activities (Ministry for the Environment, in press b), such as the leaching of fertiliser and stock effluent. The median nitrate level in monitored groundwater in New Zealand is 1.3 milligrams per litre. Nitrate levels exceed the 2005 New Zealand drinking water standard of 11.3 milligrams per litre at almost 5 per cent of monitoring sites (see Figure 10.12). However, the proportion of bores at these sites used to supply drinking water for people is not known.
Groundwater quality
Monitoring groundwater
There are almost 1,100 sites (that is, wells or bores) for monitoring groundwater quality in New Zealand. The average well is about 20 metres deep, with a quarter of all monitoring wells less than 9 metres deep, and another quarter deeper than 45 metres.
In New Zealand, monitoring tends to focus on aquifers that are considered by water managers to be either an important source of supply, or particularly vulnerable to pollution. Therefore, the results of monitoring surveys presented in this section should be considered to represent areas where contamination is likely, rather than representing the overall groundwater resource in New Zealand.
Figure 10.12: Median Nitrate Levels in Groundwater, 1995–2006

Image: Source: Adapted from Ministry for the Environment, in press b.
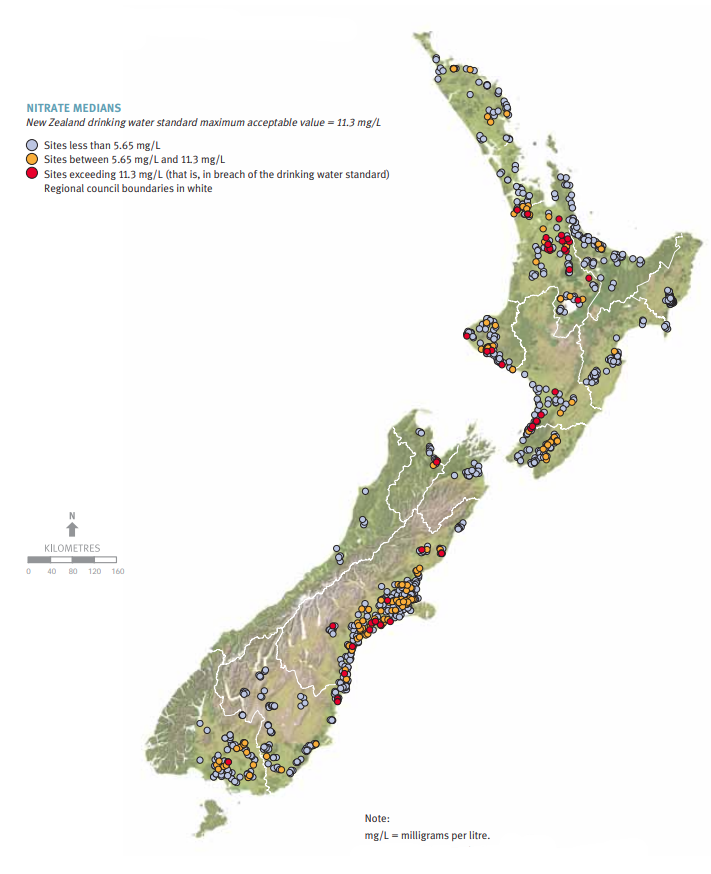
Image: Source: Adapted from Ministry for the Environment, in press b.
In New Zealand, nitrate concentrations are highest in shallow, well-oxygenated groundwater in unconfined aquifers. The median nitrate concentration in this type of groundwater is 2.8 milligrams per litre, which is more than twice the average of all monitored groundwater (1.3 milligrams per litre).
Monitored groundwater with nitrate concentrations that breach health standards are found in most regions, but are most common in the Waikato and Manawatū regions (Ministry for the Environment, in press b). In the Waikato, elevated nitrate concentrations have been attributed to intensive land uses such as dairying and market gardening in areas where free-draining soils overlie a shallow water table (Environment Waikato, 1998).
As well as affecting drinking water quality, excessive levels of nitrate in groundwater can lead to nutrient enrichment of downstream surface water. This has important implications for regional freshwater management, particularly because there can be a lengthy time lag between groundwater being polluted and its emergence at a downstream water body. For example, nitrogen levels in a lake may increase long after the activity responsible for delivering nitrogen into a catchment (such as intensive farming) has declined or ceased. This is because the groundwater entering the lake is still polluted from historical farming practices.
Trends in nitrate
There has been no clear nationwide trend in nitrate concentrations over recent years. Approximately equal numbers of monitored groundwater sites have shown increasing concentrations of nitrate (13 per cent) and decreasing concentrations of nitrate (11 per cent) over 1995–2006 (Ministry for the Environment, in press b).
At a regional scale, increasing trends of nitrate are more widespread in some areas than others. Increasing nitrate concentrations have been reported in rural parts of Canterbury, probably due to the increasing intensity of human activities in the region, such as dairy farming and wastewater disposal (Environment Canterbury, 2002). Increasing concentrations of nitrate have also been recorded at some Waikato sites for which records are available from the 1950s (Environment Waikato, no date).
Faecal pollution (bacteria) in groundwater
There are 520 groundwater monitoring sites that have sufficient data on bacteria levels to derive medians. Eighty per cent of these sites comply with New Zealand guidelines for drinking water quality of 1 bacteria coliform unit per 100 millilitres of water sampled (Ministry for the Environment, in press b). However, it is not known how many of these monitored groundwaters are used to supply human drinking water. (Of the drinking water supplies that are registered with the Ministry of Health, about 2 per cent exceeded the guidelines for E. coli between 2002 and 2004 (Ministry of Health, 2006)).
The drinking water standard is breached most commonly in Northland, Southland, and Canterbury (Ministry for the Environment, in press b).
Only 2 per cent of the monitored sites exceed the guidelines for stock drinking water quality (100 coliform units per 100 millilitres of water sampled).
Like nitrate, bacteria concentrations are highest in shallow, unconfined groundwater (Ministry for the Environment, in press b); faecal bacteria generally do not survive the long travel times needed to reach deeper groundwater. However, bacteria can be widely dispersed within shallow groundwater systems because these aquifers typically have relatively fast-flowing water and porous sediments.
Elevated concentrations of bacteria in groundwater are commonly attributable to faecal matter leaching from stock dung on the land surface, or from human waste disposal facilities such as septic tanks. However, high bacteria counts do not always represent general groundwater degradation. For example, poor groundwater bore design may allow faecal material from a localised source at the land surface (such as a farm animal defecating near the well head) to leak directly down the shaft.
Ninety per cent of the monitored groundwaters showed no change in concentrations of bacteria over 1995–2006.
Other information on groundwater quality
Regional councils also assess the quality of our groundwater in other ways. In particular, minerals, chemicals, and metals, such as sodium, chloride, sulphate, dissolved iron arsenic, dissolved manganese, and total dissolved solids are measured. Table 10.1 summarises the medians and ranges for these elements in monitored groundwater.
Table 10.1: National Medians and Ranges for Minerals, Chemicals, and Metals in Monitored Groundwater, 1995–2006
| Sodium | Chloride | Sulphate | Dissolved Iron | Dissolved Manganese |
Arsenic | Total Dissolved Solids |
|
|---|---|---|---|---|---|---|---|
| Median | 15 | 15.3 | 6.5 | 0.03 | 0.01 | 0 | 149 |
| Range (5th–95th percentile) |
4.6-117 | 2.8-142 | 0.1-44 | 0-5.5 | 0-3.6 | 0-0.24 | 64-950 |
| Guideline level (maximum recommended level) |
200 | 250 | 250 | 0.2 |
0.04 0.4* |
0.01* | 1,000 |
| Percentage of sites exceeding guideline (%) |
1.9% | 2.5% | 0% | 26.5% |
33% 15%* |
10.2% | 4.3% |
Notes:
- Units are in milligrams per litre.
- Guideline levels are for aesthetic quality defined by the drinking water standards for New Zealand unless otherwise stated (Ministry of Health, 2005).
- Numbers with asterisks (*) relate to health guidelines (drinking water standards for New Zealand maximum acceptable value (Ministry of Health, 2005)) not aesthetic quality.
Source: Adapted from Ministry for the Environment, in press b
Salinity
Concentrations of chloride, sodium, sulphate, and total dissolved solids are indicators of salinity. These exceed New Zealand drinking water standards for aesthetic quality at between 0 per cent and 5 per cent of the sites for which data is available (see Table 10.1).
High salinity, which may produce a salty taste, usually indicates that the groundwater is old, but it may also be associated with saltwater intrusion (the movement of salty water into fresh groundwaters) in low-lying coastal aquifers. Saltwater intrusion is a natural occurrence near the sea, but may worsen if too much water is withdrawn from coastal aquifers.
Although it is not widespread in New Zealand, saltwater intrusion is a serious resource management issue for local authorities in some coastal areas of Northland, Waikato (particularly in the Coromandel Peninsula), Manawatū, Tasman, and Canterbury (Ministry for the Environment, in press b).
Metals: iron and manganese
Dissolved iron and manganese concentrations exceed the New Zealand drinking water standards for aesthetic quality in 27 per cent and 33 per cent, respectively, of groundwater sites for which data is available (see Table 10.1).
Elevated concentrations of iron and/or manganese in groundwater are commonly caused by natural microbial processes (such as respiration by bacteria) or interaction with iron-rich sediments (such as peat), and can produce an unpleasant taste and stain and clog water supply pipes.
If ingested in high enough concentrations, manganese can also harm humans by damaging the respiratory tract and nervous system. Manganese concentrations exceed health-related guidelines at 15 per cent of monitored groundwater sites for which data is available (see Table 10.1).
Metals: arsenic
Arsenic concentrations exceed the drinking water standards of 0.01 milligrams per litre at 10 per cent of sites for which data is available (see Table 10.1). Adverse health effects such as skin cancers and lesions have been observed in populations that drink arsenic-contaminated water in countries such as Bangladesh and India. However, concentrations in these countries greatly exceed the concentrations encountered in New Zealand – sometimes being up to 350 times our national standard (Davies, 2001).
Arsenic in groundwater may originate from both human and natural sources. It is used in a variety of industries, including timber treatment (tanalising), agriculture (herbicides and insecticides), mining, smelting, and pulp and paper production.
Groundwater that spends a long time interacting with arsenicrich rock, particularly in geothermal areas, may have high arsenic levels. The extent to which natural processes or human activities cause elevated concentrations of arsenic in New Zealand groundwater is not clear.
Other metals
Other trace metals (such as cadmium, chromium, copper, nickel, lead, and zinc) are generally present in low concentrations in New Zealand groundwater and do not pose a risk to human health (Ministry for the Environment, in press b).
Pesticides
Pesticides, including herbicides, insecticides, and fungicides, are commonly used in agricultural activities. Inappropriate use of these agrichemicals may result in groundwater contamination. Drinking water that is contaminated with pesticides can be harmful to both people and stock.
Five national surveys of pesticides in groundwater have been conducted since 1990, the most recent of them in 2006. Note that the limitations of groundwater monitoring are particularly relevant for pesticide surveys. These are described in the box ‘Monitoring groundwater’ at the beginning of the section ‘Groundwater quality’. These surveys have focused on groundwater that is vulnerable to pesticide contamination; that is, shallow, unconfined groundwater in areas of known pesticide storage and application.
Of 163 groundwater bodies sampled in 2006, 19 per cent had detectable traces of pesticides. This proportion is comparable with earlier surveys, if differences between the survey methods are taken into account (Close et al, 2007).
The pesticide concentrations in all monitored groundwater in the 2006 survey, except one, complied with New Zealand drinking water standards and were similar to pesticide concentrations found during similar recent groundwater surveys in the United States (Close et al, 2007).
Groundwater in which pesticides have been detected usually also have elevated concentrations of nitrates. This further demonstrates the vulnerability of New Zealand’s shallow unconfined aquifers to pollutants leaching from land that is intensively used.
Freshwater demand (allocation)
In this section, current consumptive allocation is compared with historical allocation, the overall size of New Zealand’s renewable freshwater resource, and the amount of water flowing in our rivers.
Consumptive allocation does not include water used for electricity generation, because this water is normally returned directly to the water body from which it was taken; that is, it has a non-consumptive use.
More about allocation
Information on the amount of freshwater allocated from rivers, lakes, and groundwater aquifers is drawn from resource consents issued by regional councils (Ministry for the Environment, 2006c).
Allocation is usually granted as a maximum daily and/or weekly rate (that is, the maximum rate of water take (abstraction) that may be sustained in any given week), or as a maximum annual volume, or both. Weekly allocation rates are useful for understanding pressures on water demand that are related to seasonal activities (such as irrigation). Annual volumes are useful for understanding how much water is potentially used each year, irrespective of seasonal fluctuations in demand. In this report allocation figures are based on weekly rates.
Amount and use of allocated water
If all the water consents (see box ‘More about allocation’) are added together, the total allocation of water in New Zealand (in 2006) is 676 cubic metres every second (Ministry for the Environment, 2006c). The total allocation is equivalent to twice the average flow rate of the Waikato River. The Canterbury and Otago regions account for almost three-quarters of the total allocation, with 55 per cent and 18 per cent, respectively (Ministry for the Environment, 2006c).
On a per capita basis, it is estimated that the demand for water is two to three times higher in New Zealand than in most other OECD countries (Organisation for Economic Co-operation and Development, 2006). (This estimate is based on figures for total water use (including water used for economic development as well as domestic purposes) and is indicative only, because the methodologies for estimating water use differ between countries.)
Source of freshwater supply
Almost 20,000 resource consents are in place for taking water, 66 per cent of which are for groundwater takes (Ministry for the Environment, 2006c).
Figure 10.13 (left) reflects the even distribution of the river and stream network across the country and the relative ease with which water can be taken from surface water systems.
In contrast, consents for groundwater takes tend to be grouped together in areas where the water table is shallow and/or aquifers yield relatively high volumes of water (such as the gravel aquifers on the Canterbury Plains or the Auckland volcanic aquifers); that is, where it is most cost-effective to take groundwater (see Figure 10.13, right).
Figure 10.13: Distribution of Resource Consents for Surface Water and Groundwater, 2006

Image: Source: Adapted from Ministry for the Environment, 2006c.
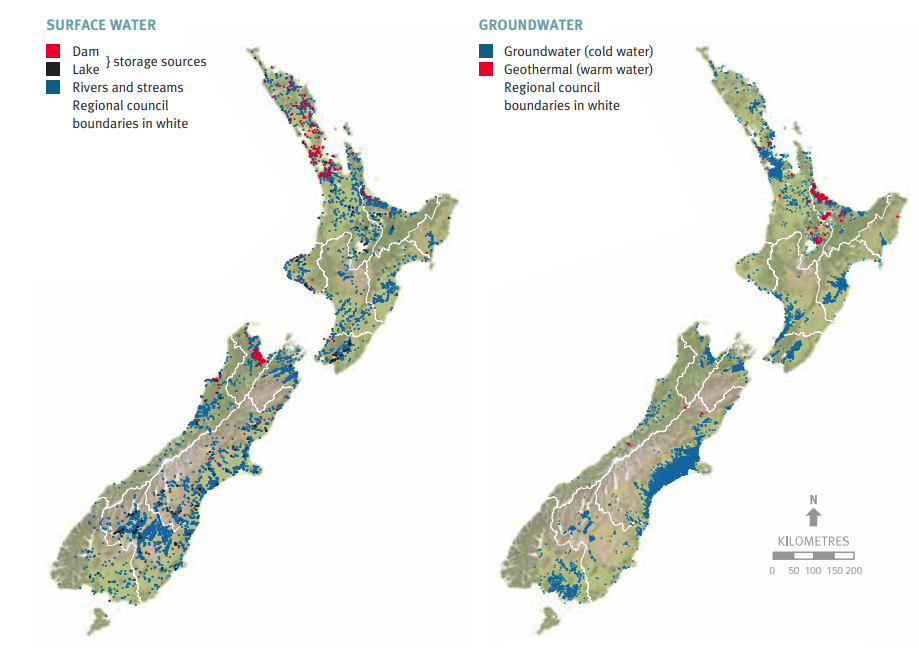
Image: Source: Adapted from Ministry for the Environment, 2006c.
Although the majority of consents are for water from groundwater sources, the volume of water taken from surface water sources is higher. Sixty per cent of the total volume of water allocated comes from surface water sources, 34 per cent from groundwater, and 6 per cent from storage sources such as lakes and dam reservoirs.
There is considerable variation between regions in the proportions allocated from surface, ground, and storage sources. While storage sources contribute a relatively low proportion of the total national water allocation, in some regions (such as Auckland and Gisborne) reservoirs are the major source of supply.
Use of freshwater
As shown in Figure 10.14, on a national basis, 77 per cent of the total weekly allocation is used for irrigation, which is slightly higher than the global average of 70 per cent (Organisation for Economic Co-operation and Development, 2006). The remainder is shared among public water supply, manufacturing and industry, and stock watering. The use of water by manufacturing and industry and for public supply is generally low in New Zealand compared with more populous countries in Europe and North America, and represents a relatively small part of the overall demand in New Zealand.
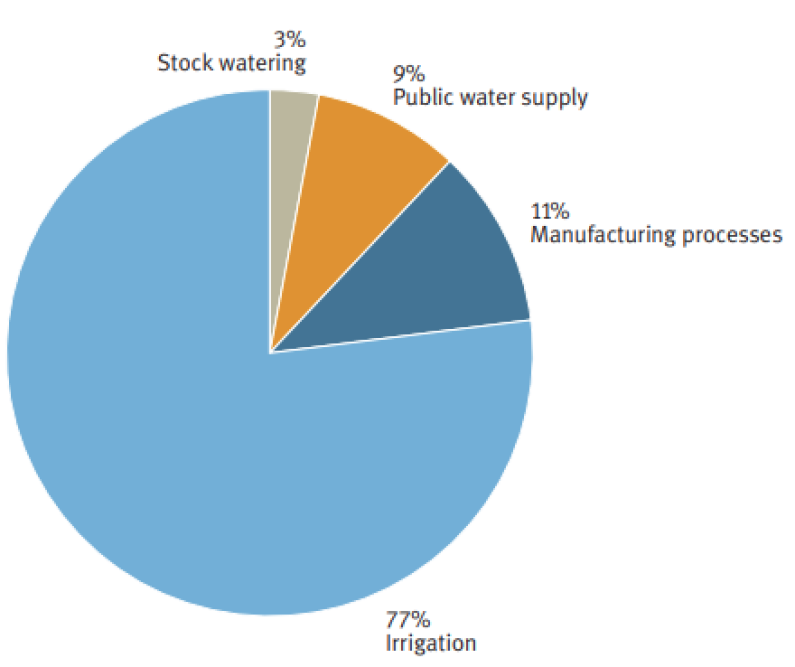
Image: Data source: Ministry for the Environment, 2006c
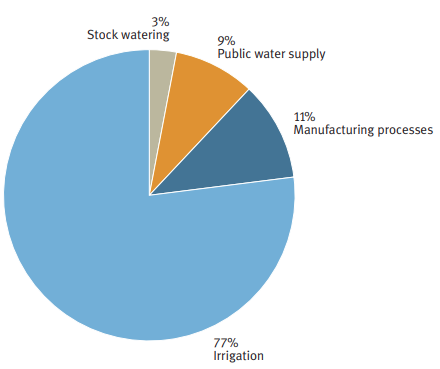
Image: Data source: Ministry for the Environment, 2006c
Regional variations in the use of water are shown in Figure 10.15. In Canterbury, Marlborough, and Tasman, irrigation accounts for more than 80 per cent of water allocations. Water taken for industrial uses makes up a relatively large proportion of the total allocation in Auckland, Waikato, Taranaki, the West Coast, and Southland. Allocations for stock drinking water are underestimated in Figure 10.15, because this is generally a permitted activity under the Resource Management Act 1991 (that is, it does not require a resource consent), so full fi gures for stock drinking water allocations are not available.
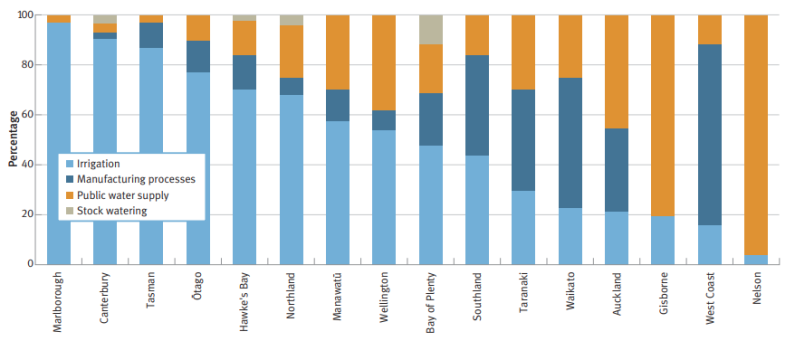
Image: Data source: Ministry for the Environment, 2006c.

Image: Data source: Ministry for the Environment, 2006c.
In most cases, consent holders do not use the full volume of water they are allowed under the consent. The proportion of actual water used is highly variable. Regional consents indicate that actual use typically ranges from 20 per cent to 80 per cent of the allocated volumes (Ministry for the Environment, 2006c). Demand for water varies according to factors such as the time of year, the crop type, and the growth stage of the crop. Use of allocated water often declines in the margins of the irrigation season (that is, early and late in the growing season).
Allocation compared with renewable freshwater resource
Compared internationally, New Zealand has an abundance of freshwater. It is ranked 12th out of 193 countries, on a per capita basis, for the size of its renewable freshwater resource (United Nations Educational, Scientific and Cultural Organization, 2006). Within New Zealand, allocated water comprises less than 5 per cent of its renewable freshwater resource (Ministry for the Environment, 2006c).
However, not all of the renewable resource is actually available to be used – much of it needs to be retained in the rivers, lakes, and aquifers to maintain the various values of these water bodies (such as ecological, recreational, and cultural values). Furthermore, water is not always in the right place at the right time for users. A large proportion of New Zealand’s annual rainfall occurs in winter, when demand is relatively low.
Figure 10.16 shows the water allocated from surface water sources relative to the mean (average) annual low flow of rivers. The figure highlights the difference in water availability and demand between the western and eastern regions of New Zealand.
Several eastern regions (Hawke’s Bay, Wairarapa, Marlborough, Tasman, Canterbury, and Otago) have surface water catchments that are highly allocated (that is, 20 per cent to 50 per cent of the river flow during low flow periods is allocated to users). Therefore, rivers in these catchments are likely to be under pressure during the drier parts of the year. In these regions, closer regard to managing water resources is required to ensure water takes do not adversely affect aquatic ecosystems or other water users. For example, resource consents may have conditions that restrict water take when river flows are low.
Figure 10.16: Allocation of Surface Water as a Percentage of Average Annual Low Flow of Rivers, 2006
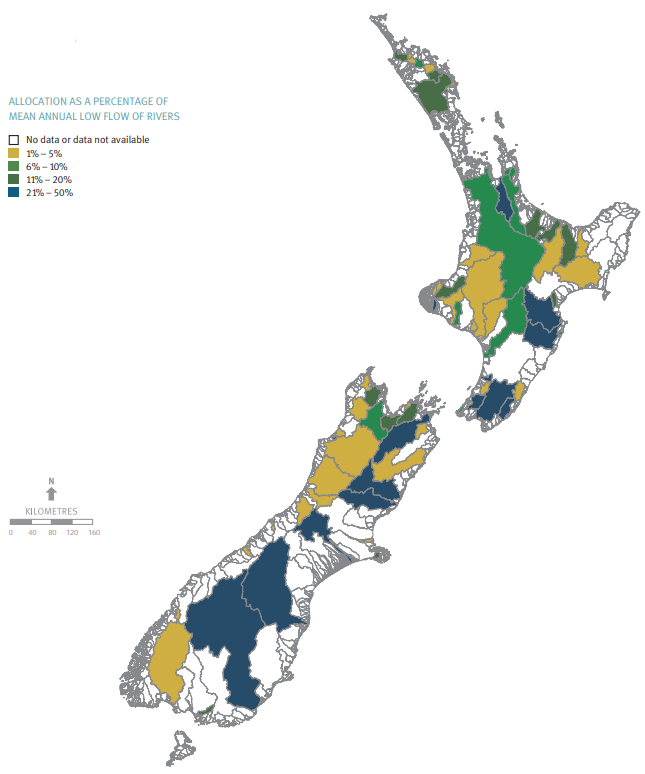
Image: Source: Adapted from Ministry for the Environment, 2006c.

Image: Source: Adapted from Ministry for the Environment, 2006c.
Trends in allocation and irrigated area
Total water allocation in New Zealand increased by 50 per cent between 1999 and 2006. Over this period, allocation increased by almost 80 per cent and 40 per cent from groundwater and surface water sources, respectively, while allocation from storage sources tripled (Ministry for the Environment, 2006c). Figure 10.17 shows that allocation increased in all regions except Northland. This is likely to reflect changes in the way resource consent information is held, rather than an actual reduction in demand for water in the Northland region.
The increase in total water allocation in New Zealand between 1999 and 2006 can largely be explained by the increase in demand for irrigation. The amount of consented irrigated land in New Zealand increased by 52 per cent over this period, which was an annual rate of increase of 7 per cent.
Figure 10.17 shows that in terms of total land area, the biggest increases in irrigation occurred in Canterbury, Otago, Hawke’s Bay, and Marlborough. However, relative to the land irrigated in 1999, the regions with the biggest rate of growth are Southland, Wellington, Bay of Plenty, and the Waikato; irrigated land areas have at least doubled between 1999 and 2006 in these regions.
In 2006, the area of total consented irrigated land in New Zealand was just over 970,000 hectares, the majority of it in Canterbury (66 per cent) and the second largest amount in Otago (14 per cent).
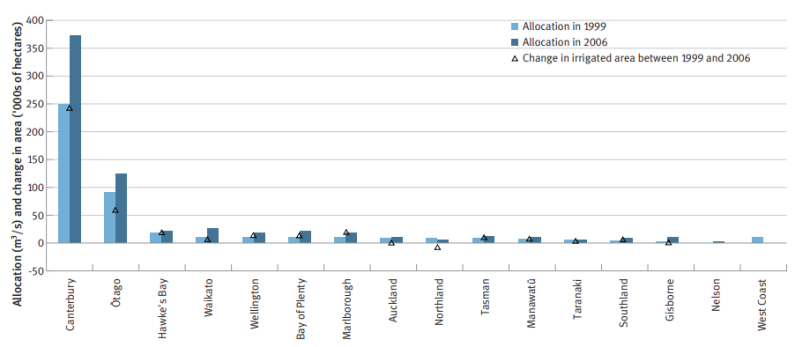
Image: Data source: Ministry for the Environment, 2000; Ministry for the Environment, 2006c.

Image: Data source: Ministry for the Environment, 2000; Ministry for the Environment, 2006c.
Notes:
- Data was not available for Nelson or the West Coast in 1999.
- The consented irrigated area will differ from the actual irrigated area in any given year because land owners may not irrigate all the land for which they hold a consent.
- m3/s = cubic metres per second.
GOVERNMENT ACTION to manage freshwater demand
The Sustainable Water Programme of Action
The Sustainable Water Programme of Action (see box ‘Government action to manage freshwater quality’) is presently developing policy to improve the management of freshwater demand and allocation.
A national policy statement on freshwater as well as two national environmental standards are under development in 2007: one standard will make the measurement of significant water takes (that is, metering of actual water use) mandatory and the other standard will ensure appropriate methods are used to allocate water so the health of aquatic ecosystems is safeguarded (that is, ensuring appropriate minimum flows remain in river, stream, and groundwater bodies).
LOCAL ACTION to manage freshwater demand
Allocation management in the Tasman region
Tasman District Council has taken an integrated catchment management approach to set allocation limits for many of its more highly used freshwater systems. This means numerical computer models and targeted flow investigations of both aquifers and rivers have been used together to set allocation limits that recognise the connection (that is, exchange of water) between surface and groundwater bodies.
Tasman District Council actively promotes and supports water user groups (whose members include farmers, growers, and other significant users) in the region during droughts and in the process of refining current water management plans.
The 1997 report, The State of New Zealand’s Environment 1997, concluded that:
The main pressures on water flows have been from drainage and channelisation (which have reduced wetlands and altered the natural character of rivers including lowland aquatic habitats), deforestation (which has intensifi ed flooding and sedimentation in steep catchments), and increasing demand for urban water supplies, livestock and irrigation. …Responses to water flow problems that historically focused on flood control and drainage works downstream and on increasing the supply of drinking and irrigation water are now looking more to whole catchment approaches involving afforestation and water conservation. …
The main sources of pressure on water quality are non-point source pollution (from diffuse pasture runoff of animal wastes, fertiliser and sediments as well as runoff of pollutants from paved surfaces in urban areas) and point source discharges (e.g. from factories and sewage outfalls). …
The quality of our water is high by international standards, except in some low-lying rural streams and small lakes, some shallow groundwaters, and some piped water supplies. …
Responses to water quality problems have successfully focused on improving point source discharges (from sewage, factory, and dairyshed outfalls) but the more diffi cult and pervasive problem of non-point source discharges has yet to be addressed and will require changes in land management.
(Ministry for the Environment, 1997, chapter 10.)
Increasing demand for freshwater
Increasing demand for freshwater was identifi ed in 1997 as one of the main pressures on water quantity and flows. Two national surveys since 1997 have confi rmed that demand is increasing (it rose 50 per cent between 1999 and 2006), primarily in response to large increases in irrigation. This is particularly evident in areas that are already short of water.
While water is generally in good supply in most regions, many large river and aquifer systems are now fully allocated (that is, no further water can be taken from them without causing environmental harm or affecting existing users). The increase in demand has prompted consent authorities to put greater emphasis now than in 1997 on the management of water takes.
Protecting New Zealand’s water bodies
Water conservation orders continue to be used as a mechanism to protect New Zealand’s water bodies by placing restrictions or prohibitions on water takes, discharges, and other uses. Six water conservation orders have been gazetted since 1997, bringing the total to 14. Orders have been gazetted in the last decade for the Kawarau (1997), Mataura (1997), Buller (2001), Motueka (2004), Möhaka (2004), and Rangitata (2006) rivers.
Pressures on water quality
Water quality in New Zealand is still generally good by international standards, and a large proportion of our water resources remain free of land-use pressures. Nevertheless, water quality continues to decline in areas that are dominated by agricultural and urban land use.
A key source of pressure on water quality in New Zealand in 1997 was identifi ed as point-source pollution (for example, discharges from factories and wastewater treatment plants). While discharges from point-sources remain a significant influence on water quality in some areas, at the national level this source of pollution has largely been addressed through improved management of discharges from sewerage plants, meatworks, and farm effluent ponds. This is illustrated by a steady reduction in the levels of organic wastes in rivers.
Today, the primary pressure on the quality of our freshwater is intensive agricultural and urban land use. Increasing pollution from non-point-sources, such as diffuse run-off from pasture and from paved surfaces in urban areas, poses the greatest challenge for water management in New Zealand.
As was the case in 1997, the poorest water quality is found in streams and rivers, small lakes, and shallow groundwaters in modified catchments. While the levels of nutrients in our most polluted rivers are only about half the OECD average, nutrient enrichment has increased in some water bodies in catchments that are subject to intensive land use. In particular, there has been a nationwide pattern of increasing levels of total nitrogen and dissolved phosphorus in rivers in the national monitoring network.
Improving land and water management
In 1997, it was noted that management responses to the pressures on water quality from intensive land use and nonpoint-sources of pollution had been limited. Since then, local government, central government, and industry have invested significant resources in policy and education programmes and other initiatives that emphasise improved land and water management. The more important management responses of the last decade are discussed below.
Integrated approaches to freshwater management
Since 1997, there has been a shift at a regional level towards a more integrated approach to freshwater management. Many councils now have integrated land and water plans (within their regional plans), which put greater emphasis on protecting water quality and environmental flows through sustainable land use. For example, the Bay of Plenty Regional Council has a Land and Water Plan and the Manawatü–Wanganui Regional Council has a proposed ‘One Plan’
In the last decade, local government has also placed greater emphasis in freshwater management, developing partnerships with community groups (including land owners – see box ‘Local action on riparian planting in Taranaki’), industry, and central government. Council-led programmes to protect and restore the water quality of Lake Taupö and the Rotorua Lakes are examples of this integrated approach (see box ‘Local action to protect water quality in Lake Taupö and the Rotorua lakes’ in the ‘Current state and trends’ section of this chapter).
LOCAL ACTION on riparian planting in Taranaki
Taranaki Regional Council is one of many councils working with farmers to develop sustainable land management and riparian planting plans. Up to June 2007, 12,400 kilometres of stream bank and 60 per cent of all dairy farms in the region were covered by riparian plans.
By the same date, more than 1 million plants had been provided to farmers by the Council, at cost, for land and riparian planting.
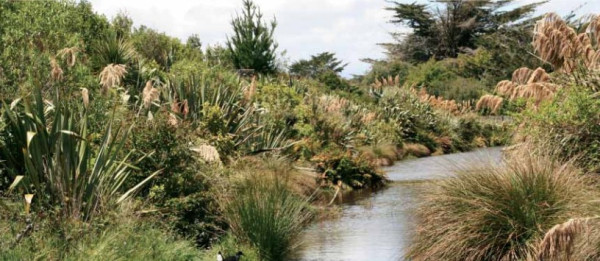
Riparian Planting on a Stream in Taranaki
Source: Courtesy of Taranaki Regional Council.
Sustainable Development Water Programme of Action
In 2003, the Sustainable Development Water Programme of Action was established by central government. The focus of the programme in 2007 is developing a national policy statement on freshwater, as well as two national environmental standards. One of these standards is intended to ensure appropriate methods are used to set ecological flows (that is, the minimum flow needed in a river to support aquatic ecosystems). The other standard will make measurement of significant water takes (that is, measurement of actual water use) mandatory.
Improved management by primary production sector
Since 1997, the main primary production sectors in New Zealand (dairy, horticulture, forestry, and the arable food industry) have produced or substantially revised their sustainable management strategies and environmental codes of practice. As well as setting targets and codes of practice for minimising ecosystem damage from sector activities, these strategies identify research and development needs within each sector to improve environmental sustainability.
Specific objectives for protecting water quality and flows include research into agrichemicals and nutrient run-off, on-farm mitigation and planning tools (such as nutrient and water budgeting), and forest harvesting techniques.
The 2003 Dairying and Clean Streams Accord is another example of an industry-led approach to improved land use and water quality management (see box ‘More about the Dairying and Clean Streams Accord’).
More about the Dairying and Clean Streams Accord
A voluntary agreement, the Dairying and Clean Streams Accord, was signed by Fonterra Co-operative Group (the largest dairy company in New Zealand), regional councils, and the Ministers for the Environment and of Agriculture and Forestry in May 2003. The accord’s aim is to achieve clean, healthy waterways in dairying regions.
The accord sets practical targets for farmers; for example, that ‘50 per cent of regular stream crossing points are to have bridges or culverts by 2007 and 90 per cent by 2012’. This target has already been met, according to annual progress reports, while there has also been a steady increase in the number of waterways that stock have been excluded from (up from 67 per cent in 2003–2004 to 75 per cent in 2005–2006, with the same targets as for stream crossing points). However, the level of non-compliance of discharges of dairyshed effluent (33 per cent) falls significantly short of the target set (Ministry for the Environment, 2007).
Guidelines and standards for freshwater management
Various non-regulatory guidelines and standards have been published since 1997 to help resource managers assess the quality and quantity of New Zealand’s freshwater. These include guidelines to protect ecosystems and the recreational and aesthetic values of freshwaters, guidelines to assess the risk of human disease from recreation (for example, swimming) in fresh and coastal waters, and drinking water standards to set maximum acceptable levels for chemicals and bacteria in drinking water (see box ‘Government action to manage freshwater quality’ in the ‘Current state and trends’ section of this chapter).
To incorporate Māori values more fully in freshwater management, a Cultural Health Index has been developed. The index provides additional information on stream health by drawing on local knowledge about waterways (see box ‘More about iwi monitoring of freshwater: Cultural Health Index’).
More about iwi monitoring of freshwater: Cultural Health Index
The Cultural Health Index for Streams and Waterways (CHI) is a tool developed by Ngāi Tahu, supported by the Ministry for the Environment, Te Rūnanga o Ngāi Tahu, and Ngāi Kahungunu. Its purpose is to facilitate the monitoring of waterways by Māori (Ministry for the Environment, 2003).
Developed as the result of research undertaken on the Taieri, Kakaunui, Hakatere (Ashburton), and Tukituki rivers, the CHI gives iwi/hapū the opportunity to assess and report on the cultural health of a catchment or stream in their area. The CHI provides a clear basis for iwi/hapū to assign priorities for the management or restoration of specific sites and monitor changes and improvements in them over time. It also provides a common platform for resource management agencies and iwi/hapū to discuss and incorporate Māori perspectives and values for stream health in management decisions.
The CHI works by assessing and providing a ‘score’ for three aspects of the monitored waterway:
- the significance of the freshwater site to Māori
- the cultural use values of the site
- the health of the stream or river
The first measure assesses whether the site is of traditional or contemporary significance to Māori. It also evaluates whether Māori would return to the site in the future given its present state.
The second measure assesses the ability of the site to sustain cultural use. To do the assessment, the CHI identifies mahinga kai species present at the site, compares them with traditional mahinga kai sourced from the site, evaluates how easy it is for Māori to access the site, and determines whether or not Māori would return to use the site in the future. The four elements are then averaged to produce a single score.
The third measure assesses stream or river health by considering eight different criteria: water quality, water clarity, flow and habitat variety, catchment land use, riparian vegetation, riverbed condition/sediment, use of riparian margin, and channel modification. The scores for each criteria are averaged to produce a final stream health score.
Training hui have been held throughout New Zealand to introduce whānau, hapū and iwi to the CHI system and to facilitate its use.
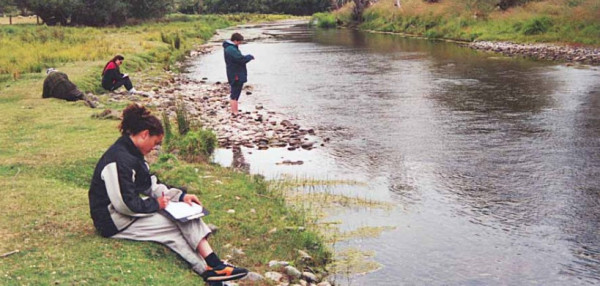
A Team Monitoring Stream Health Using the Culture Health Index.
Source: Courtesy of Gail Tipa.
Other national guidelines have been published to help promote best practice and increase consistency in freshwater monitoring and management across the country. These include guidelines for monitoring algae growth and the health of freshwater macroinvertebrate (insect) communities.
Expansion of freshwater monitoring
Ten years ago, many freshwater monitoring programmes had only recently been established by councils and other agencies. Relatively few monitoring records were available to show how water quality was changing over time. Today, several monitoring programmes yield data records of sufficient length to show trends and, most importantly, distinguish natural changes from those that are likely to have been caused by human activities.
Monitoring programmes have expanded to cover a wider crosssection of water environments than those monitored in 1997 (for example, the number of lakes regularly monitored has almost doubled since 1997).
There is also greater emphasis now on using measures of aquatic biology (such as the number and health of fish and macroinvertebrates) to assess overall freshwater ecosystem health, as well as using traditional chemical and physical measurements of water quality.
Future focus for freshwater management
In the future, water pollution from intensive urban and rural land use and water allocation will continue to be the focus of freshwater management in New Zealand. Balancing the competing needs of water users – recreational users, town water suppliers, hydro-electricity generators, tourist operators, and farmers – is likely to grow in urgency.
Climate change, recognised as a cause for concern to water managers in 1997, is also likely to feature more strongly in decision-making in some areas of New Zealand, particularly for water allocation (see box ‘More about climate change and freshwater’ in the Introduction to this chapter).
Australia and New Zealand Environment and Conservation Council. 2000. Australian and New Zealand Guidelines for Fresh and Marine Water Quality. Wellington and Canberra: Australia and New Zealand Environment and Conservation Council.
Burns, N M, Bryers, G, and Bowman, E. 2000. Protocol for Monitoring Trophic Levels of New Zealand Lakes and Reservoirs.Wellington: Ministry for the Environment.
Close, M E, Flintoff, M J, and Gaw, S. 2007. National Survey of Pesticides in Groundwater in New Zealand 2006, unpublished.
Davies, H. 2001. Groundwater and health. In Rosen, M R, and White, P A (eds). Groundwaters of New Zealand, chapter 10. Wellington: New Zealand Hydrological Society.
Davies-Colley, R J, Cameron, K, Francis, G, Bidwell, V, Ball, A, and Pang, L. 2003. Effects of rural land use on water quality, unpublished, prepared for the Ministry for the Environment. Wellington: Ministry for the Environment.
Davies-Colley, R J, Nagels, J W, Smith, R, Young, R, and Phillips, C. 2004. Water quality impacts of a dairy cow herd crossing a stream. New Zealand Journal of Marine and Freshwater Research vol 38, no 4, pp 569–576.
Environment Canterbury. 2002. Nitrate Concentrations in Canterbury Groundwater: A Review of Existing Data. Christchurch: Environment Canterbury.
Environment Southland. 2000. State of Environment Report for Water. Invercargill: Environment Southland.
Environment Waikato. 1998. Waikato State of the Environment Report 1998. Hamilton: Environment Waikato.
Environment Waikato. 2004. Trends in River Water Quality in the Waikato Region, 1987–2002. Hamilton: Environment Waikato.
Environment Waikato. No date. Nitrate in Groundwater, Retrieved from http://www.ew.govt.nz/enviroinfo/indicators/inlandwater/ groundwater/gw1/report.htm (6 April 2007).
Gisborne District Council. No date. Water Resources and Management. Retrieved from http://www.gdc.govt.nz/ Environment/Water/Rivers/WaterResourcesManagement.htm(7 April 2006).
Hamill, K, and McBride, G. 2003. River water quality trends and increased dairying in Southland, New Zealand. New Zealand Journal of Marine and Freshwater Research vol 37, no 2, pp 323–332.
Hill Young Cooper Ltd. 2006. Improving the management of freshwater resources: Issues and opportunities, unpublished. Prepared for the Ministry for the Environment: Wellington.
Institute of Environmental Science and Research 2006. Environmental Health Indicators for New Zealand: Annual report 2006. Prepared by the Institute of Environmental Science and Research for the Ministry of Health. Wellington: Ministry of Health.
Ministry for the Environment. 1997. The State of New Zealand’s Environment 1997. Wellington: Ministry for the Environment and GP Publications.
Ministry for the Environment. 2000. Information on Water Allocation in New Zealand. Wellington: Ministry for the Environment.
Ministry for the Environment. 2002. A review of urban catchment management and environmental impacts, unpublished. Wellington: Ministry for the Environment.
Ministry for the Environment. 2003. A Cultural Health Index for Streams and Waterways: Indicators for Recognising and Expressing Māori Values. Wellington: Ministry for the Environment.
Ministry for the Environment. 2005a. Nationwide and Regional State and Trends in River Water Quality 1996–2002. Wellington: Ministry for the Environment.
Ministry for the Environment. 2005b. Wai Ora: Report of the Sustainable Water Programme of Action Consultation Hui. Wellington: Ministry for the Environment.
Ministry for the Environment. 2006a. Assessment of the national pool of river water quality monitoring sites using the River Environment Classifi cation, unpublished. Wellington: Ministry for the Environment.
Ministry for the Environment, 2006b. Snapshot of Lake Water Quality in New Zealand. Wellington: Ministry for the Environment.
Ministry for the Environment, 2006c. Snapshot of Water Allocation in New Zealand. Wellington: Ministry for the Environment.
Ministry for the Environment. 2006d. State and Trends in the National River Water Quality Network (1989–2005). Wellington: Ministry for the Environment.
Ministry for the Environment. 2006e. Using the Cultural Health Index: How to assess the health of streams and waterways. Te Whakamahi i te Kuputohu Hauora Ahurea: Me Pēhea tearotake i te hauora o ngā pūkaki me ngā awa wai. Wellington: Ministry for the Environment.
Ministry for the Environment. 2007. The Dairying and Clean Streams Accord: Snapshot of Progress: 2005/2006. Wellington: Ministry for the Environment.
Ministry for the Environment. In press a. An Assessment of Regional Council Water Quality Data (1996–2002) in Support of National State of Environment Reporting, unpublished. Wellington: Ministry for the Environment.
Ministry for the Environment. In press b. Groundwater Quality in New Zealand: State and trends 1995–2006. Wellington: Ministry for the Environment.
Ministry for the Environment. In press c. Lake Water Quality in New Zealand: Status in 2006 and recent trends 1990–2006. Wellington: Ministry for the Environment.
Ministry for the Environment and Ministry of Health. 2003.Microbiological Water Quality Guidelines for Marine and Freshwater Recreational Areas. Wellington: Ministry for the Environment and Ministry of Health.
Ministry of Health. 2005. Drinking-water Standards for New Zealand 2005. Wellington: Ministry of Health.
Organisation for Economic Co-operation and Development. 2006. Environmental Data Compendium. Paris: Organisation for Economic Co-operation and Development.
Tasman District Council. 2005. State of the Environment: Summary report 2005. Nelson: Tasman District Council.
Taranaki Regional Council. 2006. Trends in the Quality of Surface Waters in Taranaki. Stratford: Taranaki Regional Council.
United Nations Educational, Scientifi c and Cultural Organization. 2006. The 2nd UN World Water Development Report: ‘Water: A shared responsibility’. Retrieved from http://www.unesco.org/ water/wwap/wwdr2 (7 April 2007).
White, P A. 2001. Groundwater resources in New Zealand. In Rosen, M R, and White, P A (eds). Groundwaters of New Zealand, chapter 3. Wellington: New Zealand Hydrological Society.
Chapter 10: Freshwater
December 2007
© Ministry for the Environment