Our distinctive plants and animals have strongly shaped our national identity.
Biodiversity in New Zealand
New Zealand’s varied landscapes and unique native plants and animals have helped shape our national character and cultural identity. Biodiversity helps to sustain the ecosystems that support the country’s primary production and tourism sectors.
Internationally, New Zealand is regarded as a significant contributor to global biodiversity, with an estimated 80,000 species of native animals, plants, and fungi. A comparatively large proportion of these are endemic – they do not occur naturally anywhere else on earth.
Pressures on biodiversity
Since humans arrived in New Zealand, the country has experienced one of the highest species extinction rates in the world, due to the loss of habitats and the introduction of pest plants and animals. Today, almost 2,500 native land-based and freshwater species are listed as threatened. The effects of climate change may further exacerbate pressures on our most endangered species.
Freshwater biodiversity is affected by surrounding land use and water quality. Invasive freshwater species such as the alga didymo (Didymosphenia geminata) pose risks for freshwater biodiversity.
Native land cover
About 44 per cent of New Zealand’s land area is covered by native vegetation, most of which is in hill country and alpine areas. Less native vegetation remains in lowland areas; this has implications for species that need this type of habitat to survive.
Between 1997 and 2002, it is estimated that native land cover decreased by 16,500 hectares (0.12 per cent). This total decrease included an increase of 700 hectares of non-vegetative native cover, such as sand and gravel, and a decrease of 17,200 hectares of native vegetative cover. These changes either occurred through conversion of land to other uses, or as a result of natural processes.
It is estimated that wetland areas have reduced by 90 per cent from their original area. New Zealand has designated six wetlands as having global importance under the Ramsar Convention on Wetlands (an inter-governmental treaty signed in 1971). Together, these Ramsar wetlands cover a surface area of 39,068 hectares.
Legally protected areas
By international comparison, a large proportion (just over 32 per cent) of New Zealand’s land area is legally protected for conservation purposes, either as public conservation land (8.43 million hectares) or through conservation initiatives on private land (221,473 hectares). The area of public conservation land has increased by 4.56 per cent between 2004 and October 2007. Private land under legal protection has increased by just over 51 per cent between 2004 and 2006.
However, some of our land environments and the ecosystems they contain, for example wetland and lowland ecosystems, are not well represented among the legally protected areas.
Distribution of selected native species
The distribution of the selected native species discussed in this chapter (the lesser short-tailed bat, kiwi, kōkako, kākā, mōhua, wrybill, and dactylanthus) has decreased over time on a national scale.
Some of our more common native birds have shown an increase in distribution in recent years (27 out of 96 observed species). The same percentage (28 per cent) reduced in distribution between 1985 and 2004. Ninety-three per cent of these were endemic species.
Decreases in distribution since the 1970s are largely due to the impacts of introduced pest species, rather than habitat loss.
Present and future pest management
Pest management efforts have intensified over the last decade, and areas receiving ongoing management have increased for all major targeted pests. For instance, between 2000 and 2006, areas targeted for possum management by the Department of Conservation increased by 60 per cent. Areas targeted by the Animal Health Board have increased by 40 per cent since 2001. Together, areas targeted by the Department of Conservation and the Animal Health Board for possum management equate to around 37 per cent of New Zealand’s land area.
Introduced animal pest and weed species remain a serious threat to New Zealand’s endangered native plants and animals. Over the last decade, increasing priority has been given to controlling pests in the habitats of the most threatened native species, and to stopping unwanted species coming into the country.
While offshore island reserves continue to protect many of our rarest species, sanctuaries on the mainland are increasingly aiming to match that level of protection. Attention has also turned to the protection of endangered native species and ecosystems on private land.
In the future, conservation priorities are likely to continue to focus on improved pest control and biosecurity, and on increasing legal protection for the land environments and ecosystems that are currently under-represented.
Biological diversity, or biodiversity, is the variety of biological life on earth.
Biodiversity comprises:
- genetic diversity – the genetic variety among individuals of a single species
- species diversity – the variety of species within a particular geographical area
- ecological diversity – the variety of ecosystems (such as forests, deserts, wetlands, grasslands, streams, lakes, and oceans), the communities within these, and the interactions between them.
This chapter covers native land-based and freshwater biodiversity. Marine biodiversity is discussed in chapter 11, ‘Oceans’.
Biodiversity in New Zealand
Given the wealth and uniqueness of New Zealand’s biodiversity, the country is internationally regarded as ‘one of the richest and most threatened reservoirs of plant and animal life on earth’ (Conservation International, 2007).
New Zealand makes an important contribution to global biodiversity, with an estimated 80,000 species of native animals, plants, and fungi. We have comparatively few native flowering plants and land-based vertebrates (animals with backbones).
High proportion of endemic species
As a result of 80 million years of evolution in isolation from other land masses, a large number of New Zealand’s native species are endemic – meaning they do not naturally occur anywhere else in the world (Organisation for Economic Co-operation and Development, 2007). All our frogs and reptiles, more than 90 per cent of our insects, about 80 per cent of our vascular plants (plants other than mosses, liverworts, and hornworts), and a quarter of our bird species are found only in New Zealand. By comparison, Great Britain, which separated from continental Europe only 10,000 years ago, has only two endemic species – one plant and one animal.
Cultural importance
New Zealand’s biodiversity is important for other reasons as well. Our natural landscapes and unique native plants and animals have strongly shaped our national identity. For many, our distinctive flora and fauna contribute to our sense of belonging to this land. New Zealanders take pride in calling themselves ‘Kiwis’ after one of the country’s most well-known native birds.
Our native species are culturally important to Māori. For example, Māori have traditionally used a variety of native berries, roots, and fruits for food, for dyes and stains, and as medicines. The flowering and fruiting of some native species guided traditional planting and harvesting times and rāhui (periods when harvesting is restricted to allow a resource to regenerate).
Why biodiversity matters
New Zealand’s ecological biodiversity performs a number of important services: our ecosystems provide clean air and water, help decompose wastes and recycle nutrients, maintain healthy soils, aid pollination, regulate local climates, and reduce flooding. These ecosystem services help sustain the country’s primary production – farming, forestry, viticulture, and horticulture. One study valued the ecosystem services provided by nature each year at $46 billion (Patterson and Cole, 1999). Tourism in New Zealand depends largely on the conservation of our ecosystems.
To many people, the variety of natural life also has an ‘intrinsic value’ in its own right, independent of its usefulness to human society.
More about New Zealand’s known native species
There are an estimated 80,000 native species in New Zealand. Almost 55,000 of these have been identified, and about
30,000 have been scientifically described, named, and classified. Table 12.1 shows the number of native species currently
known1 in New Zealand.
Table 12.1: Number of known native species in New Zealand, 2007
| Group | Marine | Land-based | Freshwater |
|---|---|---|---|
| Bacteria2 | 40 | 309 | 341 |
| Protozoa (single-celled eukaryotes – organisms whose cells have membrane-bound nuclei) | 1,663 | 671 | 465 |
| Chromista (group of eukaryotes other than protozoa) | 855 | 158 | 922 |
| Plants | 626 | 5,165 | 1,107 |
| Fungi3 | 3 | 6,781 | 255 |
| Animals | 12,637 | 20,337 | 2,410 |
| Total4 | 15,824 | 33,421 | 5,500 |
Data source: Adapted from Gordon (ed), 2007.
Notes:
1 This includes the numbers of described species plus known species that have not yet been described.
2 The numbers given for bacteria are based mainly on cultured species in New Zealand. Some of these have not been broken down according to their environment; most are land-based.
3 The numbers given for aquatic species of fungi are approximate.
4 The totals provided do not equal the sum of the rows as there is some overlap due to different life-history stages in different environments (for example, aquatic larval stages and land-based adult stages).
Factors affecting biodiversity
New Zealand has experienced one of the highest extinction rates in the world (Hitchmough et al, 2002). Today, almost 2,500 known land-based and freshwater species of animals, plants, and fungi are classified as threatened in New Zealand.
Human settlement and landscape transformation
Before human settlement, New Zealand was largely forested below the alpine tree line. However, in little more than 1,000 years, much of the country’s landscape and ecosystems have been transformed. Fires, land clearance, intensive use of natural resources, and introduced plants and animals have had a cumulative effect on New Zealand’s native biodiversity.
While almost half of the native habitats and ecosystems that existed before human settlement remain in some form today, many of them have been modified. Most of the remaining unmodified habitats are in remote or mountainous areas or onoffshore islands (Ministry for the Environment, 2004). Many of them have been (or still are) under pressure from introduced animal pests and weeds.
Over the past 200 years, much of New Zealand’s most accessible and productive land has been cleared or modified for a range of different land uses, such as agriculture, horticulture, roading, and human settlement. As a result, many of our lowland and coastal forests, lowland grasslands, wetlands, dune lands, and estuaries have been modified. These habitats and ecosystems are particularly at risk of being modified further if they occur on, or are adjacent to, prime agricultural and horticultural land (Ministry for the Environment, 2004).
Many of our lakes, rivers, and streams have been modified by dams, drainage, and irrigation schemes. Some of them are also affected by pollution from agricultural and urban areas, which alters the ecological processes that support downstream freshwater biodiversity.
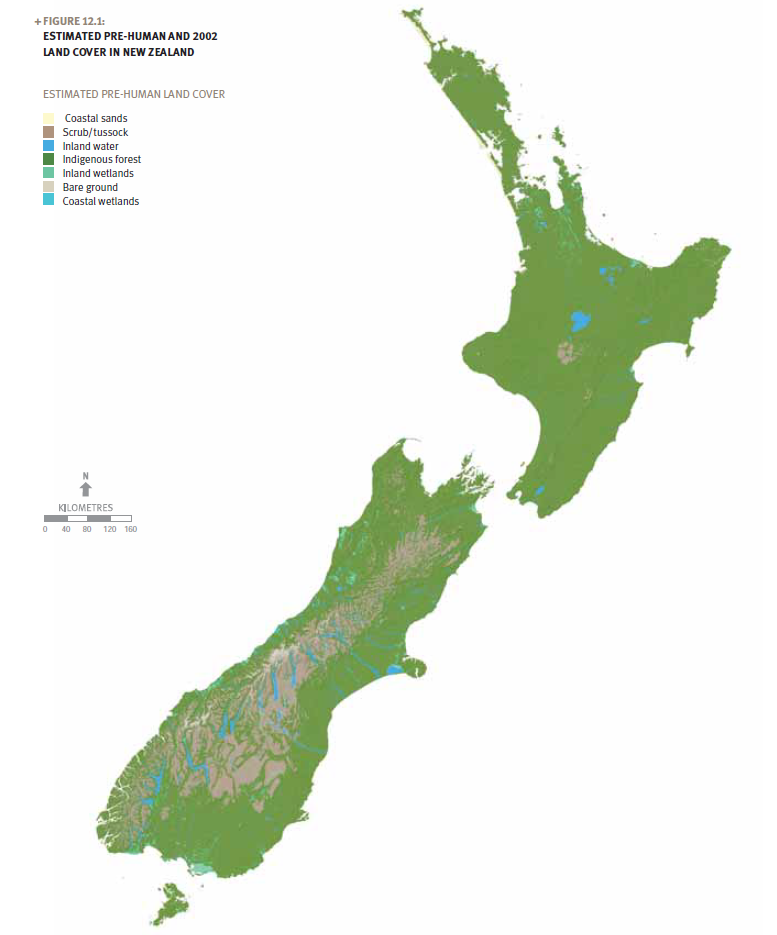
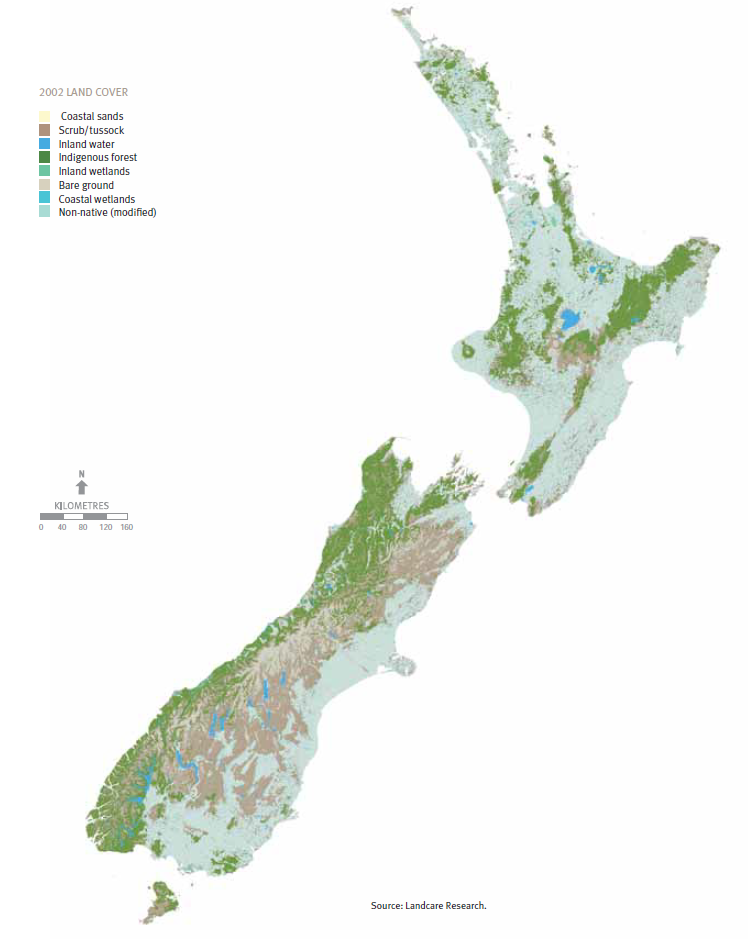
Changes in land cover can illustrate the impact of human settlement on native habitats and ecosystems. Figure 12.1 compares the estimated land cover before human settlement with the type of land cover in New Zealand today. It shows the significant changes to land cover that have occurred in the intervening period. See chapter 9, ‘Land’, for further discussion of the changes in land cover in New Zealand.
Figure 12.1: Estimated pre-human and 2002 land cover in New Zealand


Introduced species
The isolated evolution of New Zealand’s native species means many of them lack strategies to co-exist with or defend themselves against introduced competitors and predators (Atkinson, 2001). Introduced pest animals and weeds can therefore pose a serious threat to New Zealand’s biodiversity in both land and freshwater environments (Organisation for Economic Co-operation and Development, 2007).
Introduced pests, coupled with the loss of native habitats and ecosystems, have caused a substantial decline in New Zealand’s native plant and animal species (Saunders and Norton, 2001).
More than 25,000 plant species, 54 mammal species, and about 2,000 invertebrate species have been introduced to New Zealand since it was settled. Nearly 2,000 exotic plant species are now established in the wild. Of the mammals introduced to New Zealand, a group of 31 species now dominates many
of our landscapes.
While some of these introduced species, such as sheep and cattle, are cornerstones of New Zealand’s agricultural industry, others pose a threat to our native biodiversity. Browsing pests such as goats, deer, and Australian brushtail possums, which also prey on native animals (Atkinson et al, 1995), change the structure and composition of our forests and grasslands. Predators like rats, stoats, and cats hunt some of our rarest native animals. Introduced weeds can smother or overshadow native plants.
Without sustained control of such pests, many of New Zealand’s protected ecosystems are at risk of continued biodiversity loss.
New Zealand’s biodiversity is not only at risk on land. All freshwater ecosystems, such as streams, lakes, and wetlands, and the freshwater species within them, are influenced by the human activity that occurs on adjacent land and within estuarine areas. Pest species, reduced water quality, and sedimentation can adversely affect biodiversity in these ecosystems.
As an example, wetlands represent some of New Zealand’s most diverse ecosystems, but 90 per cent of their original area has been lost through changing land use. Wetlands currently cover fewer than 2,500 square kilometres.
Climate change
Whether plants and animals are native to New Zealand or introduced, most can only survive within a certain climate zone. While most species are able to cope with normal climatic variations, climate change is expected to place additional pressure on many species, particularly those already at risk.
A changing climate is expected to disrupt sensitive food-chain relationships in some ecosystems. For example, there is already evidence in the northern hemisphere that as temperatures grow warmer, some bird species are hatching earlier in the year, when the flower or fruit on which they depend for nourishment may not yet be ready.
Climate-influenced shifts in habitat may also lead to changes in the distribution of species. For example, migration patterns may alter, and the available habitat for sensitive alpine species may diminish with the gradual recession of glacial or snow systems.
As temperatures and climate patterns change, New Zealand may also develop new biosecurity risks, with new tropical pests and diseases potentially becoming established here.
Threatened species
Since human settlement, many of New Zealand’s unique native species, such as all species of moa, the Haast’s eagle, and the
huia, have become extinct. Many more of our native species are currently threatened, with our levels of threatened species
rated among the highest in the world (Hitchmough et al, 2007).
Extinction risk is determined by classifying species using the Department of Conservation’s Threat Classifi cation System, which
takes into account national distribution and abundance, as well as other variables. Table 12.2 shows the threat status of native
species in this classification system.
In some species groups, a large proportion of native species are threatened. For example, all of New Zealand’s native frog
species are threatened as a result of loss of habitats and predation. Diseases are probably also responsible for declines in
some species, with a chytrid fungus and a ranavirus recently detected in some native frogs. Five out of six New Zealand bat
species are endangered because of predation and loss of the large trees they require as roosts.
Table 12.2 indicates that not enough is known about some groups to reliably determine their threat status. For example,
many fungi and plants are listed as ‘data deficient’, which means insufficient information is available to determine whether
they are endangered.
Table 12.2: Distribution of threat ranking by native species group according to the department of conservation’s threat classification system, 2005
| Group | Threatened | Total threatened | Data-deficient1 species | ||
|---|---|---|---|---|---|
| Acutely threatened | Chronically threatened | At risk | |||
| Bats | 4 | 0 | 1 | 5 | 1 |
| Birds | 62 | 25 | 66 | 153 | 50 |
| Reptiles | 10 | 23 | 34 | 67 | 12 |
| Frogs | 3 | 0 | 1 | 4 | 0 |
| Freshwater fish | 6 | 14 | 6 | 26 | 21 |
| Invertebrates - Freshwater | 14 | 3 | 97 | 114 | 29 |
| Invertebrates - Land-based | 237 | 52 | 654 | 943 | 1,541 |
| Plants - Bryophytes2 | 88 | 0 | 87 | 175 | 8 |
| Plants - Vascular plants | 175 | 108 | 585 | 868 | 155 |
| Fungi | 49 | 11 | 5 | 65 | 1,445 |
| Total | 648 | 236 | 1,536 | 2,420 | 3,262 |
Data source: Adapted from Hitchmough et al, 2007.
Notes:
1 Species for which data is deficient may be rare or threatened, but not enough is known to classify them that way.
2 Bryophytes are non-vascular plants: mosses, liverworts, and hornworts.
See Chapter 1: Environmental reporting for more information on the core national indicators and how they are used.
It is neither practical nor possible to measure the distribution and health of every native plant and animal species or ecosystem, to assess the state of New Zealand’s native biodiversity. Instead, the monitoring of New Zealand’s land environments and a selected range of native species, habitats, and ecosystems can provide an indicative measure of the state of and changes to native biodiversity.
There are two national environmental indicators for biodiversity.
The first provides information on the area of land covered by native vegetation, including the area under legal protection.
The second indicator provides information on the distribution of selected native species.
The distributions of the following species are measured to provide information for reporting on this indicator:
- lesser short tailed bat
- kiwi
- kākā
- kōkako
- mōhua
- wrybill
- dactylanthus.
Further details on the indicators follow.
Other information is included in this chapter to present a more rounded picture of New Zealand’s native biodiversity as follows:
- changes in native land cover, as classified by the Land Cover Database, a satellite map of New Zealand’s land cover which describes the types of features present on the surface of the earth
- the location of protected areas
- the extent of wetland areas
- conservation efforts on private land
- the extent and type of pest management on public conservation lands
- the extent of some freshwater weed invasions
- observed changes in the distribution of some common native birds.
New zealand’s diverse land environments host many different ecosystems and species.
Land area with native vegetation
This indicator shows the proportion of land environment covered by native vegetation. It also illustrates the proportion of various native ecosystem types under legal protection.
Data on native vegetation can indicate changes in habitats that are suitable for various native species. Overlaying a map of native vegetation with a map of New Zealand’s land environments shows which areas have lost the most native vegetation, and what remains, according to its ecosystem type.
For this mapping and analysis, two reporting tools are used:
- the New Zealand Land Cover Database, which maps all land cover for mainland New Zealand based on satellite imagery
- the Land Environments of New Zealand classification, an environment-based classification of ecosystems, mapped across New Zealand’s landscape.
See Chapter 1: Environmental reporting for a more detailed explanation of these tools.
To illustrate the vegetation that has been safeguarded and the types of environments protected nationally, we combine data on native vegetation and land environment with the total number of hectares legally protected as public conservation land, regional parks, and covenants on private land.
Distribution of selected native plants and animals
This environmental indicator shows whether selected native species are present or absent in areas where they might be expected to be found, and the change in distribution of these species over time.
Monitoring the quality and extent of suitable native habitats for a selection of ‘indicator species’ is a practical way of assessing changes in New Zealand’s native biodiversity.
Changes in the distribution of a small number of indicator species over specific periods are used to illustrate the changing extent of native habitats over time. The three periods used are:
- before human settlement
- during the 1970s and 1980s
- the present.
Seven indicator species have been selected from the national biodiversity indicator programme currently under development by the Department of Conservation. These species are all managed by the Department under recovery plans, and they were selected for their usefulness as indicators, their habitat requirements, the availability of data for them, and their level of threat. Table 12.3 shows the selection of indicator species and their descriptions.
Table 12.3: Selection of native species used to illustrate changes in New Zealand’s native biodiversity
| Name | What is it? | Why is it an indicator? |
|---|---|---|
|
Lesser short-tailed bat/pekapeka (Mystacina tuberculata) Referred to as lesser short-tailed bat in this report. |
Endemic bat. Bats are our only native terrestrial mammal. | Shows the general health and structure of forested ecosystems in many parts of New Zealand. |
| Kiwi (Apteryx spp.) (five species) | Endemic, flightless bird. | A good indicator of the abundance of key mammalian predators in a range of forest types in many parts of the country. |
| Kākā (Nestor meridionalis) | Endemic forest parrot. | A good indicator of possum and stoat abundance in a range of forest types in the North and South Islands. |
| Kōkako (Callaeas cinerea) | Endemic New Zealand wattlebird. | An indicator of rat and possum densities in North Island forests. The kōkako, because of its sensitivity, only exists in managed sites. |
|
Mōhua/yellowhead (Mohoua ochrocephala) Referred to as mōhua in this report. |
Endemic insectivorous forest bird. | A very sensitive indicator of stoat and rat densities in South Island beech forest. |
|
Wrybill/ngutu pare (Anarhynchus frontalis) Referred to as wrybill in this report. |
Small, endemic shorebird that is highly specialised for breeding in braided rivers. | These birds depend on South Island braided rivers for their breeding habitat and provide a good indicator of various threats degrading this ecosystem, such as pest predators and direct human impact, including water extraction and four-wheel-drive activities. |
|
Dactylanthus/Woodrose/pua o te rēinga (Dactylanthus taylorii) Referred to as dactylanthus in this report. |
Endemic, parasitic flowering plant. | Indicates aspects of forest health in parts of the North Island, including densities of introduced browsers, presence of native pollinators, seed dispersers, and host trees. |
Source: Ministry for the Environment.
Limitations of the indicators
The indicators used to report on biodiversity assess only native land-based and freshwater ecosystems. They do not include marine ecosystems.
Refer to Chapter 11: Oceans for information on marine biodiversity.
The indicators do not provide information on ecosystems at a community or habitat level – that is, the distribution and number of various species in an ecosystem or habitat cannot be determined on the basis of the indicators in this chapter. Neither do the indicators provide information about the quality of the habitats or ecosystems.
Legal protection of native vegetation does not indicate the condition of an ecosystem or habitat – that is, it does not show how effective the legal protection is. Conversely, active pest management on land contributes to biodiversity goals, even if the land is not formally protected.
Information about the indicator species discussed in this chapter illustrates changes in the distribution of these species, but does not illustrate the abundance or stability of populations.
United Nations Convention on Biological Diversity 1993
The United Nations Convention on Biological Diversity has 190 parties and although it is largely descriptive it is considered the primary international convention on biodiversity. New Zealand’s 1993 ratification of the convention confirmed our commitment to international efforts to conserve global biodiversity and use it sustainably.
Under the convention, governments are required to develop national biodiversity strategies and action plans, and to integrate these into broader national plans for sustainable development. These requirements are met in New Zealand through domestic environmental policy and initiatives, including the New Zealand Biodiversity Strategy 2000.
New Zealand Biodiversity Strategy 2000
The New Zealand Biodiversity Strategy reflects New Zealand’s commitment to the United Nations Convention on Biological Diversity. The strategy sets out the Government’s response to declining native biodiversity in broad terms. It identifies national goals and principles for managing New Zealand’s biodiversity, and action plans for achieving the goals.
The biodiversity indicators and environmental classifications presented in this report form part of the strategy’s action plan for Theme 9 (‘Information, knowledge and capacity’) (Department of Conservation and Ministry for the Environment, 2000).
Native vegetation cover and legal protection
This section reports on the area of native vegetation cover in New Zealand and the legal protection it receives.
Each native land cover class is shown by area (measured by data from the Land Cover Databases 1 (LCDB 1) and 2 (LCDB 2)), and by land environment type (as classified by Land Environments of New Zealand, a land-based classification tool).
Table 12.4 shows the estimated change in area of New Zealand’s native land cover between 1997 and 2002, as well as the extent of legal protection each native cover class received.
Past and present land cover
In 2002, more than 13.3 million hectares of New Zealand’s land was covered by native land cover, as estimated by the Land Cover Database 2 (Table 12.4). This equates to 49.6 per cent of New Zealand’s total land area (26.9 million hectares). The area of native vegetation (excluding other native land cover, such as permanent snow and ice) equates to 43.7 per cent (11.7 million hectares) of New Zealand’s total land area.
Between 1997 and 2002, it is estimated that native land cover decreased by 16,500 hectares (0.12 per cent). This total decrease included an increase of 700 hectares of non-vegatative native cover, such as sand and gravel, and a decrease of 17,200 hectares of native vegetative cover. These changes either occurred through conversion of land to other uses, or as a result of natural processes.
The vegetation types that have experienced the greatest loss are broadleaved native hardwoods, mānuka and/or kānuka, tall tussock grassland, and native forest. Changes recorded by the Land Cover Database 2 show broadleaved native hardwood land cover was mainly converted into exotic forestry (83 per cent), or cleared for pasture (12.5 per cent). Similarly, mānuka and/or kānuka stands were converted into exotic forestry (52.5 per cent), or pasture (46 per cent).
The changes in native forest cover shown in Table 12.4 were largely due to harvesting (82.5 per cent) and some conversion to exotic forestry (11 per cent). All the tall tussock grassland cover that experienced land-use change was converted into exotic forestry.
Legal protection
Table 12.4 shows that in 2006, about 62.4 per cent (8.3 million hectares) of New Zealand’s total native land cover was legally protected. This represents 35 per cent of New Zealand’s total land area. Of our native vegetation (excluding other native land cover, such as permanent snow and ice), 63.7 per cent is legally protected.
Some native vegetation types receive comparatively high levels of protection. For example, in 2006, 79.6 per cent of the remaining native forests, 81.5 per cent of the remaining subalpine shrublands, and 80.7 per cent of the remaining alpine grass/herbfields were protected. Other vegetation types are represented to a lesser degree in legally protected areas.
Table 12.4: Estimated change in native vegetation and other native land-cover classes (1997 and 2002) using satellite imagery (lcdb 1 and lcdb 2) and the extent of legal protection for each land cover class
| Native land cover class | Area (hectares) | Percentage difference (%) | Area legally protected in 2006 | ||
|---|---|---|---|---|---|
| 1997 | 2002 | Hectares | Percentage of 2002 area (%) | ||
| Alpine grass/herbfield | 224,400 | 224,400 | 0.00 | 181,100 | 80.72 |
| Broadleaved native hardwoods | 546,200 | 539,600 | –1.22 | 199,500 | 36.97 |
| Depleted grassland | 250,500 | 250,500 | 0.00 | 33,300 | 13.29 |
| Fernland | 51,800 | 51,700 | –0.15 | 8,200 | 15.82 |
| Flaxland | 6,500 | 6,500 | 0.00 | 3,600 | 55.83 |
| Grey scrub1 | 72,500 | 72,400 | –0.06 | 9,800 | 13.52 |
| Herbaceous freshwater vegetation | 88,800 | 88,700 | –0.13 | 41,400 | 46.71 |
| Herbaceous saline vegetation | 19,300 | 19,200 | –0.45 | 6,700 | 34.8 |
| Native forest | 6,459,400 | 6,457,000 | –0.04 | 5,136,600 | 79.55 |
| Mangrove | 26,000 | 26,000 | 0.00 | 2,600 | 9.8 |
| Mānuka and/or kānuka | 1,191,600 | 1,186,200 | –0.45 | 362,800 | 30.59 |
| Matagouri2 | 29,500 | 29,500 | –0.02 | 3,100 | 10.32 |
| Sub-alpine shrubland | 385,400 | 385,400 | 0.00 | 314,200 | 81.53 |
| Tall tussock grassland | 2,397,100 | 2,394,600 | –0.10 | 1,175,500 | 49.09 |
| Total native vegetation cover | 11,748,900 | 11,731,700 | –0.15 | 7,478,300 | 63.74 |
| Alpine gravel and rock | 698,000 | 698,100 | 0.01 | 506,400 | 72.53 |
| Coastal sand and gravel | 51,300 | 51,300 | –0.07 | 18,900 | 36.8 |
| Estuarine open water | 92,500 | 92,500 | 0.00 | 3,600 | 3.86 |
| Lake and pond | 356,800 | 357,500 | 0.20 | 121,500 | 33.98 |
| Landslide | 17,000 | 17,000 | –0.26 | 11,600 | 68.16 |
| Permanent snow and ice | 111,000 | 111,000 | 0.00 | 109,200 | 98.43 |
| River | 81,900 | 81,900 | 0.00 | 18,100 | 22.09 |
| River and lakeshore gravel and rock | 179,700 | 179,700 | 0.00 | 45,900 | 25.56 |
| Total other native land cover | 1,588,400 | 1,589,100 | 0.04 | 835,100 | 52.56 |
| Total native land cover | 13,337,300 | 13,320,800 | –0.12 | 8,313,446 | 62.41 |
Data source: Landcare Research.
Notes:
1 Grey scrub is a classifi cation for areas covered with small-leaved shrubs such as small-leaved Coprosma species.
2 Matagouri (Discaria toumatou) is a thorny shrub found in open, moist areas, which is known to invade pastures.
3 Figures rounded to the nearest 100 hectares. Percentages are calculated from unrounded figures.
4 Any discrepancies between hectares shown for land-cover classes and totals shown on this table are due to rounding.
The Resource Management Act 1991 and biodiversity
The Resource Management Act 1991 has a key role in managing New Zealand’s terrestrial and freshwater biodiversity. Because almost all forms of resource use affect native biodiversity, biodiversity is recognised in the Act in many ways:
- All plants and animals come within the definition of natural resources (section 5).
- Section 6(c) refers to the protection of areas of significant native vegetation and significant habitats of native fauna.
- Section 7(d) refers to the intrinsic value of ecosystems.
- Section 30(1)(c)(iiia): Regional councils are responsible for controlling the use of land for the purpose of maintaining and enhancing ecosystems in water bodies and coastal waters.
- Section 30(1)(ga): Regional councils are responsible for establishing, implementing, and reviewing objectives, policies, and methods for maintaining native biological diversity.
- Section 31(b)(iii): Territorial authorities are responsible for controlling the effects of land use to maintain native biological diversity.
Amendments to the Act in 2003 clarified that regional councils and territorial authorities are responsible for managing native biodiversity. Local authorities must consider the consequences of all effects on native biodiversity, not simply the significance of a species or habitat.
Figure 12.2 maps New Zealand’s land environments into 20 classes, as identified in the Land Environments New Zealand classification. Table 12.5 shows the area and percentage of native land cover (both vegetative and non-vegetative) for each of the 20 land environments mapped in Figure 12.2. It also shows how much of these areas were legally protected in 2006. By combining the information shown in Table 12.4 and Table 12.5, we can see which areas have lost most native land cover, what the type of land cover was, and to what extent the remaining native land cover is legally protected.
Figure 12.2: New zealand land environments as shown by the land environments of new zealand classification
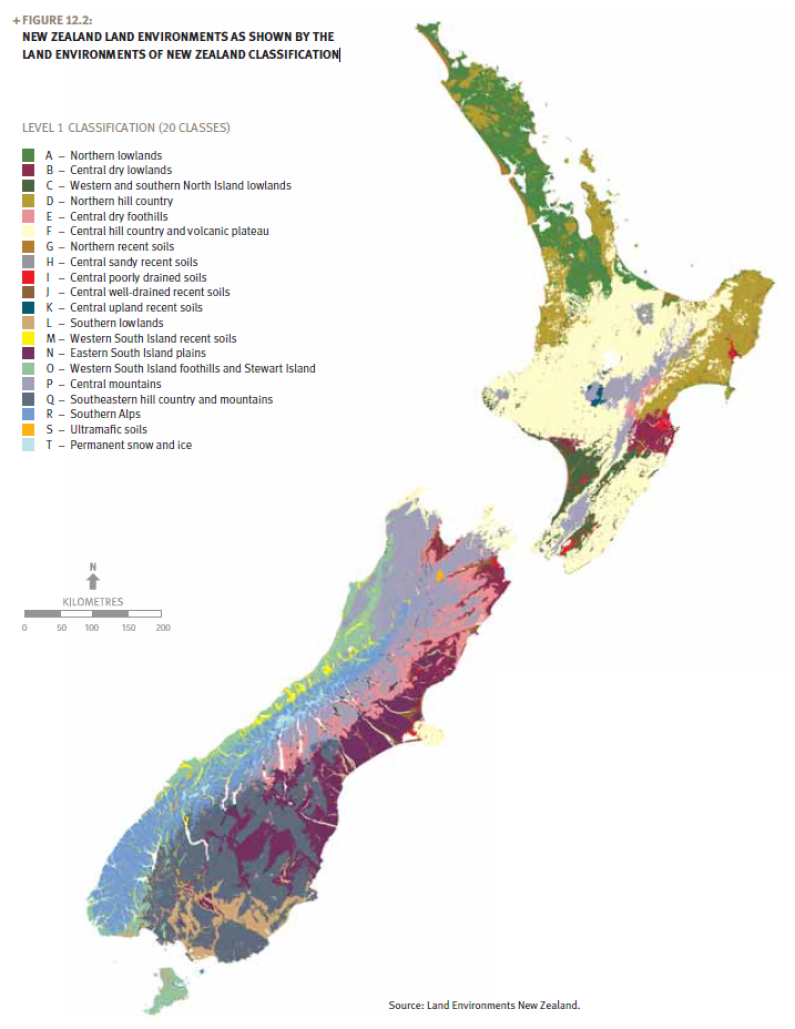
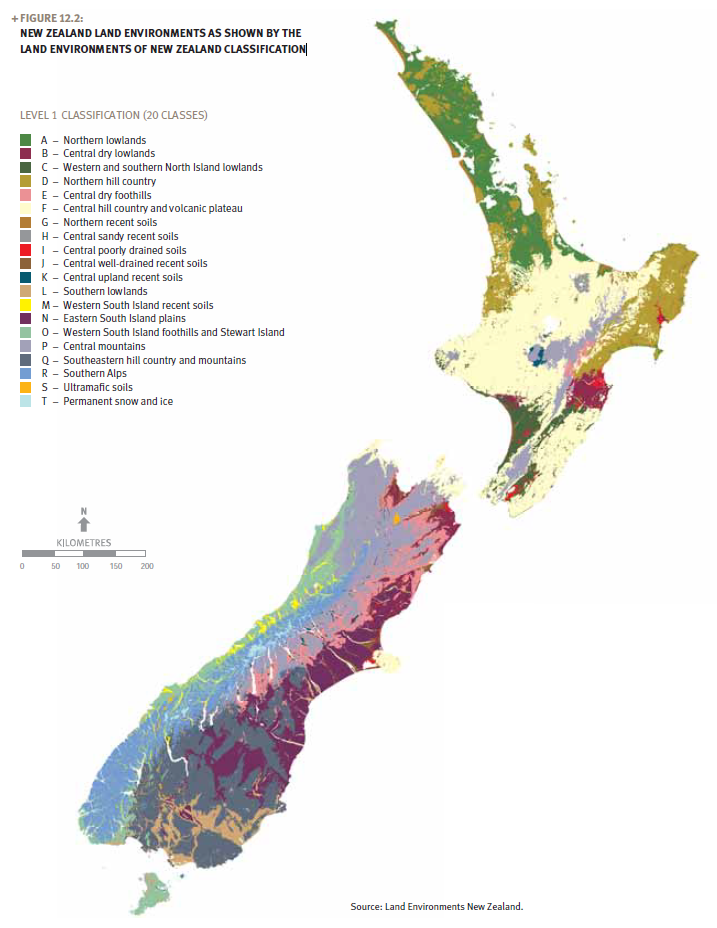
Table 12.5: Native land cover by land environment, and legally protected native land cover, 2006, within each land environment
| Land environment | Total area (Hectares) of land environment | Percentage of total land area (%) | Area (Hectares) of land environment with native land cover | Percentage of land environment with native land cover (%) | Area (Hectares) of native land cover with legal protection | Percentage of native land cover with legal protection (%) |
|---|---|---|---|---|---|---|
| A – Northern lowlands | 1,849,768 | 7.05 | 337,759 | 18.26 | 84,754 | 25.09 |
| B – Central dry lowlands | 691,023 | 2.64 | 70,437 | 10.19 | 6,526 | 9.26 |
| C – Western and southern North Island lowlands |
636,039 | 2.43 | 27,014 | 4.25 | 5,783 | 21.41 |
| D – Northern hill country | 2,100,703 | 8.01 | 927,561 | 44.15 | 469,804 | 50.65 |
| E – Central dry foothills | 1,323,134 | 5.05 | 591,154 | 44.68 | 229,675 | 38.85 |
| F – Central hill country and Volcanic Plateau |
5,241,257 | 19.99 | 1,901,125 | 36.27 | 999,483 | 52.57 |
| G – Northern recent soils | 336,969 | 1.28 | 56,205 | 16.68 | 18,274 | 32.51 |
| H – Central sandy recent soils | 135,305 | 0.52 | 47,804 | 35.33 | 31,187 | 65.24 |
| I – Central poorly drained soils |
120,999 | 0.46 | 6,159 | 5.09 | 2,390 | 38.80 |
| J – Central well-drained recent soils |
292,689 | 1.12 | 20,779 | 7.10 | 3,277 | 15.77 |
| K – Central upland recent soils |
160,758 | 0.61 | 63,831 | 39.71 | 19,936 | 31.23 |
| L – Southern lowlands | 801,869 | 3.06 | 104,945 | 13.09 | 59,356 | 56.56 |
| M – Western South Island recent soils |
220,444 | 0.84 | 121,532 | 55.13 | 98,584 | 81.12 |
| N – Eastern South Island plains |
2,044,301 | 7.80 | 163,565 | 8.00 | 8,780 | 5.37 |
| O – Western South Island foothills and Stewart Island |
1,412,650 | 5.39 | 1,279,893 | 90.60 | 1,161,159 | 90.72 |
| P – Central mountains | 3,247,880 | 12.39 | 3,029,280 | 93.27 | 2,313,193 | 76.36 |
| Q – Southeastern hill country and mountains |
3,276,038 | 12.49 | 1,780,287 | 54.34 | 622,273 | 34.95 |
| R – Southern Alps | 1,929,739 | 7.36 | 1,927,944 | 99.91 | 1,816,279 | 94.21 |
| S – Ultramafic soils | 33,485 | 0.13 | 32,513 | 97.10 | 31,059 | 95.53 |
| T – Permanent snow and ice | 157,144 | 0.60 | 157,128 | 99.99 | 153,603 | 97.76 |
| Unspecified | 211,114 | 0.81 | 116,986 | 55.41 | 29,486 | 25.20 |
| Total | 26,223,310 | 100.00 | 12,763,904 | 48.67 | 8,164,862 | 63.97 |
Data source: Landcare Research.
Notes:
1 This report uses a total land area for New Zealand derived from the Land Environments of New Zealand classification tool. It results in a smaller total land area than that derived by other means.
2 Ultramafic soils are derived from molten rock (magma) that are rich in iron and magnesium and have a low silica content.
Table 12.5 shows that it is generally lowland environments, some recent soils, and the eastern South Island plains that have lost substantial native land cover since human settlement. Where native land cover does remain within these land environments, there is mostly low to medium legal protection for conservation purposes (between 5 per cent and 40 per cent). This has implications for the threatened species that require unmodified lowland habitats to survive.
As an example, the western and southern North Island lowlands and eastern South Island plains have lost 95.8 per cent and 92 per cent of their respective original native land cover. Of these land environments, 21.4 per cent and 5.4 per cent, respectively, are legally protected.
In contrast, the central mountains and Southern Alps have lost less than 6.7 per cent and 1 per cent, respectively, of their original native land cover. Of this, 76.4 per cent and 94.2 per cent, respectively, of the remaining native land cover is under legal protection.
Wetlands
Wetland ecosystems, where land and freshwater meet, often support particularly high levels of biodiversity. They provide the water and nutrients that countless species of plants and animals depend on for survival (Ramsar Convention, 2007). However, increasing demand for accessible land has led to the conversion or modification (including drainage) of a large proportion of New Zealand’s wetland areas to provide pastoral land cover.
Figure 12.3 shows the estimated original and current extent of wetland areas. Just over 10 per cent of the original wetland environment remains across New Zealand (4.9 per cent of the original area in the North Island, and 16.6 per cent in the South Island). Of this amount, less than half is legally protected. Many of the remaining wetlands are situated on private land.
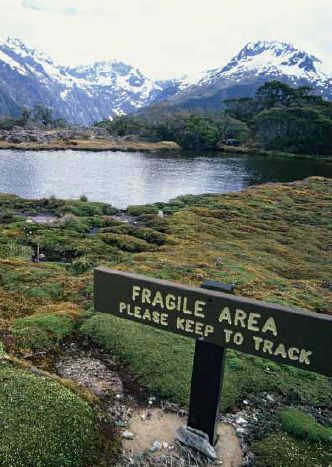
Image: Courtesy of the Department of Conservation.
Figure 12.3: Estimated pre-human and current (2007) extent of wetland areas
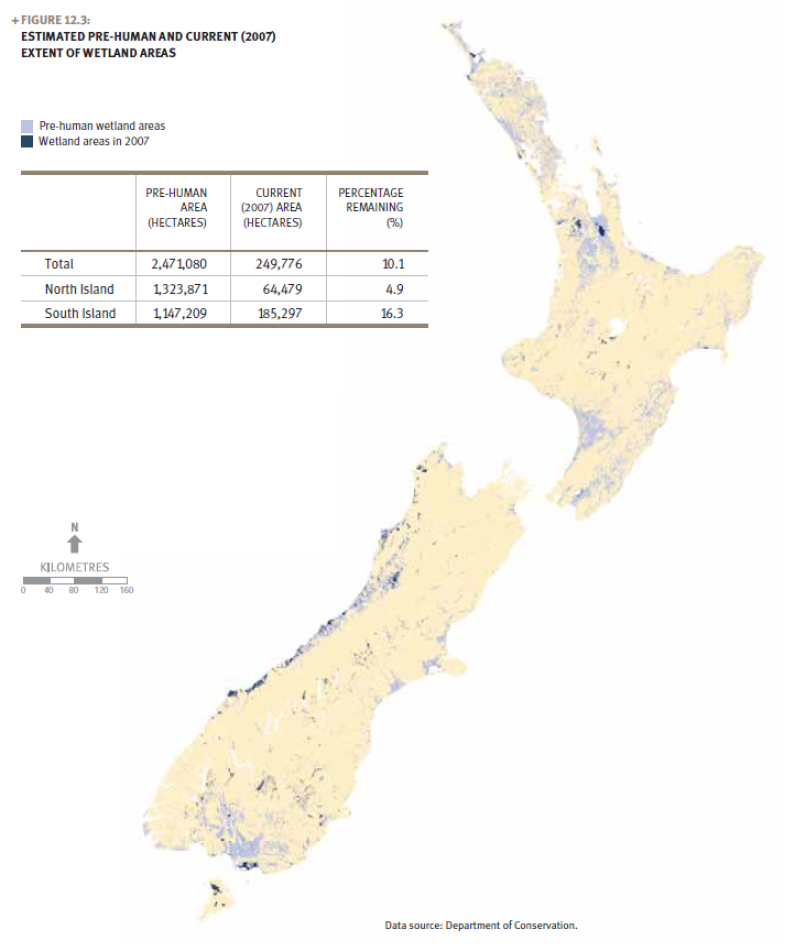

New Zealand has designated six wetlands as having global importance under the Ramsar Convention on Wetlands, 1971 (Table 12.6). Together, these wetlands cover a surface area of 39,068 hectares.
Table 12.6: Wetlands designated under the Ramsar Convention on Wetlands
| Site name and location | Date of designation | Surface area in Hectares | Description |
|---|---|---|---|
| Farewell Spit, South Island | 1976 | 11,388 |
Nature reserve; shorebird network site. A 30-kilometre long sand spit and inter-tidal area with a dune complex giving way to mudflats on the south. Particularly important as a staging area for shorebirds. Also supports several notable plant species. |
| Waituna Lagoon, South Island | 1976 | 3,556 |
Scientific reserve. A coastal lagoon, peatlands, saltmarsh, gravel beach, ponds, and lakes. These habitats provide important areas for waders and various other waterbirds. Endemic butterfly species and two species of endangered fish occur. The site supports numerous native plant species, some typical of alpine regions. |
| Kopuatai Peat Dome, North Island | 1989 | 10,201 |
Stewardship area; wildlife management reserve. The largest unaltered raised bog in New Zealand, surrounded by mineralised swampland and associated lagoons. Important area for threatened birds and plants, and notable invertebrates. A spawning site for threatened fish. |
| Whangamarino, North Island | 1989 | 5,923 |
Stewardship area. The second largest peat bog and swamp complex on the North Island. The most important breeding area in New Zealand for matuku (Australasian bittern) and habitat for wintering birds and endangered species of plants and fish. |
| Firth of Thames, North Island | 1990 | 7,800 |
Coastal reserve; shorebird network site. A large coastal reserve consisting of shallow marine water, mud and grass flats, mangrove swamp, saltmarsh, and swampland. Includes a globally rare land formation of graded shell beach ridges that support grazing. Important site for roosting, wintering, and staging wading birds. |
| Manawatū River mouth and estuary, North Island | 2005 | 200 |
Estuarine system. An estuary retaining a high degree of naturalness and diversity, important as a feeding ground for migratory birds, including wrybill. The saltmarsh–ribbonwood community is the largest in the ecological district and contains its southernmost and biggest population of fernbirds (Bowdleria punctata). A high diversity of fish is supported, including some that are threatened. Archaeological signs of the semi-nomadic moa hunter culture dating from AD1400–1650 support Ramsar designation. |
Source: Adapted from Ramsar Convention, 2007.
Legal protection of land
Land under legal protection for conservation purposes includes public conservation lands managed by the Department of Conservation, parks managed by regional authorities, and private land protected under covenant by the Queen Elizabeth II National Trust (QEII Trust) and Ngā Whenua Rāhui. Figures 12.4 and 12.5 show the location and extent of New Zealand’s landbased legally protected areas.
Figure 12.4: Legally protected areas – North Island, 2006

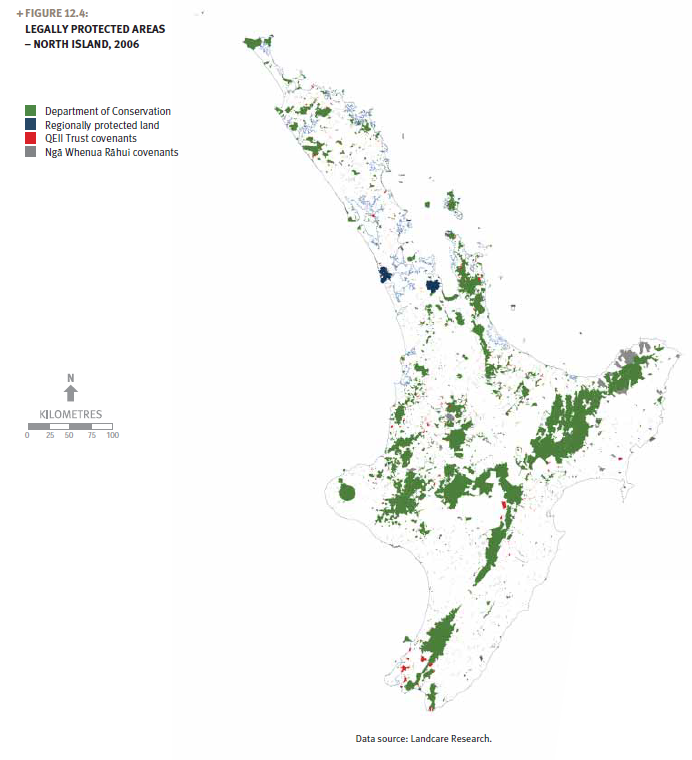
Figure 12.5: Legally protected areas – South Island, 2006

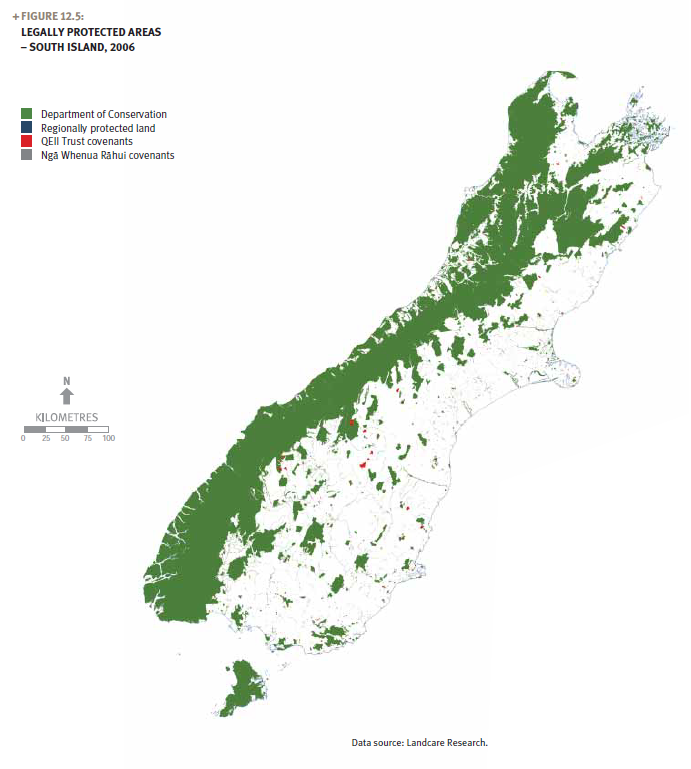
Most legally protected land is part of the public conservation lands that cover large tracts of native forest and alpine areas. The Department of Conservation is responsible for preserving and protecting these areas, including managing threats from invasive pests and diseases.
By October 2007, 8.43 million hectares of land were legally protected for conservation purposes in New Zealand. This includes public conservation lands managed by the Department of Conservation and councils, and private land protected under covenants by the QEII Trust and Ngā Whenua Rāhui.
Image: Courtesy of the Department of Conservation.
What is Ngā Whenua Rāhui?
Ngā Whenua Rāhui is a contestable fund that was established in 1991 to promote the voluntary protection of native ecosystems on Māori-owned land. To date, about 146,800 hectares of native ecosystems have been protected through this fund.
Public conservation lands
Public conservation lands (Crown conservation land and council-protected land) have also increased. In 2004, 8.06 million hectares were set aside in New Zealand for public conservation land (Ministry for the Environment, 2004). By the end of 2006, a total of 9.27 million hectares were legally protected, which is an increase of 14.95 per cent.
The increase in public conservation land has been partly achieved through the buy-back of Crown-owned land that was formerly leased or licensed to others. The Crown Pastoral Land Act 1998 authorised the review of 304 state-owned properties totalling 2.37 million hectares in the South Island high country, which had been leased to farmers for livestock grazing since the 1940s. The review’s objectives are to promote ecologically ustainable land management, protect land that has significant inherent value, secure public access to and enjoyment of the land, and dispose of any surplus land.
By September 2006, 226,000 hectares had been transferred to full government ownership to create a network of high-country parks and reserves.
Private conservation of land
While most of the effort to protect New Zealand’s native vegetation occurs on legally protected land, efforts to protect native vegetation on private and council-owned land are increasing.
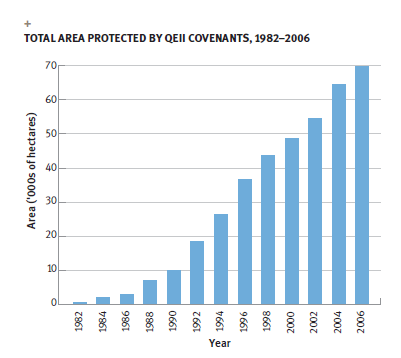
In 2004, a total of 146,280 hectares were registered as formally protected private land (Ministry for the Environment, 2004). By June 2006, registered QEII National Trust and Ngā Whenua Rāhui covenants formally protected a total of 221,473 hectares. The area on private land that is legally protected through these two mechanisms has increased by 51.4 per cent over this two-year period.
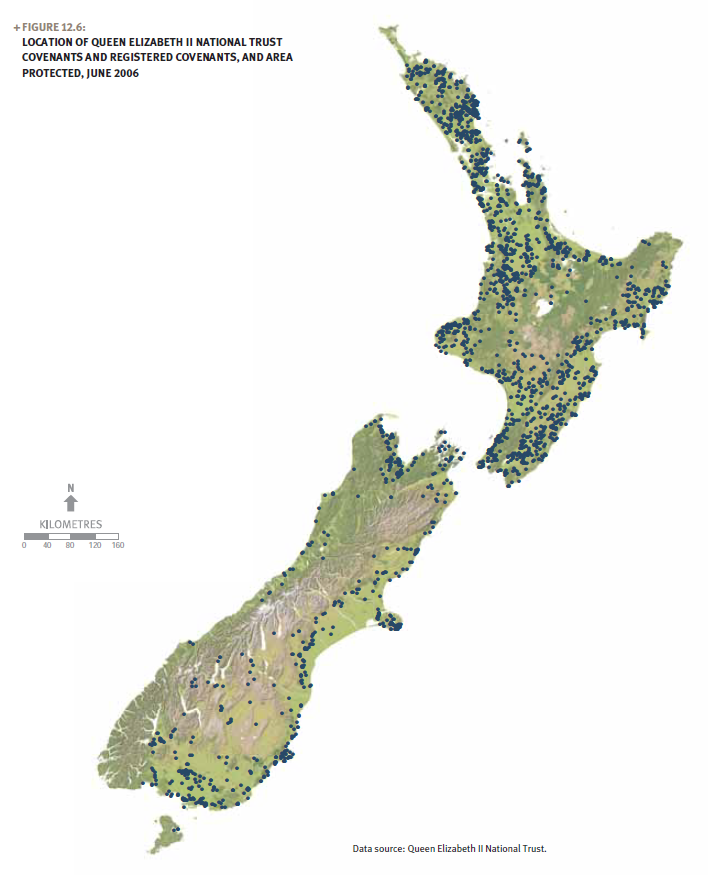
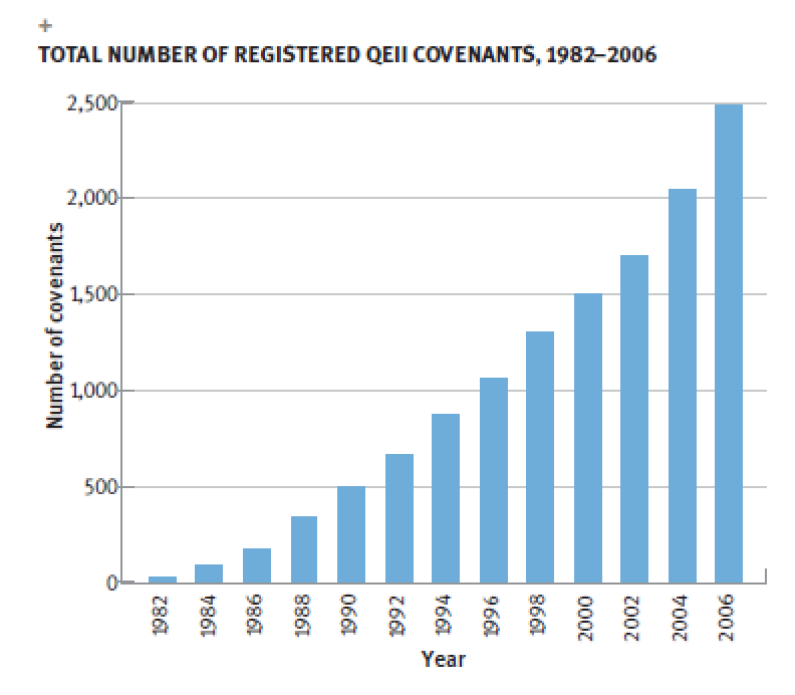
As an example, the number of covenants processed through the QEII Trust has continuously increased since 1977. By June 2007, 82,933 hectares were legally protected through more than 2,600 QEII Trust covenants. Figure 12.6 shows the location of QEII Trust covenants, as well as the number of registered QEII Trust covenants and the total land area protected by June 2006.
Private conservation initiatives
What is the Landcare Trust?
The Landcare Trust was established in 1996, with the vision of promoting sustainable land management. There are currently more than 250 landcare groups operating around New Zealand. Their level of activity and pace depends on the community they are based in and the specific issues they are trying to address.
Landcare groups are particularly numerous and active in some regions. Major initiatives are prominent where regional councils have set up active programmes for biodiversity protection and offer incentives or assistance to landholders (Davis, 2002).
Karori Wildlife Sanctuary
The Karori Wildlife Sanctuary, located 2 kilometres from Wellington city and run by a charitable community trust, has been developed as a major educational, research, and recreational site for the benefit of all New Zealanders.
The sanctuary is a 252-hectare haven for endangered native birds and other wildlife. A predator-proof fence, specifi cally designed to exclude 14 species of non-native mammals ranging from possums to mice, encircles the 8.6-kilometre perimeter.
Many threatened species of native wildlife are expected to be reintroduced to the sanctuary as appropriate habitats recover. The little spotted kiwi, stitchbird (hihi), weka, saddleback (tīeke), kākā, bellbird (korimako), whitehead (pōpokatea), and tuatara have already been released there.
Figure 12.6: Location of Queen Elizabeth II national trust covenants and registered covenants, and area protected, June 2006

Total area protected by QEII covenants, 1982–2006

Total number of registered QEII covenants, 1982–2006

More about the Queen Elizabeth the Second National Trust
The Queen Elizabeth the Second National Trust (QEII Trust) is a statutory organisation, independent from government, which was established in 1977 under the Queen Elizabeth the Second National Trust Act 1977.
The QEII Trust was established at the request of New Zealand farmers to protect open space on private land for the benefit and enjoyment of the present and future generations of New Zealanders.
A covenant is generally requested by the landowner and registered against the title of the land in perpetuity. The values of each covenant are identified in the covenant document. Each registered covenant is monitored every two years to ensure the land is managed in accordance with the covenant document. More than 95 per cent of covenant owners meet or exceed covenanting requirements with a resulting increase in biodiversity and sustainability of land and resources.
Over the past 10 years, landowners have increasingly recognised a QEII covenant as a mechanism to protect areas of land they value. Councils see QEII covenants as a cost effective method to manage and improve biodiversity in their regions.
The QEII Trust generally contributes to the cost of fencing, surveying, and registration on the title, often with the help of local or regional councils or conservation groups.
As a result of increases in the area protected by covenant, many of New Zealand’s ecosystem types that have become uncommon due to human activity are now represented in the QEII Trust covenanted areas. The number of covenants that include these rare habitats and ecosystems, such as wetlands and lowland forests, has increased. Table 12.7 shows the increase in QEII covenants for lowland forest and wetland systems since the late 1990s.
Table 12.7: Registered covenants by the Queen Elizabeth II National Trust, and the ecosystem types within them
| Ecosystem type | Number of registered covenants that include this ecosystem type | ||||
|---|---|---|---|---|---|
| 1977–1986 | 1987–1996 | 1997–2007 | Total number of covenants | Total area (Hectares) of covenants | |
| Lowland forest | 124 | 595 | 820 | 1,539 | 34,963 |
| Non-lowland forest | 21 | 196 | 372 | 589 | 28,593 |
| Wetland, stream, bog, river, lake | 16 | 77 | 209 | 302 | 8,496 |
| Saltmarsh, estuarine, dune, sandplain | 1 | 9 | 18 | 28 | 502 |
| Montane saline plain | 0 | 0 | 2 | 2 | 166 |
| Tussock system | 2 | 12 | 31 | 45 | 11,741 |
| Archaeological, such as pa or other historical site | 3 | 8 | 25 | 36 | 1,670 |
| Geological feature such as rock, bluff, scree, cliff, outcrop, limestone | 6 | 23 | 22 | 51 | 2,668 |
Data source: Queen Elizabeth II National Trust.
Note: Ecosystem types listed here follow the ‘ecotypes’ the QEII National Trust uses to classify specific habitat, ecosystem, landform, and landscape types.
Some of New Zealand’s most endangered species find refuge in QEII Trust covenanted areas. For example, Table 12.8 shows that 51 QEII Trust covenants are home to at least one of the native indicator species shown in Table 12.3.
Table 12.8: Occurrence of species covered in this report that are found in Queen Elizabeth II National Trust covenants, 2007
| Species | Number of covenants where species is present | Total area (Hectares) of covenants where species is present |
|---|---|---|
| Kiwi (North Island brown) | 38 | 2,329 |
| Kākā | 10 | 339 |
| Wrybill | 1 | 1 |
| Mōhua | 1 | 8 |
| Dactylanthus | 1 | 39 |
| Total | 51 | 2,716 |
Data source: Queen Elizabeth II National Trust.
Distribution of selected native species
The following maps provide information on the distribution of the seven selected native species used as indicators of biodiversity levels. All seven species show a marked decrease in their range since human settlement, due to loss of habitats and the impacts of introduced pests.
Figure 12.7: Change in distribution of the lesser short-tailed bat
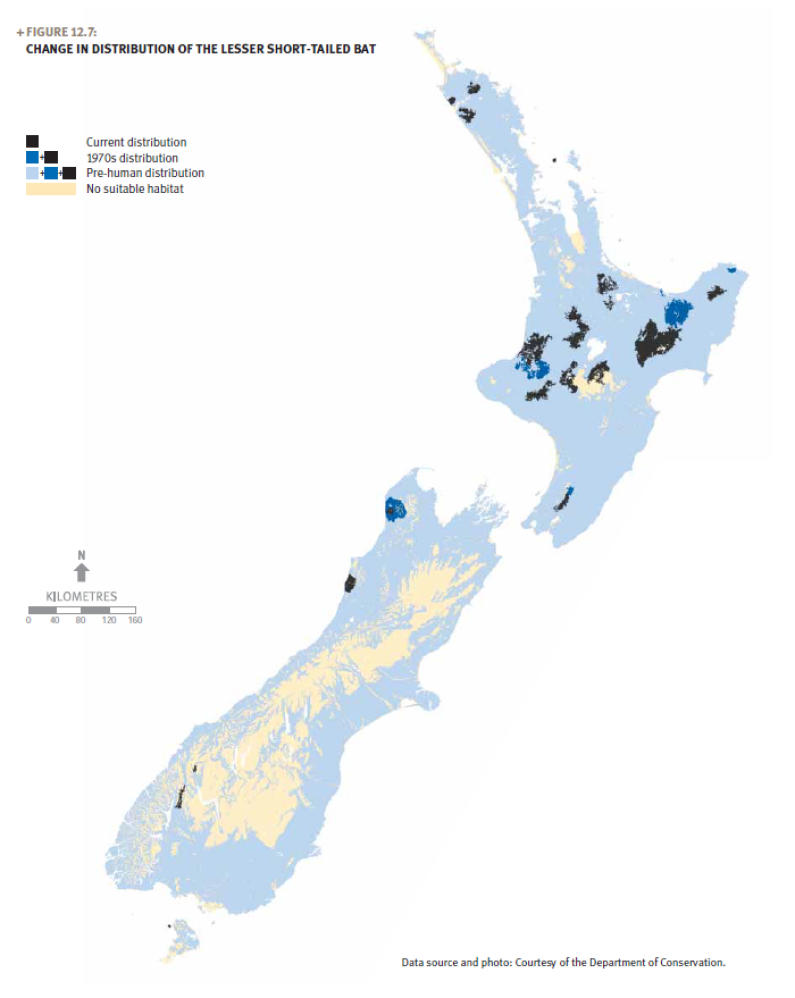

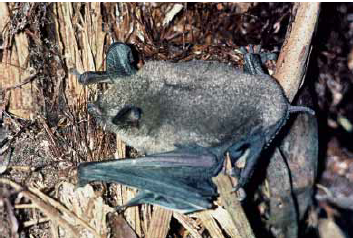
Image: Short-tailed bat (Mystacina Tuberculata).
There are three subspecies of the lesser short-tailed bat: the northern short-tailed bat, which is nationally endangered; the central short-tailed bat, which is range restricted; and the southern short-tailed bat. The Tararua Ranges population of the southern short-tailed bat is nationally critical and its southern populations are nationally endangered.
The bats live in indigenous forests where they roost in hollow trees. They forage for extended periods on the forest floor, using their folded wings as ‘front limbs’. Their diet consists of insects, fruit, nectar, and pollen, and they are an important pollinator of the plant dactylanthus.
Pressures include introduced predators such as rats, stoats, and cats as well as browsers and wasps. Some of their habitat is threatened by selective logging of large trees, which results in a loss of roost sites.
The management of the bats is guided by a recovery plan that includes protecting their roost sites from destruction or disturbance, introducing predator control programmes at important sites, and monitoring key populations. Attempts are being made to establish ‘insurance populations’ of short-tailed bats in predator-free environments in case they do not survive in their present habitats. Captive husbandry and breeding have also been used.
The lesser short-tailed bat currently occupies less than 5 per cent of the range it was estimated to have before human settlement. Its current distribution is about 75 per cent of its range in the 1970s.
The northern lesser short-tailed bat is found at two sites in Northland and one on Little Barrier Island. The central lesser short-tailed bat is found in Northland, the central North Island, and Taranaki. The southern lesser short-tailed bat is found in the Tararua Ranges, on Codfish Island, in northwest Nelson, and in Fiordland.
Figure 12.8: Change in distribution of the kiwi
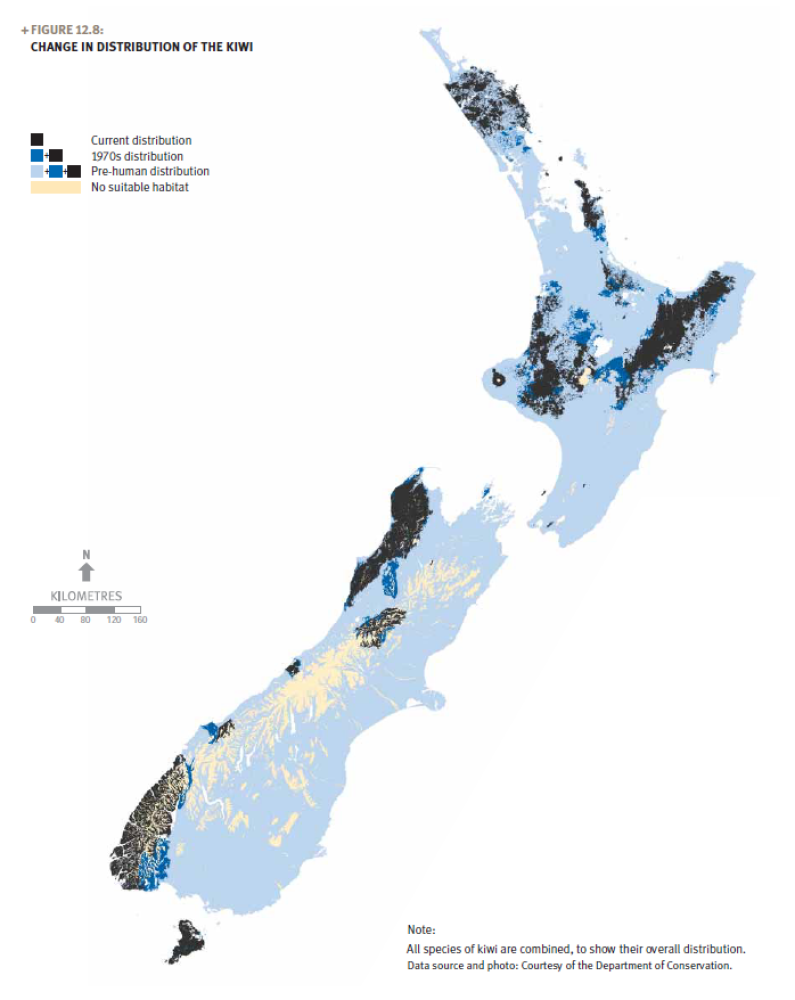

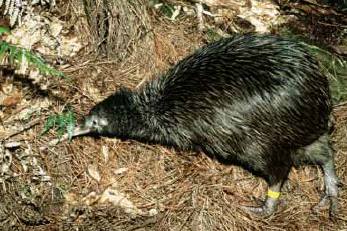
Image: Kiwi (Apteryx Spp).
Kiwi are flightless, nocturnal birds, which feed largely on invertebrates. They lay a single, very large egg. Currently, the populations of the five kiwi species total about 70,000.
All kiwi species are in decline and considered threatened. Their rates of decline depend on the densities of introduced predators, especially dogs, ferrets, stoats, and cats. The fastest rate of decline is in lowland areas, with slower declines or stable populations at high-altitude sites, where predators are absent or scarce.
Guided by a recovery plan, the Department of Conservation’s strategy includes:
- protecting nests, chicks, and adults from predators in the wild
- collecting eggs or chicks from the wild and raising them in captivity for release back into the wild when they are able to defend themselves from stoats and cats
- undertaking research into their genetics, breeding ecology, and habitat requirements
- empowering iwi and community groups to manage kiwi populations, especially where kiwi are still found on private land.
The brown kiwi is still widespread in the central and northern North Island. Rowi are found only at South Ōkarito on the West Coast, but distinct populations of tokoeka (formerly believed to be brown kiwi) are present at Haast, Fiordland, and on Stewart Island. Great spotted kiwi can be found in the northwestern South Island, while little spotted kiwi are restricted to five offshore islands and the Karori Wildlife Sanctuary in Wellington.
Kiwi now occupy about 17 per cent of their estimated original range, as a result of habitat loss and predation. Since the 1970s, their range has decreased by about 20 per cent.
Figure 12.9: Change in distribution of the kākā
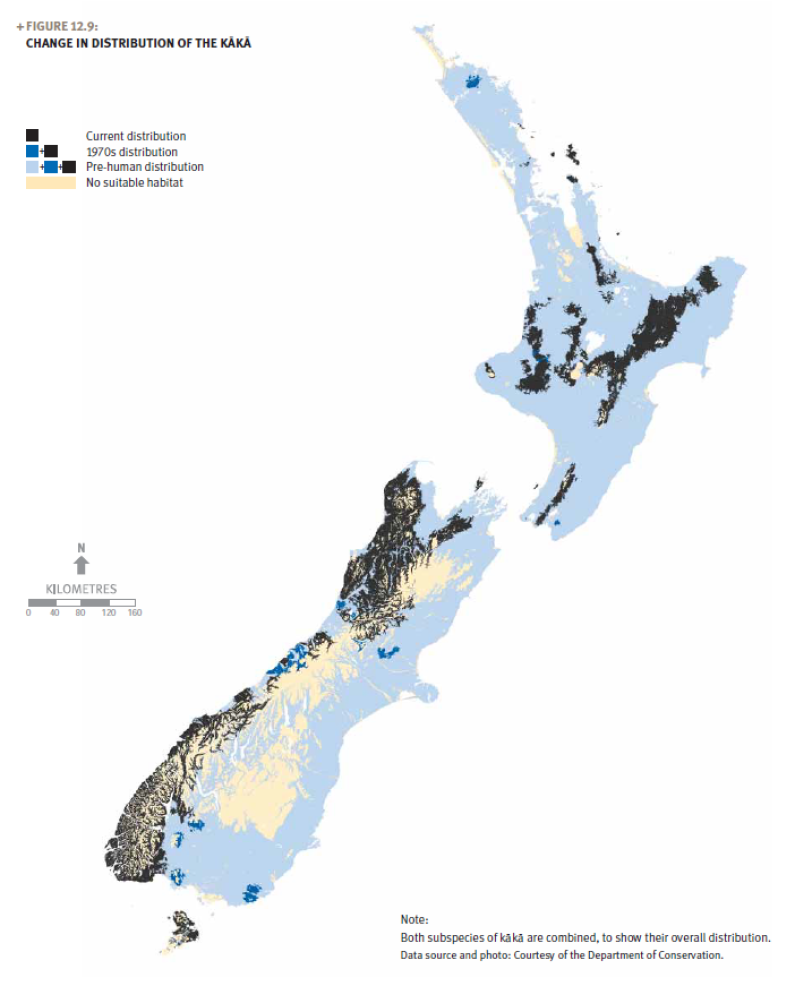

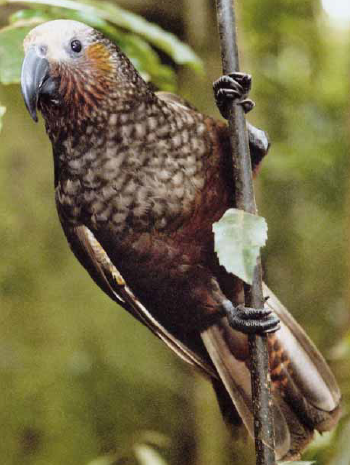
Image: Kākā (Nestor meridionalis).
The kākā is a large, endemic forest parrot whose diet includes berries, seeds, nectar, and invertebrates. The kākā plays an important role in native forests by pollinating flowers and breaking up rotten wood, speeding its decay.
There are two subspecies; the North Island kākā (N. meridionalis septentrionalis), and the South Island kākā (N.m. meridionalis). Both are classified as nationally endangered due to the loss of their habitat in the past, coupled with the current pressure from predators like possums and stoats.
In areas without predator control, most kākā nests do not produce young and many nesting females are killed. Predator control in protected forest blocks has resulted in a rapid increase in kākā numbers in those areas.
With effective predator control, about 80 per cent of the nests produce young, which is a marked increase in breeding success, and far more breeding females survive.
In the 19th century, kākā were abundant throughout forests in the North and South Islands, but by 1930 they had become more localised. North Island kākā are now almost absent from many large forested areas with high levels of predators. They are still common in some central North Island forests, but even within these strongholds kākā are thought to be declining. They are still also common on some larger offshore islands.
The South Island subspecies is still widespread, although low in number, and has become progressively more common on the West Coast of the South Island to Fiordland, and on Stewart Island.
Kākā currently occupy less than 20 per cent of their original range, and recent evidence suggests that most populations without predator control are declining and remaining populations may consist of predominately males (Moorehouse et al, 2003). Since the 1970s, the kākā’s range has contracted a further 6 per cent.
Figure 12.10: Change in distribution of the kōkako

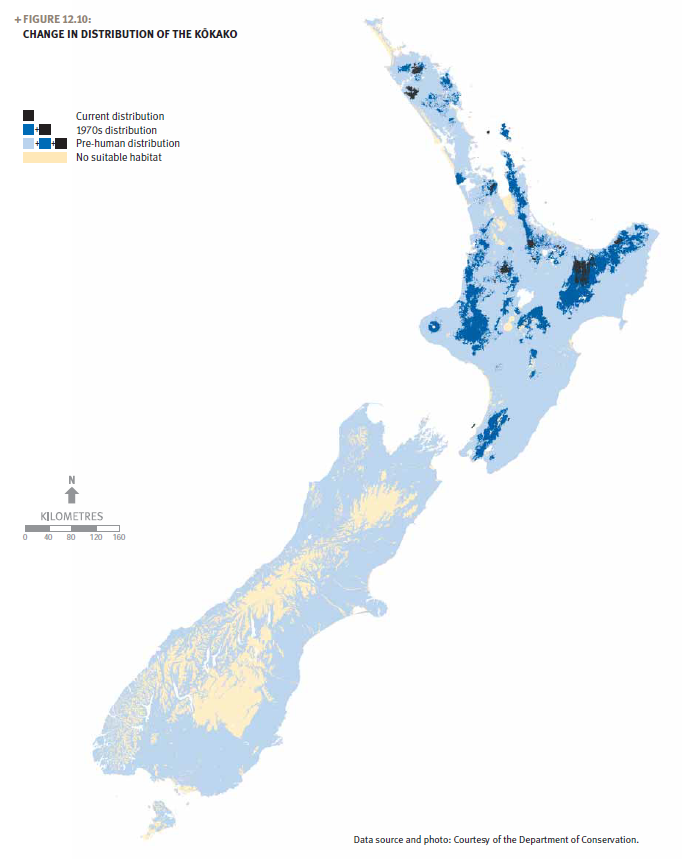
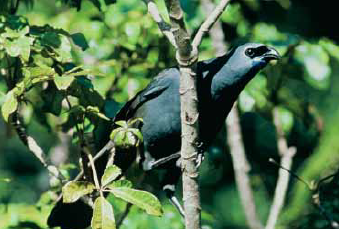
Image: North Island kōkako (Callaeas cinerea).
The kōkako belongs to the endemic New Zealand wattlebirds, an ancient family that includes the North and South Island saddlebacks and the extinct huia. The kōkako feeds on foliage, fruits, and invertebrates, and is well known for its beautiful song.
Currently, about 750 pairs of kōkako occur in several isolated populations in the central and northern North Island, mainly in podocarp hardwood forests. The North Island kōkako (C. cinerea wilsoni) is classified as nationally endangered.
The South Island kōkako (C. c. cinerea) is classified as extinct. Although deforestation in the past centuries has resulted in a substantial loss of habitat, possums, rats, and stoats are the main threat to kōkako populations at present.
The management of kōkako is guided by a recovery plan, and recent management of the remaining North Island populations has reversed their overall decline. For kōkako populations to increase, possums and rats need to be controlled to low levels.
Before human settlement, kōkako were widespread and common. Until 1995, there was a marked decline in kōkako numbers, but recent management of the remaining populations has reversed that trend and the national population is increasing.
Kōkako are currently present in 2 per cent of their estimated natural range. Since the 1970s, their range has been reduced by a further 90 per cent. There have been successful transfers to offshore islands.
Figure 12.11: Change in distribution of the mōhua
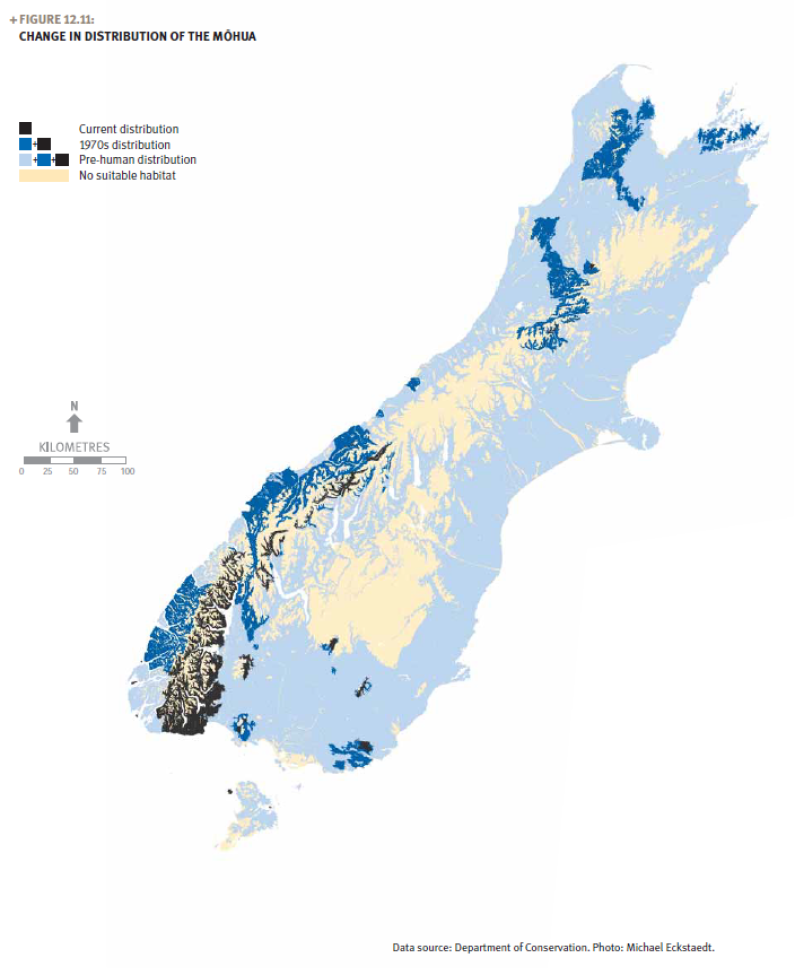

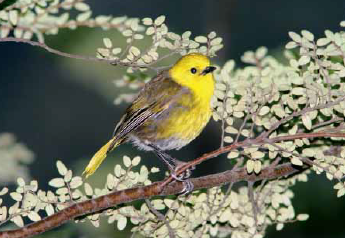
Image: Mōhua (Mohoua ochrocephala).
Small, insectivorous forest birds, mōhua are members of the genus that includes the whitehead and brown creeper. They nest in holes, usually high in beech trees, and are a host of the long-tailed cuckoo.
Mōhua are found only in South Island forests. In the 1800s, they were one of the most abundant and conspicuous forest birds, inhabiting all forest types across the South Island and Stewart Island. Deforestation and the introduction of mammalian predators caused their decline, and the population has declined by 90 per cent since European settlement. The mōhua is currently classified as nationally endangered.
The management of the species is guided by a recovery plan that includes controlling rats and stoats following beech masts (these are the infrequent fruiting events of native beech trees). Mōhua have been introduced to several predator-free islands, where their numbers have increased rapidly.
Mōhua are found only in South Island forests. Their distribution has become very fragmented and the species is now confined to beech forest.
They are present in 5 per cent of their estimated natural range. Since the 1970s, their range has contracted by almost 70 per cent, and in areas where there is no predator control, mōhua numbers are continuing to decline.
Figure 12.12: Change in distribution of the wrybill
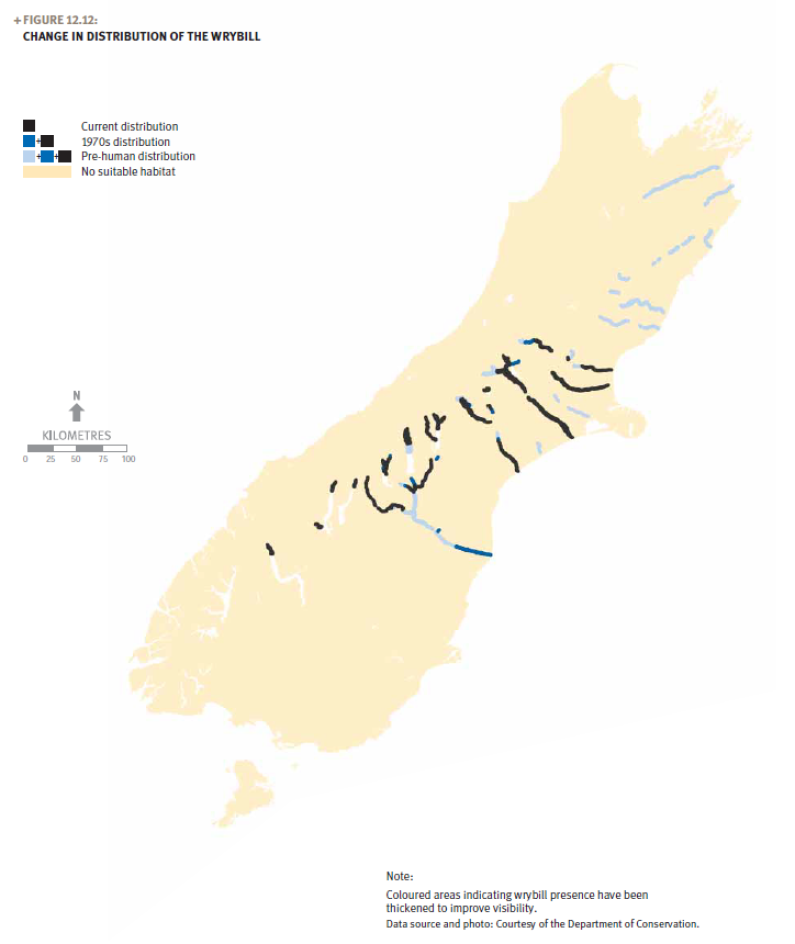

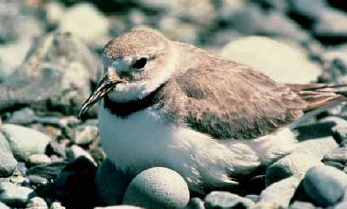
Image: Wrybill (Anarhynchus frontalis).
Wrybills are small endemic shorebirds that are highly specialised for breeding in braided rivers. Their unique bill is adapted to finding mayfly and caddisfly larvae under riverbed stones. They migrate north each year, with most wrybill wintering in the large harbours around Auckland.
Within their current breeding range, wrybill have disappeared from most small rivers, and are now confined to several large catchments. About 5,000 remain, and the species is classified as nationally vulnerable. The main threats to wrybill include mammalian predators (particularly stoats), flooding, and the loss and degradation of suitable habitats.
The maintenance of this species’ range in the long term will require predator control, coupled with a reduction in the many human impacts on riverbeds.
Wrybills currently breed only in braided rivers east of the main divide in Canterbury and northern Ōtago. They previously bred in a number of Marlborough rivers, but their range has contracted southwards in the past 100 years.
They now occupy about 60 per cent of their estimated original range.
Figure 12.13: Change in distribution of dactylanthus
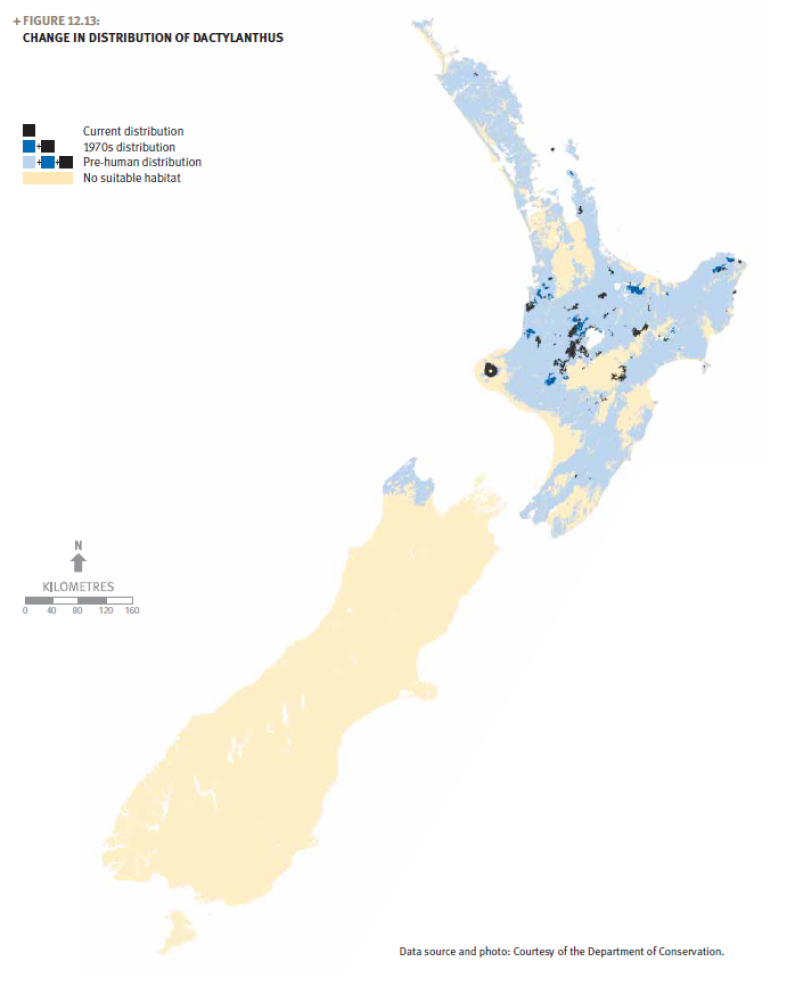

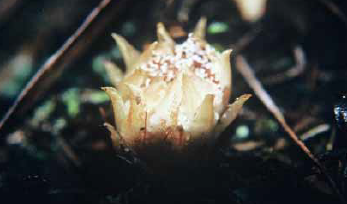
Image: Dactylanthus (D. Taylorii).
Dactylanthus is New Zealand’s only fully parasitic flowering plant. It grows a root-like stem that is attached to the root of a host tree. The host root moulds into the shape of a fluted wooden rose, giving the plant its common name, woodrose. It is pollinated by the lesser short-tailed bat.
This plant has never been considered common, and occurs in widely scattered sites. Currently there are likely to be only a few thousand remaining. Dactylanthus has the threat classification of serious decline. Threats to it include deforestation, collectors, and browsing by possums, rats, and pigs. Declines in species that are its natural pollinators and seed-dispersers probably also have an impact.
The management of dactylanthus is guided by a recovery plan that incorporates the exclusion of predators by using simple cages, and by the hand-pollination of flowers.
Dactylanthus is found from Northland to the Wairarapa, with the largest populations in East Cape and on the Central Plateau. There is also a small population on Little Barrier Island. However, the distribution and number of plants has declined recently, and there are likely to be only a few thousand remaining.
Dactylanthus is currently distributed in only 4 per cent of its former range, with its range decreasing 32 per cent since the 1970s.
More about New Zealand’s common native birds
Some of our more common native birds have shown an increase in distribution in recent years, particularly in certain urban areas (Robertson et al, 2007). It is thought that this increase is due to intensive local pest control efforts and plantings of native plants in gardens to attract these species.
For example, tūi, bellbird/korimako and New Zealand pigeon/kererū are important pollinators and seed dispersers for many of New Zealand’s trees and shrubs. These are among the 27 native species that have increased in distribution since 1985, as shown in Table 12.9 (or 28 per cent of the 96 observed species).
Table 12.9 also shows that, despite some gains with our more common birds, the same percentage (28 per cent) of New Zealand’s birds have also decreased in distribution since 1985. However, 93 per cent of these are endemic species (those that do not naturally occur elsewhere in the world).
Table 12.9: Summary of observed changes in distribution of birds, 1985–2004
| Trend | Endemic species | Native species | Total |
|---|---|---|---|
| Increase | 15 | 12 | 27 |
| No change | 26 | 16 | 42 |
| Decrease | 25 | 2 | 27 |
| Total | 66 | 30 | 96 |
Source: Adapted from Robertson et al, 2007.
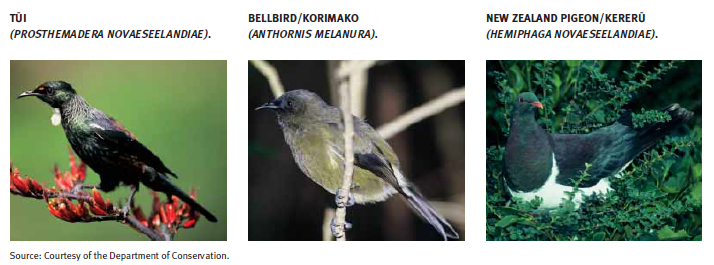
Image: Courtesy of the Department of Conservation.
Pest management in New Zealand
Following the initial large-scale deforestation of New Zealand before and during the 19th century, the habitat for many threatened vertebrate species in New Zealand has largely come under legal protection.
However, introduced predators and competitors such as stoats, rats, and possums continue to reduce the populations of some of our most at-risk bird species. They do so by feeding on eggs, chicks, and adults, and by competing for food and nesting sites.
Protecting native species from predation and competition by introduced animals and weeds is therefore critical if we are to sustain the remaining populations and avoid further biodiversity loss. Protection largely relies on ongoing control of animal pests and weeds.
Pests are unwanted organisms that adversely affect ecosystems and directly compete with native or commercial species. Established introduced pest species are the single largest threat to New Zealand’s remaining biodiversity (Department of Conservation and Ministry for the Environment, 2000), and substantial efforts are directed towards controlling and eradicating them.
New Zealand’s biosecurity system is a multi-agency programme that aims to exclude unwanted organisms at the border, and to control incursions and growth of pest populations within the country. It aims to exclude and control the invasive species that threaten our natural species and ecosystems, and those species that underpin our primary production sector.
Biosecurity efforts include pest management for conservation and animal health purposes. Because bovine tuberculosis (Tb) – a disease affecting livestock and humans – is transmitted by possums, the control of possum numbers has benefits for both conservation and New Zealand’s farming industry.
However, reducing the risk of Tb-transmission from possums to cattle may not be enough on its own to protect our native biodiversity. In addition, when low Tb levels have been achieved, and possum management ceases, biodiversity gains may be reversed in some areas.
Figure 12.14 shows the areas of the country where possum control or surveillance is carried out by the Animal Health Board (the organisation responsible for managing and implementing the National Pest Management Strategy for bovine Tb) and the Department of Conservation. Other pest groups such as rodents, mustelids (primarily stoats), cats, hedgehogs, pest grazers (including rabbits), and weeds are also managed in some of these areas.
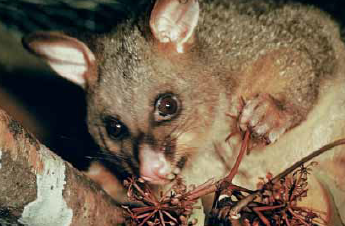
Image: Courtesy of the Department of Conservation.
Figure 12.14: Areas where sustained management of brushtail possums is carried out by the Department of Conservation and Animal Health Board, 2006
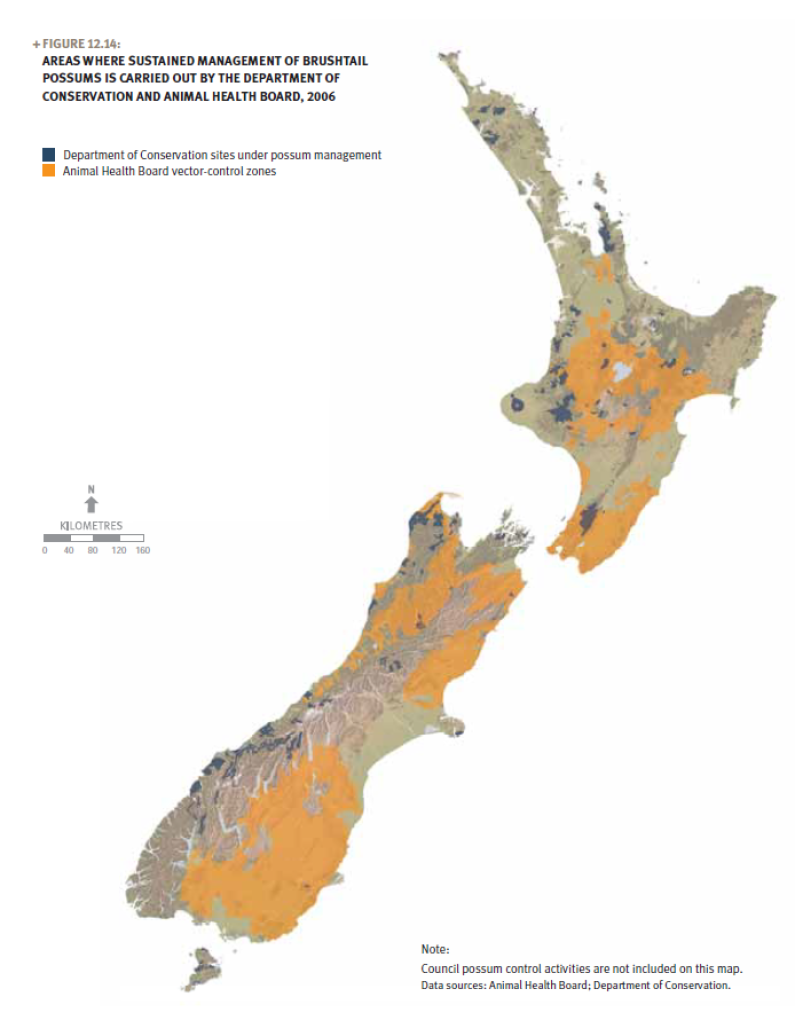

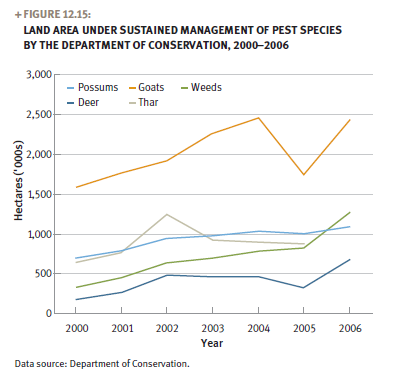
In the past decade, animal pest and weed control efforts have significantly increased in their extent and intensity. Table 12.10 shows the area managed for pest groups within mainland public conservation lands. Figure 12.15 shows the trend in the land area receiving sustained control for possums, deer, goats, thar, and weeds.
As an example, since 2000, the area of Department of Conservation land under sustained management for possums has increased by 60 per cent, from 669,000 hectares to 1,069,000 hectares in 2006. Within sustained pest control areas, targeted pest treatment also increased from 40,000 hectares in 1991 to 302,000 hectares in 2006.
The area controlled for possums by the Animal Health Board has also increased by 40 per cent, from 6,153,200 hectares in 2001 to 8,870,000 hectares in 2006.
This results in a total of 9,939,000 hectares under sustained possum management in 2006, which constitutes about 37 per cent of New Zealand’s total land area. The figure excludes all council and private management activities.
Control methods (for example, trapping, culling, and poisoning), the ease of access to affected ecosystems, the threat to biodiversity, the range of pests present, the severity of a pest’s impact on native species, and the available resources largely determine the pest control effort and which pest group is targeted.
Table 12.10: Pest management on public conservation lands by pest group and area under management (2005/2006)
| Pest group | Area managed (Hectares) |
|---|---|
| Rodents | 312,676 |
| Mustelids/cats | 417,618 |
| Pest herbivores1 | 4,859,498 |
| Weeds | 2,635,405 |
| Possums | 1,078,053 |
Data source: Department of Conservation.
Notes:
1 Pest herbivores include deer, goats, pigs, thar, chamois, wallabies, rabbits, sheep, and cattle.
2 Areas do not total, as in some cases more than one pest is managed in the same area.
Figure 12.15: Land area under sustained management of pest species by the Department of Conservation, 2000–2006

Freshwater pests
Freshwater resources face pressures similar to land-based areas. Introduced fish and aquatic weeds and algae compete with and displace our native aquatic plants and animals. Pest aquatic plants have invaded 61 per cent of lakes in New Zealand (National Institute of Water and Atmospheric Research, pers comm).
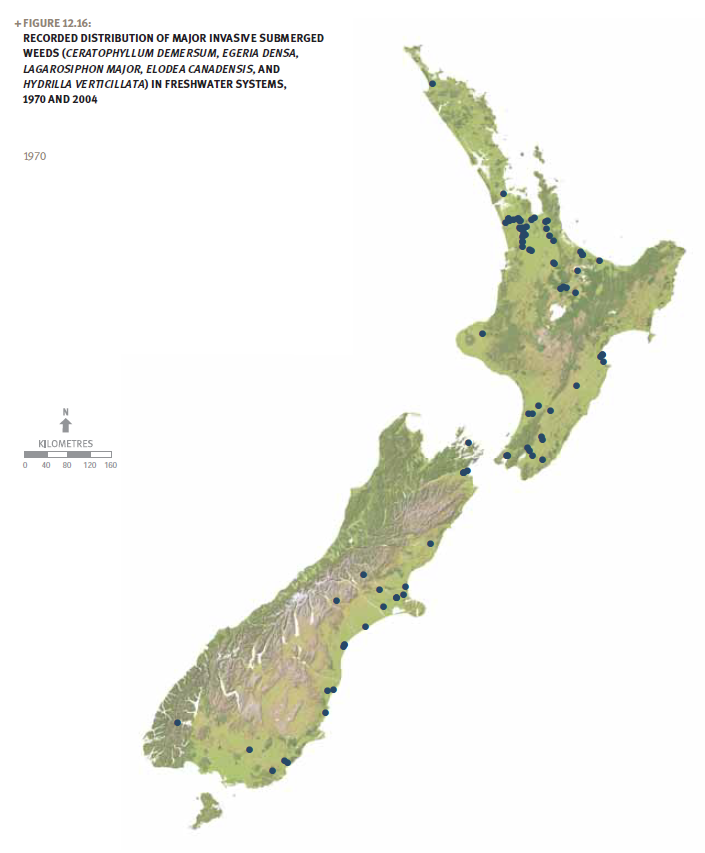
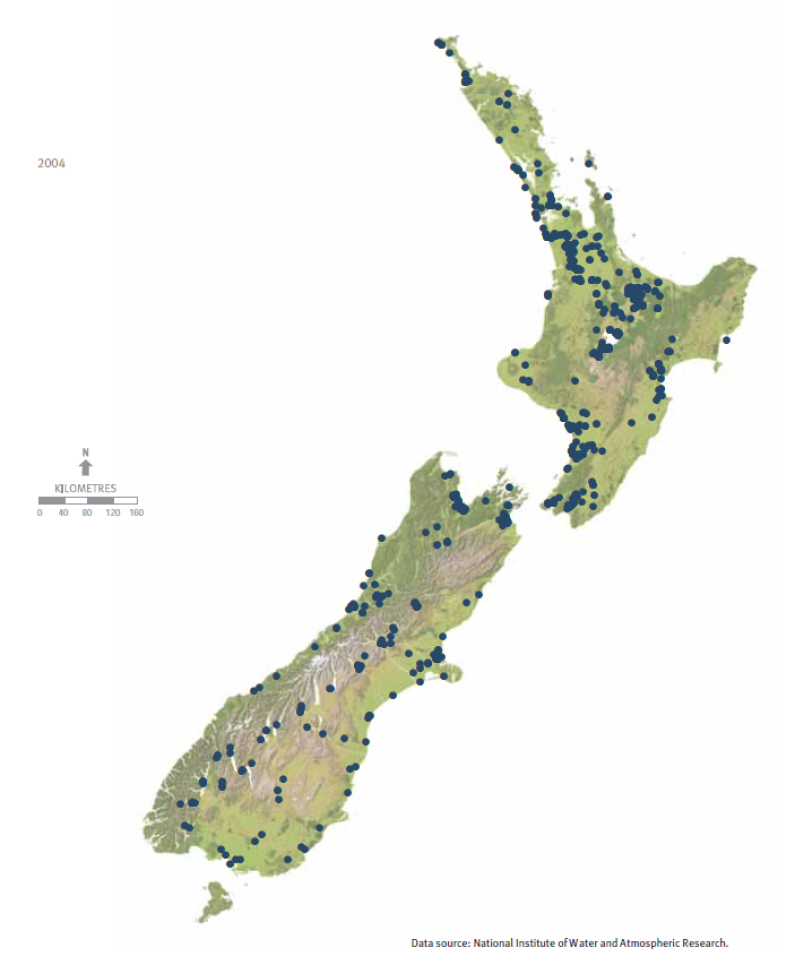
The monitoring of five major aquatic weeds (Ceratophyllum demersum, Egeria densa, Lagarosiphon major, Elodea canadensis, and Hydrilla verticillata) shows a jump in recorded incidences of these pest species, from 95 sites in 1970, to 778 sites in 2004 (Figure 12.16).
Figure 12.16: Recorded distribution of major invasive submerged weeds (Ceratophyllum demersum, Egeria densa, Lagarosiphon major, Elodea canadensis, and Hydrilla verticillata) in freshwater systems, 1970 and 2004


What is didymo (‘rocksnot’)?
Didymosphenia geminata – known as didymo, or ‘rocksnot’ because of its slimy appearance – is an introduced freshwater alga.
While it does not pose a risk to human health, didymo can form large algal mats on the bottom of rivers and streams and, occasionally, on lake edges. As these mats smother rocks, they can reduce the availability of suitable habitats for freshwater fish, invertebrates, and plant species. The presence of didymo may also affect riverbed bird species, such as the wrybill, by reducing their prey numbers and access to waterways.
As a result, didymo has been classed as an unwanted organism (pest species) under the Biosecurity Act 1993.
Didymo occurs naturally in northern parts of the northern hemisphere. It was first identifi ed in New Zealand in October 2004 in the Lower Waiau River in Southland and was the first recorded occurrence in the southern hemisphere.
Since then, it has spread to a number of other river catchments in the South Island. By June 2007, it was found in 55 South Island rivers (Biosecurity New Zealand, 2007), but North Island rivers remain free of the pest. However, many rivers in the North Island, particularly around the central Volcanic Plateau, have environments that are suitable for didymo to take hold.
Didymo is easily spread between waterways on boating, fishing, or other equipment that has not been thoroughly cleaned. It is estimated that up to 50 per cent of all waterways in New Zealand are at risk of didymo incursion (Kilroy et al, 2005).
Intensive biodiversity conservation efforts
Conservation on offshore islands
Pest eradication, as opposed to pest control, can be accomplished in isolated areas that have low risk of reinvasions. Offshore islands that have remained free or have been cleared of introduced predators have been invaluable for the survival of many of New Zealand’s most threatened species (Atkinson, 2001). In these environments, species may establish new populations in safe havens, free of introduced pests.
Conservation on the mainland
Habitat limitations mean New Zealand’s threatened native biodiversity cannot be sustained on offshore islands alone. On the mainland, a number of areas have undergone intensive pest control to hold pest numbers at low thresholds (Table 12.11). These include the Department of Conservation’s ‘mainland island’ projects (1995–1996), kiwi sanctuaries, Operation Ark (2003), and other projects initiated by community groups.
Table 12.11 shows that over 500,000 hectares of land are under intensive pest management by the Department of Conservation on offshore islands and the mainland.
Table 12.11: Area under intensive pest management by the Department of Conservation, 2006
| Type of area | Area (Hectares) |
|---|---|
| Offshore islands | 153,895 |
| Operation Ark | 208,579 |
| 'Mainland islands' | 64,182 |
| Kiwi sanctuaries | 59,000 |
| Kōkako mainland sites | 15,000 |
| Total | 500,656 |
Data source: Department of Conservation.
Government action on biodiversity
Mainland islands
Six ‘mainland island’ projects were initiated by the Department of Conservation in 1995 and 1996. These are not actual islands surrounded by sea, but areas that are intensively managed on mainland New Zealand to restore native ecosystems. In total, more than 64,000 hectares and a range of native species are intensively managed at these six sites.
In less than five years, significant reductions of targeted pests were achieved, resulting in the recovery of many native species, as well as building organisational capability, and providing opportunities for learning.
The ‘mainland island’ projects have produced some measurable conservation outcomes over the last decade.
These include:
- confirming that pest management enhances the recovery of targeted native species and revitalises ecological processes
- demonstrating that biodiversity declines can be halted on the mainland
- providing opportunities for the public to visit and participate in conservation management and to interact with rare species
- improving conservation practices through:
- increasing the effectiveness of predator management techniques and practices
- improving bird translocation techniques
- providing flagship sites that have paved the way for other similar projects.
Kiwi sanctuaries
Much of the work on biodiversity protection is funded by central government in support of the New Zealand Biodiversity Strategy. This includes the Kiwi Sanctuaries programme, aimed at halting the decline of kiwi populations and decrease in their range in most mainland areas.
There are three kiwi sanctuaries in the North Island and two in the South Island. Each of these sanctuaries protects a different kiwi species or special population. Intensively managed sanctuaries and kiwi zones now play a key role in turning around the decline in kiwi numbers on New Zealand’s mainland.
Operation Ark
The Department of Conservation’s Operation Ark projects were established after the populations of orange-fronted kākāriki and mōhua more than halved, following rodent and stoat plagues in South Island beech forests in 2000 and 2001.
The areas selected span more than 200,000 hectares throughout the South Island. They include four of the most important sites for mōhua and blue duck/whio populations, sites containing the last two populations of the lesser short-tailed bat, and the key sites for orange-fronted kākāriki.
The operation involves progressively expanding possum control and setting tens of thousands of stoat and rat traps in permanent trap lines throughout the 11 ‘Ark’ areas.
Local action on biodiversity
Regional councils and territorial authorities use a range of tools to support native biodiversity.
These include:
- conservation covenants and help with establishing QEII National Trust covenants
- subdivision controls
- incorporation of biodiversity protection in management plans and agreements
- rates relief for land under private conservation covenant
- education and advice for land owners
- support for volunteer community groups, landcare groups, and conservation trusts, and waiving consent fees.
Since 1997, the extent of council effort and expenditure on biodiversity protection has increased. Regional councils now invest more than $4.26 million per year in contestable biodiversity funds. Many of these funds support on-the-ground activities such as covenants, landcare groups, education, and land owner advice.
One example is the Biodiversity Condition and Advice Fund, which aims to enhance the management of native biodiversity outside public conservation lands. By May 2006, these funds had directly benefited 4,800 private land owners, either through advice received or work undertaken on their property to protect biodiversity.
Some other examples of regional council approaches to protect local biodiversity are:
- provisions for native biodiversity in the regional policy statements for Taranaki, Hawke’s Bay, Wellington, Canterbury, and Ōtago
- extensive biodiversity programmes in Auckland Regional Council’s regional parks, such as:
- protection programmes (including predator control) for threatened shorebirds in many coastal regional parks (such as Whakanewha, Wenderholm, and Mahurangi), many of them in conjunction with community groups
- the Ark in the Park initiative, a joint programme with the Royal Forest and Bird Protection Society to restore birds to the Waitākere Ranges
- a joint programme with the Department of Conservation to conserve kōkako in the Hūnua Ranges Regional Park
- a sanctuary (‘mainland island’) established at Tawharanui in 2004
- coastal care groups operated by several regional councils (such as Waikato and Bay of Plenty).
Local plant and animal pest control also plays an important role in maintaining New Zealand’s native biodiversity. All regional councils help control the animals and weeds that have been identified as pests in their regions, although land owners have the primary responsibility for pest management on their properties.
Much of the pest control work undertaken for the benefit of agriculture, such as the control of bovine Tb, also has direct benefits for biodiversity. Most of these programmes are aligned or integrated with biodiversity pest control carried out by the Department of Conservation, the QEII National Trust, and community groups.
The 1997 report, The State of New Zealand’s Environment 1997 (PDF, 9.6MB), concluded that:
Biodiversity decline is New Zealand’s most pervasive environmental issue, with 85 per cent of lowland forests and wetlands now gone, and at least 800 species and 200 subspecies of animals, fungi and plants considered threatened. …
The main pressures on [native] biodiversity today are insufficient habitat in lowland areas, declining quality of many of the remaining land and freshwater habitats, the impacts of pests and weeds and, for some marine species and ecosystems, human fishing activities. …
The main responses to biodiversity decline have focused on ecosystem and species recovery programmes on offshore islands and extensive pest control operations on the mainland, but the need for partial restoration of representative [native] lowland and coastal ecosystems and for wider protection of marine ecosystems has yet to be addressed. …
Pest control, especially possums, is now a vital means of protecting our environment as well as being important for our economy. Pest control will need to become increasingly safe, humane and cost-effective to remain economically and socially sustainable.
(Ministry for the Environment, 1997, chapter 10.)
New Zealand’s biodiversity profile
New Zealand continues to be regarded as a significant contributor to global biodiversity. A comparatively large proportion of our estimated 80,000 species of native animals, plants, and fungi do not occur naturally anywhere else on earth.
While many populations of some of our most threatened species have now stabilised under conservation management, the task of halting biodiversity loss is still a challenge in New Zealand today, as it was in 1997.
Almost 2,500 native land-based and freshwater species remain listed as threatened. All 10 threatened indicator species discussed in this chapter have shown a continuing decline in their habitat range.
In 2007, New Zealand’s biodiversity faces the same pressures as 10 years ago. Introduced animal and plant pest species remain a serious threat to New Zealand’s biodiversity. Native plants and animals that survived the initial habitat modification caused by human settlement continue to be threatened by introduced predators and competitors.
Native vegetation
Although 11.7 million hectares (44.8 per cent) of New Zealand’s land mass is in native vegetation in 2007, it is largely restricted to hill country and alpine areas.
Wetlands and lowland forests remain among New Zealand’s most threatened habitats and ecosystems. While these areas are now receiving greater conservation attention, they remain underrepresented in legally protected areas. This has implications for the threatened species that require unmodified lowland habitats to survive.
Between 1997 and 2002 native land cover decreased by an estimated, 16,500 hectares (0.12 per cent). This total decrease included an increase of 700 hectares of non-vegetative native cover, such as sand and gravel, and a decrease of 17,200 hectares of native vegetative cover. These changes either occurred through conversion of land to other uses, or as a result of natural process.
Since 1997, the clearance of native forests has reduced to low levels as a result of sectoral initiatives and stronger legislation, such as the New Zealand Forest Accord 1991 and the amendments to the Forests Act 1949, the latter of which stopped the clear-felling of native forest. However, other types of New Zealand native land cover, such as broadleaved native hardwoods, mānuka and kānuka, and tall tussock grassland, continue to be modified.
While climate change is expected to have a significant impact on some aspects of New Zealand’s biodiversity, climate-change policies are likely to reinforce current efforts to protect native vegetation.
Land conservation
By international comparison, a high proportion of land in New Zealand is now set aside for conservation purposes. Just over 32 per cent of our total land area is legally protected, either as public conservation land or through conservation initiatives on private land, such as the QEII Trust covenants.
The amount of public conservation land has increased significantly since 1997. For example, 8.06 million hectares were set aside in New Zealand for public conservation land in 2004. By October 2007, a total of 8.43 million hectares were legally protected. This represents an increase of 4.56 per cent in less than three years, which has been achieved partly through the buy-back of Crown-owned land that was formerly leased or licensed to others.
Conservation efforts on private land have also increased significantly. In 2004, a total of 146,280 hectares were registered as formally protected private land. By June 2006, the QEII Trust and Ngā Whenua Rāhui protected a total of 221,473 hectares – an increase of 51.4 per cent over this two-year period.
Introduced species and pest control
Since 1997, controlling pest animals and weeds has received greater attention as a conservation tool. The extent and intensity of pest control effort has increased significantly on both public and private land, driven partly by the increased local funding for pest management made available by regional councils and other agencies. At present, priority is given to controlling pests in the habitats of New Zealand’s most threatened species.
The area managed for targeted pests by the Department of Conservation has increased significantly since 1997. For instance, between 2000 and 2006, areas targeted for possum management by the Department of Conservation increased by 60 per cent. Those targeted by the Animal Health Board have increased by 40 per cent since 2001. Together, areas targeted by the Department of Conservation and the Animal Health Board for possum management equate to around 37 per cent of New Zealand’s land area.
Since 1997, pest control has become more effective as technology and knowledge have improved. The recent introduction of new Department of Conservation traps for stoats, as well as enhanced control regimes on the Department’s offshore and ‘mainland island’ projects, show how pest control is evolving in New Zealand. These efforts have been invaluable in securing habitats for threatened populations and improving conservation techniques and practices.
Stringent pest control to the point of excluding introduced species from areas is a comparatively new conservation strategy. This has enabled endangered species to be successfully reintroduced to reserves on the mainland.
Increased biosecurity is now recognised as a key measure to protect New Zealand from new pest plants and animals. This is important not only for our native biodiversity, but also for the introduced species on which much of our economy depends.
Focus on ecosystems
Conservation efforts on New Zealand’s offshore islands have been invaluable in securing habitats for threatened populations and for improving conservation techniques and practices. Increasingly, habitat with adequate protection for threatened species on the mainland is provided through various initiatives.
Since 1997, our conservation efforts have extended from species-specific conservation, towards ecosystem conservation that enables whole communities of species to survive. This focus on ecosystems recognises the high level of interdependence between some species within the same ecosystem, and is reflected in recently developed national policies (for example, the New Zealand Biodiversity Strategy, 2000).
Attention has also turned to protecting the endangered native species and ecosystems on private land.
Future priorities
As a result of our experience in trying to halt the serious decline in some of our native species, New Zealand is now considered a world leader in conservation and restoration efforts (Saunders and Norton, 2001).
In the future, conservation priorities are likely to continue to focus on improved pest control and biosecurity protection, and on increasing the legal protection for those land environments and ecosystems that are not well represented in areas legally protected for conservation purposes. Attention is also likely to focus on the impacts of climate change on our native biodiversity.
Atkinson, I, Campbell, D, Fitzgerald, B, Flux, J, and Mead, M. 1995. Possums and possum control: effects on lowland forest ecosystems (PDF, 257KB). Wellington: Department of Conservation.
Atkinson, I. 2001. Introduced mammals and models for restoration. Biological Conservation vol 99, pp 81–96.
Biosecurity New Zealand. 2007. Didymo. Retrieved from http://www.biosecurity.govt.nz/pest-and-disease-response/pests-and-diseases-watchlist/didymosphenia-geminata (14 May 2007).
Conservation International. 2007. Biodiversity Hotspots. Retrieved from http://web.conservation.org/xp/CIWEB/regions/priorityareas/hotspots.xml (16 April 2007).
Davis, M. 2002. The state of indigenous biodiversity outside Crown conservation lands in New Zealand, unpublished, prepared for the Ministry for the Environment. Wellington: Ministry for the Environment.
Department of Conservation and Ministry for the Environment. 2000. The New Zealand Biodiversity Strategy: Our chance to turn the tide – Whakakōhukihukitia te tai roroku te tai oranga (PDF, 3MB). Wellington: Department of Conservation and Ministry for the Environment.
Gordon, D P (ed). 2007. The New Zealand Inventory of Biodiversity. Volume 1. Kingdom Animalia: radiata, lophotrochozoa, and deuterostomia. Christchurch: Canterbury University Press.
Hitchmough, R. 2002. New Zealand Threat Classification System Lists – 2002 (PDF, 1.6MB). Department of Conservation, Wellington, New Zealand. (26 July 2007).
Hitchmough, R, Bull, L, Cromarty, P, (compilers). 2007. New Zealand Threat Classification System lists – 2005. Department of Conservation, Wellington, New Zealand. (26 July 2007).
Kilroy, C, Snelder, T, and Sykes, J. 2005. Likely Environments in which the Non-indigenous Freshwater Diatom, Didymosphenia Geminata, Can Survive in New Zealand (PDF, 1MB). Christchurch: National Institute of Water and Atmospheric Research.
Ministry for the Environment. 1997. The State of New Zealand’s Environment 1997. Wellington: Ministry for the Environment and GP Publications.
Ministry for the Environment. 2004. A Snapshot of Council Effort to Address Indigenous Biodiversity on Private Land: A report back to councils. Wellington: Ministry for the Environment.
Moorhouse, R, Greene, T, Dilks, P, Powlesland, R, Moran, L, et al. 2003. Control of introduced mammalian predators improves kākā (Nestor meridionalis) breeding success: Reversing the decline of a threatened New Zealand parrot. Biological Conservation 110, pp 33–44.
Organisation for Economic Co-operation and Development. 2007. OECD Environmental Performance Reviews: New Zealand (PDF, 4.2MB). Paris: OECD Publishing.
Patterson, M, and Cole, A. 1999. Assessing the Value of New Zealand’s Biodiversity. Palmerston North: School of Resource and Environmental Planning, Massey University.
Ramsar Convention. 2007. Key Documents of the Ramsar Convention: The Ramsar list of wetlands of international importance. Retrieved from http://www.ramsar.org/key_sitelist.htm (11 June 2007).
Robertson, C J R, Hyvonen, P, Fraser, M J, and Pickard, C R. 2007. Atlas of Bird Distribution in New Zealand, 1999–2004. Wellington: The Ornithological Society of New Zealand Incorporated.
Saunders, A, and Norton, D A. 2001. Ecological restoration at mainland islands in New Zealand. Biological Conservation vol 99, pp 109–119.
Worthy, T H. 1987. Palaeoecological information concerning members of the frog genus Leiopelma: Leiopelmatidae in New Zealand. Journal of the Royal Society of New Zealand vol 17, pp 409–420.
Chapter 12: Biodiversity
December 2007
© Ministry for the Environment