New Zealand administers the sixth largest marine environment in the world.
New Zealand’s marine area
At more than 4.4 million square kilometres, our marine environment is about 14 times larger than our land area. We use our marine area for many purposes, including transportation, fisheries, recreation, and tourism, and value it for its cultural and spiritual significance.
Our economy and the marine environment
Many of New Zealand’s economic activities depend on our marine environment. More than 99 per cent of our exports are transported by sea. Our marine industries are worth an estimated $3.3 billion (about 3 per cent of gross domestic product), including $1.34 billion in fisheries exports.
Marine biodiversity
Our marine environment contains a diverse range of ecosystems, including subtropical and subantarctic waters, inter-tidal estuaries, and seabed trenches.
As much as 80 per cent of New Zealand’s plant and animal species occurs in the marine environment and 44 per cent of these are not found anywhere else in the world. Little is known about many of New Zealand’s marine species.
Impact of human activities
By international standards, New Zealand enjoys abundant marine resources and healthy marine environments offshore where much of the environment is not easily accessible. About 30 per cent of our marine environment, however, is thought to experience some degree of disturbance from human activities.
As our population and technological capability grow, so do the pressures we put on our marine environment.
These pressures include:
- commercial fishing and trawling, which have the greatest impact on our oceans, both inshore and offshore
- increasing land development, which has increased discharges of land-based pollution, stormwater, nutrients, and sediments to the ocean
- marine spills which can put pressure on our marine environment in some areas
- climate change, which is expected to have a significant impact on our oceans and coasts.
Commercial fishing and trawling
In 2006, the commercial fi shing industry caught about 525,000 tonnes of fish in New Zealand waters. Sixty-five per cent of this catch was from fish species that have been scientifically assessed. Of these species, 85 per cent have been sustainably fished. Fifteen per cent have been overfished and rebuilding strategies are in place.
Large commercial vessels conducted about 970,000 seabed trawls between 1990 and 2005. During this period, the area swept by trawls averaged around 55,000 square kilometres each year. Since 1998, the area trawled by large commercial vessels has reduced to about 50,000 square kilometres in 2005, probably due to reductions in the allowable catch for some high-value species. Between 1990 and 2005, an estimated 3.5 million dredges and trawls were undertaken by smaller vessels.
The environmental effects of trawling activity on our seabed are not well monitored.
Water quality at coastal swimming spots
Water quality at our coastal swimming spots is primarily affected by human activity on land. Over the 2006/2007 summer, 80 per cent of the 380 monitored beaches had safe levels of bacteria almost all the time. Only 1 per cent of sites breached bacterial guidelines regularly. Water quality at our beaches appears to have improved in recent years.
Threatened marine species
Of the almost 16,000 known marine species in New Zealand, 444 are listed as threatened. Well-known species of concern include the Hector’s dolphin (both subspecies), New Zealand sea lion, southern right whale, Fiordland crested penguin, and New Zealand fairy tern.
By international standards, a high proportion (62 per cent) of our ocean-going seabirds are listed as threatened. Two species, the Campbell mollymawk and the black petrel, have shown signs of recovery in recent years. However, over the past three years, seven species have had their threatened species status upgraded.
Protecting our marine ecosystems, habitats, and species
A range of measures protect our marine ecosystems, habitats, and species, including marine reserves. Thirty-one marine reserves cover 7 per cent of our territorial sea – a high proportion by Organisation for Economic Co-operation and Development standards. Nearly half of these reserves have been established since 2000, and the area designated as marine reserve has nearly doubled in that same period. However, 99 per cent of our protected area is found in two offshore marine reserves, and some key habitats remain unprotected. Marine reserves are expected to play a signifi cant role in protecting our marine biodiversity.
Fisheries closures are in place for sensitive habitats such as seamounts, and it has been agreed that 30 per cent of the Exclusive Economic Zone will be closed to seabed trawling. Customary restrictions and closures also play an integral part in fisheries management.
Present and future management
In recent years, management of New Zealand’s marine environments has focused on:
- better understanding the wider ecosystem effects of human activities on our marine environment
- establishing a national network of marine protected areas.
Recent years have also seen the emergence of innovative local initiatives for coastal management such as in the Fiordland Marine Area.
In future, increasing attention is likely to be given to the impact of introduced species and climate change on our marine ecosystems, fisheries, and marine species.
Land-based pressures on the inshore marine environment and pressures on fisheries stocks are likely to continue to need careful management into the future. Balancing the competing needs of users of our marine area is likely to become more urgent in the future as our population increases and technology advances. Demand will increase for accurate information to help set priorities for the future use and protection of our marine area.
New Zealand’s marine area
New Zealand administers the sixth largest marine area in the world. At more than 4.4 million square kilometres, it is about 14 times larger than our land area (Organisation for Economic Co-operation and Development, 2007).
New Zealand contains an archipelago of more than 330 islands with 18,218 kilometres of coastline (Department of Conservation, 2007) extending from subtropical to subantarctic waters7 over 30 degrees of latitude (see Figure 11.1).
7 This chapter does not discuss marine areas in New Zealand’s Antarctic territory.
Figure 11.1: New Zealand’s marine area

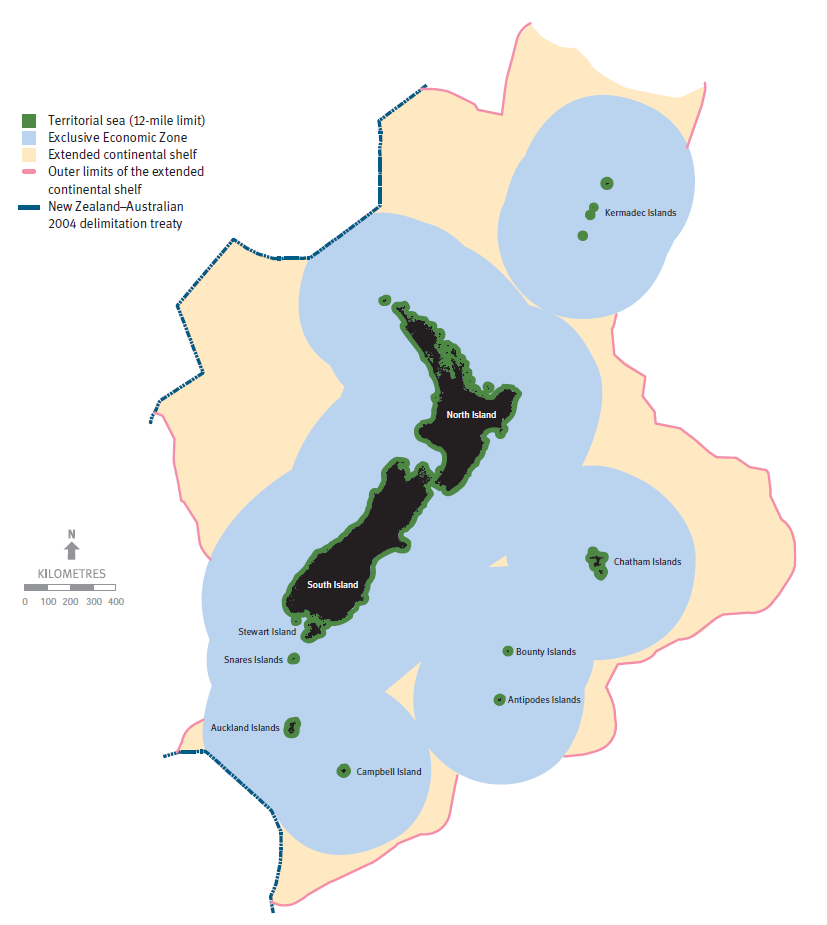
New Zealand’s marine area has three key jurisdictional zones, each of which has a different legal regime. The territorial sea extends seaward from the coast to 12 nautical miles offshore. The Exclusive Economic Zone (EEZ) is the area of sea and seabed that extends from 12 to 200 nautical miles offshore. New Zealand has formally lodged the outer limits of its extended continental shelf – the 1.7 million square kilometres of seabed outside New Zealand’s EEZ – with the United Nations Commission on the Limits of the Continental Shelf.8 The commission is considering the submission. Once confirmed, the extended continental shelf boundary will be binding on other countries.
8 The outer limits of New Zealand’s extended continental shelf remain subject to the delimitation of boundaries with Fiji, Tonga, and possibly France (in respect of New Caledonia).
Biodiversity in the marine environment
New Zealand’s vast marine area contains a diverse range of marine ecosystems, providing habitats for many species. Scientists have formally identified almost 16,000 marine species in New Zealand waters, although it is estimated that tens of thousands of species may still be undiscovered (Gordon, 2007). According to some estimates, the possible number of species in New Zealand waters could be as high as 65,000 (MacDiarmid, 2007). It is estimated that as much as 80 per cent of New Zealand’s biodiversity occurs in the marine environment (Ministry for the Environment, 2006).
Because of New Zealand’s geographical isolation, our marine area, by international standards, has a comparatively high level of endemism (species that do not occur elsewhere), particularly in isolated areas such as Three Kings Islands and our subantarctic islands (Gordon, 2007). Forty-four per cent of our known marine species are endemic (MacDiarmid, 2006). For example, over half of the 24 species of albatross breed in New Zealand and, of those, nine species breed only in New Zealand (MacDiarmid, 2007).
As a result, New Zealand is considered internationally to be an important contributor to global marine diversity. For example, endemic species include:
- about 95 per cent of the 733 known sponge species
- 84 per cent of bivalves and gastropods (types of marine molluscs)
- 75 per cent of ascidians (commonly known as sea squirts).
In addition, a comparatively high proportion of our seabirds (including half of our albatrosses) and a third of our seaweeds are endemic.
See Chapter 12: Biodiversity for information on land-based and freshwater biodiversity.
Importance of our oceans
Most New Zealanders (90 per cent) live within 50 kilometres of the coastline. We use our marine area for many purposes, including transportation, fisheries, recreation, and tourism, and value it for its cultural and spiritual significance. Māori regard the ocean as a taonga (treasure) integral to their culture and identity. Many coastal areas contain culturally significant sites such as urupā (burial grounds) and tauranga waka (canoe landing sites). The ocean is also an important source of food to many New Zealanders.
Healthy oceans deliver a range of important environmental benefits: they absorb and transfer nutrients and sediments from the land, absorb carbon, and regulate heat transfer from the atmosphere. These functions are critical to sustaining life.
Many of New Zealand’s economic activities are dependent on the sea. In 2006, 99.5 per cent of our exports (by weight) were transported by sea (Statistics New Zealand, 2006b). In 2002, the estimated economic value of marine industries was about $3.3 billion (about 3 per cent of gross domestic product), including earnings from shipping, fisheries and aquaculture, offshore minerals, and government and defence.
Considerable value is also generated from other marine activities, such as tourism, research and education, and marine construction (Statistics New Zealand, 2006a).
Fisheries and aquaculture
Export earnings for fisheries in 2006 were worth $1.34 billion, including $187 million in earnings from salmon and mussel aquaculture (Statistics New Zealand, 2007b). Fisheries and aquaculture employ more than 26,000 people, both directly and indirectly (Organisation for Economic Co-operation and Development, 2007).
In 2006, the asset value of fish species managed under New Zealand’s quota management system was estimated to be $3.8 billion, a 40 per cent increase from 1996 (Statistics New Zealand, 2007a). However, New Zealand produces less than 1 per cent of global fisheries output, as much of our EEZ is commercially barren (Organisation for Economic Co-operation and Development, 2007).
Natural factors that affect the marine environment
New Zealand’s marine environment is influenced by its geological history, its isolation, and the action of major ocean currents. Marine life in New Zealand waters is influenced by the range and complexity of our marine habitats.
Longer-term weather cycles also affect New Zealand’s oceans. Together, the atmosphere and the rotation of the earth drive major ocean circulation patterns and climate systems across the world, affecting deepwater and surface currents, sea temperature, sea levels, the productivity9 of our oceans, and seawater chemistry.
Natural inflows of nutrients and sediments into coastal ecosystems are an important part of biological, physical, and chemical cycles in New Zealand’s inshore area. Such cycles are the basis for productivity in these areas. The offshore ocean area is primarily influenced by major oceanic currents.
9 Productivity is a measure of the amount of life that can be supported in an area. It is driven by the availability of nutrients and light (Pinkerton, 2007).
Human factors that affect the marine environment
By international standards, New Zealand enjoys abundant marine resources and healthy marine environments (Organisation for Economic Co-operation and Development, 2007). This is particularly so for our deepwater environments which are not readily accessible. It is estimated that about 30 per cent of New Zealand’s marine environment experiences some degree of disturbance from human activities.
Fishing
New Zealand’s inshore and offshore marine areas are generally subject to different human pressures. The largest single pressure on the marine environment in New Zealand is fishing. In particular, large-scale commercial fishing can have a range of ecological effects, such as destroying habitats and removing large numbers of organisms from the area. Both of these effects have long-term impacts on marine ecosystems, including on the marine food chain. Bycatch (the unintended catch of species other than the target fish) also puts pressure on marine species in some fisheries.
Shipping
Other pressures result from the increasing levels of shipping in New Zealand waters. Shipping can bring new marine species into New Zealand waters. While most introduced species (see box ‘More about introduced marine species’) are harmless, some have had localised but significant effects on marine biodiversity (Dodgshun et al, 2007). For example, the sea squirt Styela clava is expected to have a significant negative impact on aquaculture around the Hauraki Gulf and Lyttelton areas unless it is controlled (Biosecurity New Zealand, 2006).
More about introduced marine species
By 1998, more than 140 introduced marine species had been recorded in New Zealand waters. Since 1998, surveys have confirmed at least 18 new species at 16 of New Zealand’s high-risk ports and marinas (Biosecurity New Zealand, 2007). Most of these probably arrived as a result of shipping activity rather than by natural processes.
Changes to climate and ocean current patterns may bring more new species to New Zealand naturally. For example, rare tropical species are more likely to be observed (and survive) on offshore islands during warmer La Niña years (Evans, 2007). These changes may also allow a greater proportion of the new species that arrive as a result of shipping activity to survive.
Pollution
The past 60 years have seen increasing levels of pollutants, nutrients, and sediments in the inshore marine environment. This increase is the result of urban and agricultural run-off, road run-off, industrial discharges, and air pollution. Estuaries situated in heavily urbanised catchments often have high levels of chemical pollutants (Auckland Regional Council, 2004). Excessive nutrients, particularly nitrogen, from sewage and land run-off have also caused increased algae growth in many of our coastal areas (Robertson and Stevens, 2007). Litter and debris, both from vessels and land-based activities, can also affect marine organisms and pollute waters and coastlines.
Because of land clearance in catchments, wetland drainage, and land development, average sedimentation rates in estuaries are typically at least 10 times higher than they were before Europeans arrived in New Zealand (Robertson and Stevens, 2007).
Marine mining
The mining of fossil fuels such as oil and gas from under the sea floor can put considerable pressure on marine ecosystems. Oil and gas have been produced from New Zealand’s EEZ since the 1960s, from the oilfields in Taranaki, and new fields in the Great South Basin (Associate Minister of Energy, 2007; Ministry for the Environment, 2005).
To date, the extraction of minerals from the sea floor has not been a large pressure on the marine environment because such exploration has not been consistently economically viable. However, several prospecting licences to mining companies have recently been granted for areas on the Kermadec Ridge. These areas are now being explored (Ministry of Economic Development, 2007).
Coastal development
Habitat degradation or loss due to intensive coastal development is a pressure on the inshore marine area. Vulnerable coastal ecosystems including wetlands, mangroves, and coastal lagoons are most at risk from such habitat changes (United Nations Environment Programme, 2006). Many New Zealanders already live on the coastal margin, but previously undeveloped coastal areas have experienced significant development in the last decade.
More about climate change and the oceans
Climate change may significantly affect the marine environment. Increasing levels of atmospheric carbon dioxide are expected to have major implications for the distribution and health of marine biodiversity, because the absorption of carbon dioxide into the ocean increases the acidity of seawater. Organisms such as marine plankton, corals, and shellfish are particularly vulnerable to such a change because it may reduce their ability to form calcium-based shells and skeletons (Hays et al, 2005).
New Zealand waters have shown a small decrease in productivity of about 1 per cent each year in recent years (Pinkerton, 2007). Large-scale changes in productivity resulting from climate change would negatively affect New Zealand’s marine ecosystems and fisheries.
In addition, the sea level has risen an average 0.16 metres in the last century at all four main ports in New Zealand (Hannah, 2004). The rate at which the sea level will rise is predicted to nearly double in the next century (Intergovernmental Panel on Climate Change, 2007).
Changes in sea level are likely to cause complex readjustments in coastal marine habitats and in the physical structure of beaches, estuaries, and sheltered foreshores. Changes to surface and subsurface temperatures could also affect how oceans circulate and the distribution of marine organisms.
The four national environmental indicators for oceans are:
- fish stocks under the quota management system
- seabed trawling in deep waters
- water quality at coastal swimming spots
- marine areas with legal protection.
Understanding how these indicators change will allow us to respond better to existing and emerging pressures on our marine resources.
Fish stocks under the quota management system
The first indicator provides information on fish stocks under the quota management system. To report on this indicator, the following are measured:
- proportion of total commercial catch (by weight) from assessed fish stocks under the quota management system
- status of assessed fish stocks under the quota management system.
Assessed fish stocks
Assessed fish stocks are fish species for which there is enough information to scientifically determine the status of the stock.
Each year, some of New Zealand’s fish stocks are assessed to determine the status of the stock relative to a target level and to ensure the total allowable catch for that stock is set at a sustainable level. Assessment of a fish stock requires significant amounts of data, so it is not always cost-effective or practical to conduct full assessments of all stocks. Therefore, the most valuable and most vulnerable species in any given year are prioritised for assessment.
Status of fish stocks
The Fisheries Act 1996 requires fish stocks to be managed so their numbers stay at or above a target level (‘target biomass level’). Generally, the target level is set at the level that can produce the maximum sustainable yield; that is, the largest average annual catch that can be taken without damaging future stocks. The status of a fish stock is determined by how the stock compares with this target level.
Status classification
The status of New Zealand fish stocks are classified as:
- near or above target biomass levels: the stock is highly likely to have been sustainably fished
- probably near or above target biomass levels: the stock has probably been sustainably fished
- possibly near or above target biomass levels: the stock is more likely than not to have been sustainably fished
- below target biomass levels: the stock is likely to have been overfished, and recovery plans are in place
- unknown: there is not enough data to ascertain the status of the stock.
Seabed trawling in deep waters
The second indicator provides information on seabed trawling in deep waters. To report on this indicator, the following are measured:
- the area ‘swept’ (the area trawled over by a vessel towing gear along or near the seabed) by commercial trawlers, which are required to report their position by latitude and longitude
- the types of fish expected to be found in areas that have been swept.
This indicator shows only where there has been seabed trawling and the amount of trawl effort in those areas. It does not provide any information on the impact of the trawl on the sea floor environment.
Data collected from Trawl Catch Effort Processing Returns
Seabed trawling in deep waters is reported on using data collected from commercial forms called Trawl Catch Effort Processing Returns (TCEPRs) from 1990 to 2005. These returns are required from all commercial trawlers longer than 28 metres and some smaller vessels that are required to report their position.10
Most small vessels do not have to complete TCEPRs, so an estimated 3.5 million dredges and trawls are not reported over the same period. In some inshore areas, the effects of dredging and trawling by small vessels can be significant.
10 Fisheries (Reporting) Regulations 2001, Regulation 11(1).
Data reported for ‘fishing years’
Trawling effort is reported by ‘fishing year’, which runs from 1 October to 30 September of the next year. For ease of reference, a fishing year takes its name from the second of the two calendar years. For example, because most of the 1989–1990 fishing year is in 1990, it is referred to as the 1990 year.
Reporting on trawl effort
About 970,000 TCEPR trawls were reported in the 16 years from 1990 to 2005. These include bottom trawling and trawling using mid-water gear close to the seabed. The area swept for each trawl is estimated using the reported start and end positions of the trawl, and estimates of the ‘doorspread’ (effective width) of the trawl gear.
To report on trawl effort, the area inside the Exclusive Economic Zone (EEZ) is divided into a grid of 25-square-kilometre cells (National Institute of Water and Atmospheric Research, 2007). For each cell, the sum of the area swept (square kilometres) can be calculated. In a particular fishing year, a cell may have a total swept area of zero square kilometres (that is, it was untrawled) or, for example, 100 square kilometres, indicating that, on average, the area of the cell was trawled four times.
The trawl effort can then be analysed against the Demersal Fish Community Classification (see box ‘More about the Demersal Fish Community Classification’) to see what types of fish community are likely to have been most affected by seabed trawling in New Zealand.
More about the Demersal Fish Community Classification
The Demersal Fish Community Classification uses an extensive set of fisheries research trawl data to model the distribution of 122 fish species that live near the seabed (demersal fish species) (Leathwick et al, 2006b). These species include blue cod, hake, hoki, John dory, orange roughy, snapper, and tarakihi.
The classification shows the geographic distribution of particular demersal fish communities. It also shows the types of fish living in the communities and the environmental conditions in which the communities occur (Leathwick et al, 2006a).
Water quality at coastal swimming spots
The third indicator provides information on water quality at coastal swimming spots – referred to as ‘recreational water quality’. To report on this indicator, concentrations of enterococci bacteria at coastal swimming spots are measured.
Enterococci indicate the presence of faecal material in coastal waters. During summer months, concentrations of enterococci are measured, usually once a week, at monitored beaches, and the results are compared with national guidelines.
Recreational water quality can be affected by effluent run-off from farmland and human wastewater discharges. Seawater that has been contaminated with human or animal effluent can carry a variety of disease-causing organisms. These can pose health risks to people using coastal beaches for activities like swimming, sailing, and surfing. Very young children, the elderly, or people with impaired immune systems are particularly vulnerable.
Marine areas with legal protection
The fourth indicator provides information on marine areas with legal protection. To report on this indicator, the following are measured:
- the percentage of New Zealand’s territorial sea in marine reserves
- the percentage of each class of the Coastal Biogeographic Regions Classification protected by marine reserve.
Marine reserves
Marine reserves are fully protected areas established under the Marine Reserves Act 1971. Until a Marine Protected Area network is established (see box ‘Government action on protecting the marine environment’ later in this chapter), this indicator will report on marine reserves within the territorial sea. Wider marine protection mechanisms, including those in the EEZ, are not reported on using this indicator.
Department of Conservation records are used to report on the size and location of marine reserves in New Zealand’s territorial sea. By comparing this information with the Coastal Biogeographic Regions Classification (which divides New Zealand’s territorial sea into 13 regions), we can show the percentage of each class of coastal biogeographic region protected by a marine reserve.
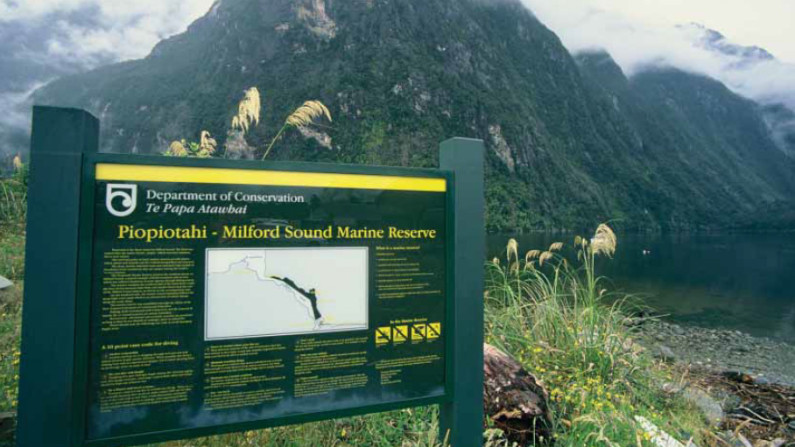
Image: Courtesy of the Department of Conservation.
Threatened marine species
Information on the state of New Zealand’s threatened marine species is included in this chapter to present a more rounded picture of our oceans.
This includes information about:
- marine species on New Zealand Threat Classification lists
- migratory marine mammals and seabirds on the International Union for the Conservation of Nature and Natural Resources (IUCN) Red List of Threatened Species.
New Zealand Threat Classification lists
The New Zealand Threat Classification lists classify all threatened and potentially threatened species that breed in New Zealand waters.
The classification uses information on population size, the range of the species, and population trends to determine the level of threat.
The classification system groups threatened species into the following three categories:
- acutely threatened: nationally critical, nationally endangered, or nationally vulnerable
- chronically threatened: in serious decline or gradual decline
- at risk: sparse or range-restricted.
International Union for the Conservation of Nature and Natural Resources Red List of Threatened Species
The IUCN Red List classifies threatened and potentially threatened species across the world. This chapter focuses on the species of marine mammals and seabirds on the IUCN Red List that migrate through New Zealand waters.
The IUCN Red List groups threatened species into the three categories of:
- critically endangered: considered to be facing an extremely high risk of extinction in the wild
- endangered: considered to be facing a very high risk of extinction in the wild
- vulnerable: considered to be facing a high risk of extinction in the wild.
Limitations of the indicators
The limitations of the indicators for oceans are explained below.
The two fisheries indicators do not measure:
- the environmental effects of fishing and trawling on marine ecosystems
- the effects from fishing activities on fish species that are not within the quota management system.
The recreational water quality indicator measures the water quality only at monitored beach sites, which may or may not be representative of recreational water quality elsewhere in New Zealand. In addition, beaches are often monitored only when there is a known problem with water quality.
The marine protection indicator does not measure how effective marine reserves are at protecting threatened marine species.
International agreements on the marine environment
New Zealand is a signatory to all key international agreements on managing the marine environment, including:
- the United Nations Convention on the Law of the Sea, which defines New Zealand’s marine jurisdictional zones and specifies the rights and responsibilities within these zones, including obligations to protect the environment
- the International Convention for the Prevention of Pollution from Ships, which aims to eliminate the intentional pollution of the marine environment by ships, including from oil and other harmful substances
- the London Dumping Convention and Protocol, which aims to prevent the pollution of the sea from the dumping of waste.
Other international conventions relate to the conservation of marine living resources and biodiversity, including migratory fish stocks, marine mammals, and seabirds.
Fisheries
Fishing is the most widespread human activity in the marine environment. Recreational, customary, and commercial fishing occur along a significant proportion of the New Zealand coastline and in several areas within our Exclusive Economic Zone (EEZ).
More than 1,300 commercial fishing vessels operate in New Zealand’s marine environment (Ministry of Fisheries, 2007c). The commercial fishing sector accounts for the most significant proportion of the annual fisheries catch, catching 525,000 tonnes of fish in the 2006 fishing year. This includes fish caught both inside and outside of the New Zealand quota management system, including hoki, squid, jack mackerel, southern blue whiting, barracouta, and orange roughy. These species make up 60 per cent of the total catch by weight.
One hundred and thirty species are commercially fished in New Zealand. Of these, 96 species, comprising 618 fish stocks, are managed under New Zealand’s quota management system (Ministry of Fisheries, 2007c). About 40 species have quota management system allowances for customary Māori fishers, and a similar number have allowances for recreational fishers (Ministry of Fisheries, 2007a).
While the quota management system ensures good information is collected about commercial fishing in New Zealand, recreational fishing catches are not formally reported. However, surveys are periodically conducted to estimate the quantity and type of species caught. For some fish stocks, the recreational take represents a large proportion of the total catch. For example, in the year ending 30 September 2005, the estimated recreational catch for blue cod in some management areas, such as the Marlborough Sounds, far exceeded the commercial landings (Ministry of Fisheries, cited in Statistics New Zealand, 2007a).
The quota management system also cannot track and report on unregulated and illegal fishing in New Zealand waters. Illegal fishing can limit the availability of fish for all fishers, particularly high-value species such as rock lobster and pāua.
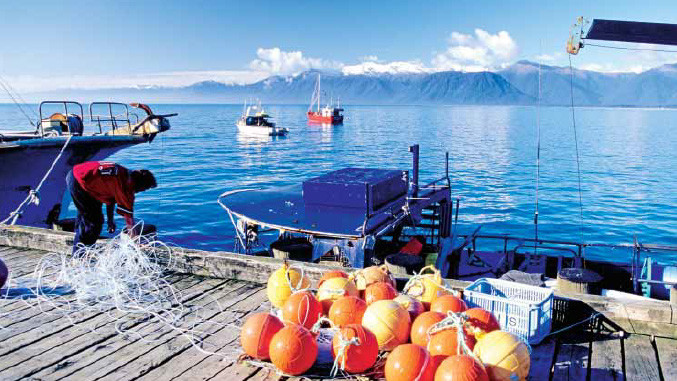
Image: Nature’s Pic Images.
Māori fisheries
Māori have a significant interest in New Zealand fisheries, controlling more than 35 per cent of the commercial fishing industry.
Māori also control the customary take of marine species provided for under the Fisheries (Kaimoana Customary Fishing) Regulations 1998 and Fisheries (South Island Customary Fishing) Regulations 1999.
Tangata kaitiaki or tiaki (customary-take guardians)
Iwi and hapū elect tangata kaitiaki or tiaki (customary-take guardians) for each area, whom the Minister of Fisheries then appoints formally.
Tangata kaitiaki may authorise any individual to take fisheries resources for customary use from within the rohe moana (coastal and marine area) for which the tangata kaitiaki have been appointed.
Iwi must report catches regularly to the Ministry of Fisheries so customary use can be factored in when annual catch limits are set.
Customary fisheries restrictions and closures
Provision for customary fisheries restrictions and closures is made under the Fisheries Act 1996 (Ministry of Fisheries, 2007a). This includes the use of rāhui, mātaitai reserves, and taiāpure.
Rāhui is a traditional marine management tool that temporarily closes an area. Tangata whenua may ask for mātaitai reserves (special management areas) and taiāpure (locally managed fishing areas) to cover some of their traditional fishing grounds or areas that have cultural and spiritual significance.
Within mātaitai reserves, tangata kaitiaki set the rules for customary and recreational fishing. Generally, commercial fishing is banned within mātaitai reserves. However, tangata kaitiaki may recommend that some types of commercial fishing be allowed (Taylor and Buckenham, 2003).
Taiāpure are local fisheries in coastal waters that recognise the special significance of the area to local iwi or hapū, either as a source of seafood or for spiritual or cultural reasons. Taiāpure give Māori greater say in the management of their traditionally important areas.
A major difference between mātaitai reserves and taiāpure is that commercial fishing is often allowed in taiāpure (Department of Conservation, 2007).
Local action to protect the marine environment
Central and local government are primarily responsible for decision-making, planning, and monitoring in the coastal marine area. However, local initiatives have become increasingly important for managing the coastal and marine environment.
In particular, a number of local initiatives for the better integration of management in the coastal marine area have been undertaken in recent years. These initiatives focus on the coastal margin and include marine management initiatives such as the Fiordland Marine Guardians and Kaikōura Coastal Marine Guardians (Te Korowai o Te Tai o Marokura).
The Fiordland Marine Guardians began as a local fisheries committee in Fiordland. It grew to include other commercial and recreational fishers, tourist and ecotour operators, dive clubs, and conservationists.
The Fiordland Marine Guardians developed a community-initiated resource management plan to protect and sustain the unique marine environment in Fiordland.
This plan included agreement that:
- commercial fishers would fish only in the open sea and outer fiords
- recreational fishers would limit their daily bag to three cod per person
- Ngāi Tahu would not fish under customary right.
This agreement was cemented through the Fiordland (Te Moana o Atawhenua) Marine Management Act 2005. The Act brought into being the Fiordland Marine Area, which extends from Awarua Point to Sand Hill Point, covering about 928,000 hectares. Within the marine area, the Act established eight new marine reserves of 9,520 hectares, in addition to the two pre-existing marine reserves.
Other important council and community initiatives include beach clean-ups, dune restoration programmes, wetlands and habitat restoration, and stormwater management initiatives.
Status of commercial fish stocks
In 2006, 65 per cent by weight of all commercial catches were from fish stocks where enough information was available to assess the stock status (99 fish stocks).11
The remaining 35 per cent comprised 519 stocks, the status of which could not be assessed because of insufficient information. For many of these fish stocks, there is presently no way to assess their status, as long-term data is needed for a meaningful assessment. Many of these stocks record catches of less than 10 tonnes each year, so they are not considered at risk of over-fishing.
Table 11.1 shows that of the 99 assessed fish stocks, 85 per cent (84 fish stocks) are near or above target biomass levels. This includes all stocks in the ‘near or above’, ‘probably near or above’, and ‘possibly near or above’ target level categories.
The remaining 15 per cent of assessed fish stocks are below target levels. Rebuilding strategies are in place for these fish stocks. They include, for example, orange roughy in the Puysegur area (which has been closed to fishing since 1997) and rig (a shark-like species) in areas where the allocated catch has been reduced.
11 The 65 percent excludes arrow squid, the annual catch limit for which is more than 100,000 tonnes. The unusual life cycle of the arrow squid prevents a meaningful stock assessment being made. However, current levels of fishing are expected to be sustainable (Ministry of Fisheries, pers comm).
Table 11.1: Status of assessed fish stocks under the quota management system relative to target levels, 2006
| Stock status | Number of assessed stocks | Percentage of assessed stocks (%) |
|---|---|---|
| Near or above target biomass levels | 51 | 52 |
| Probably near or above target biomass levels | 23 | 23 |
| Possibly near or above target biomass levels | 10 | 10 |
| Total fish stocks near or above target biomass levels | 84 | 85 |
| Below target biomass levels | 15 | 15 |
Data source: Adapted from Ministry of Fisheries, 2007b.
Seabed trawling
Trawling on or near the sea floor is the most widespread fishing activity in the New Zealand marine area that physically affects the seabed. From 1990, trawl effort by vessels required to report accurate fishing locations (TCEPR vessels) increased from fewer than 40,000 sweeps by trawls per year by about 127 vessels to a peak in 1998 of almost 80,000 sweeps per year by 173 vessels. In 2005, this number had dropped to nearly 55,000 sweeps per year by 94 vessels.
At the same time, the total area swept increased from 35,000 square kilometres in 1990 to a peak of more than 67,000 square kilometres in 1998. On average, the total area swept remained between 55,000 and 62,000 square kilometres in subsequent years until 2004 (see Figure 11.2). By 2005, the area swept had decreased to about 50,000 square kilometres, probably due to reductions in the total allowable catch for some species.
On average, around 55,000 square kilometres were trawled each year between 1990 and 2005.
Figure 11.2: Commercial trawling effort (total area swept in square kilometres) by trawl catch effort processing returns (TCEPR) vessels, 1990–2005

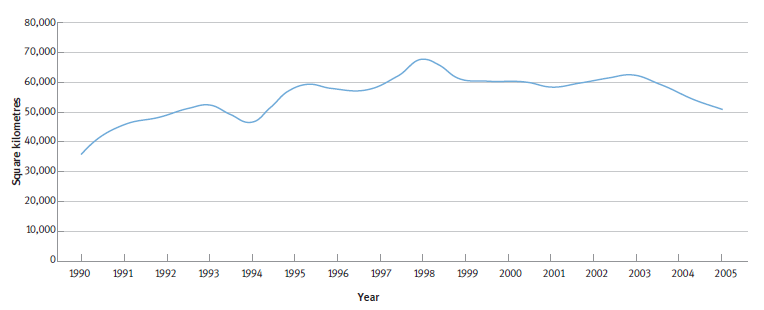
Figure 11.3 reports on where commercial trawling effort occurred in New Zealand by showing the total area swept (in square kilometres) in each 25-square-kilometre ‘cell’ fished. Sixty-four thousand of these cells are in fishable depths (less than 1,600 metres deep). Overall, 58 per cent of cells at fishable depths were crossed by at least one trawl over the 16 years for which there is data.
Trawling effort by year rose from 20 per cent of fi shable cells in 1990 to 30 per cent in 2002, and then decreased to 25 per cent in 2005. The data shows the majority of the fished cells have had less than 1 square kilometre swept by trawls over the 16 years.
Figure 11.3 shows that many areas in the EEZ are not targeted by trawling. Even if the area is of a fishable depth, catches may not be high enough to be economic.
Areas of higher trawling intensity are those where hoki, squid, orange roughy, scampi, or snapper are targeted.
The distribution of trawl effort changes from year to year, but the data does show a pattern of initial expansion of trawl effort to the east and south of New Zealand. This initial expansion is mainly due to trawl effort targeted at hoki, although this has contracted in recent years (as the hoki catch has decreased).
Demersal Fish Community Classification
Demersal fish live near the seabed. Figure 11.4 shows the 16 classes in the Demersal Fish Community Classification. Each class represents a different demersal fish community and is shown by a different colour in Figure 11.4. The darker shades show where the various classes (and their fish communities) have been affected by trawling.
Figure 11.3: Location of commercial trawling effort (total area swept in square kilometres within 25-square-kilometre cells) by trawl catch effort processing returns (TCEPR) vessels, 1990–2005
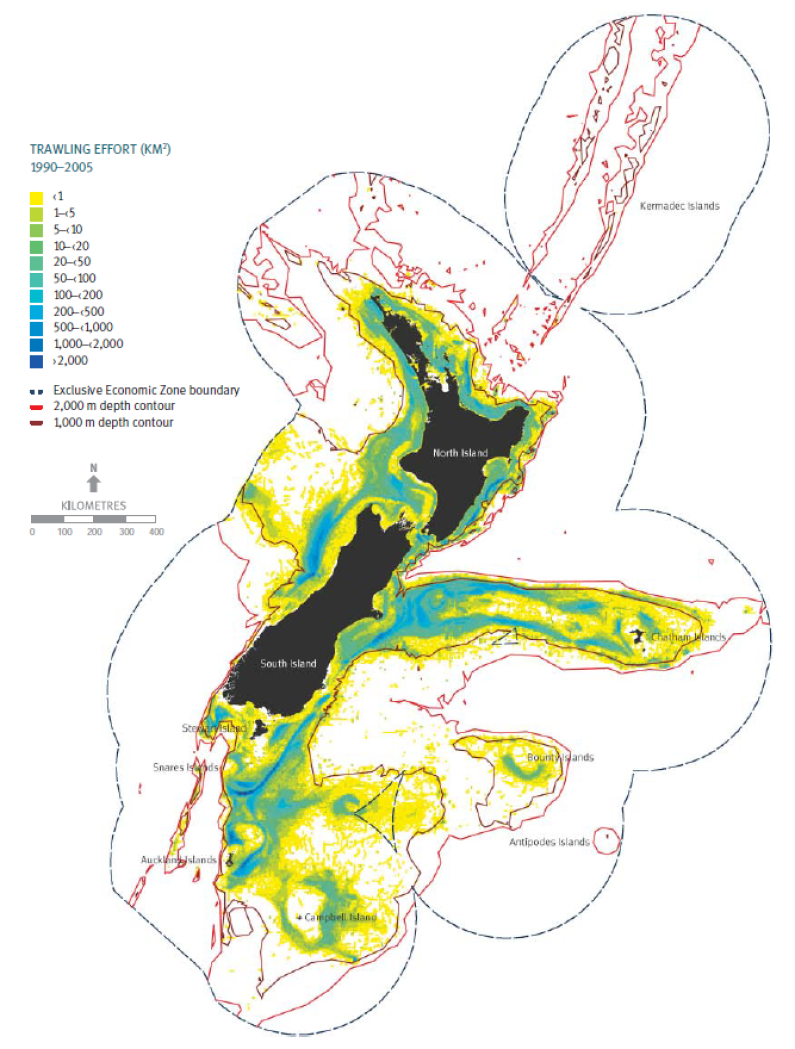

Figure 11.4: Area trawled (cumulative) by class in the Demersal Fish Community Classification, 1990–2005

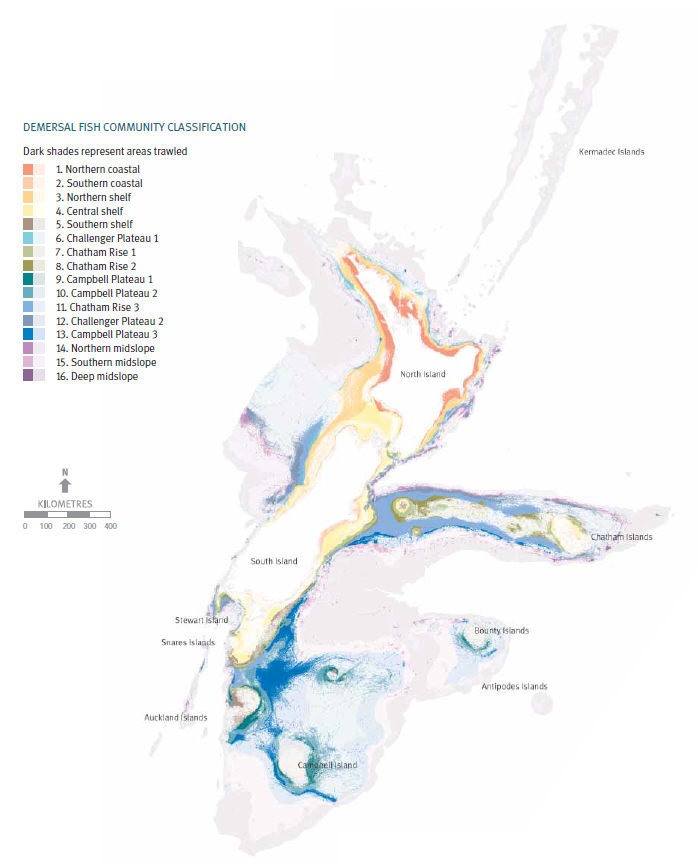
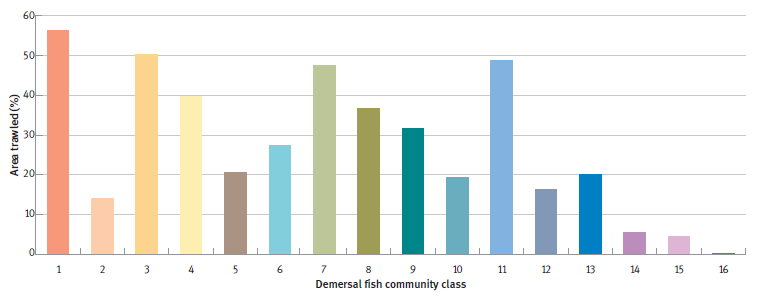
Figure 11.5 shows the percentage of cells within each class of the Demersal Fish Community Classification trawled at least once between 1990 and 2005. That some of these classes have a higher proportion of trawled cells than others may indicate that the associated demersal communities may also have been exposed to a greater extent of fishing.
Note that inshore classes are comparatively under-represented in Figure 11.5. This is because smaller vessels that do not use Trawl Catch Effort Processing Returns (TCEPRs) are more likely to fish inshore.
Demersal fish communities in the northern coastal, northern shelf, central shelf, Chatham Rise 1, and Chatham Rise 3 classes have had the highest proportion of their area (40–56 per cent of their cells) trawled by TCEPR vessels at some time in the 16-year period (see Figure 11.5). This does not necessarily reflect a higher level of trawling, as a trawled cell may have been trawled only once in the past 16 years.
Figure 11.5: Number of cells trawled at least once as a percentage of the number of cells in each class in the Demersal Fish Community Classification, 1990–2005

More about seabed fishing
Fishing effort on or near the seabed is known to affect the seabed environment (Cryer et al, 2002; Thrush et al, 1998). In Foveaux Strait, oyster dredging since 1863 has caused continuous reef modification and disturbance. This dredging has reduced oyster density (Cranfi eld et al, 1999). Dredging is known to remove epifauna (animals living on top of the seabed sediment) and damage reef systems. Analysis of oyster fisheries on three continents suggests that this pattern of impact is common in areas trawled (Kirby, 2004).
We still have large gaps in our understanding of the wider ecosystem effects of seabed fishing. Historically, most fisheries management and research has focused on individual species and stocks. While this remains important, efforts have increased in recent years to gain a better understanding of the long-term and ecosystem impacts of trawling and other seabed fisheries activities.
Water quality at coastal swimming spots
Monitoring swimming spots
Throughout the country, 380 beaches are monitored for recreational water quality. These are sites where water-based activities such as swimming, water-skiing, surfing, and diving are common.
Water samples are typically taken once a week over the summer (November to March) and tested for enterococci bacteria, which is the indicator of faecal pollutants in sea water. The 380 sites monitored include only those beaches where at least 10 water quality samples are taken over the summer; another 26 beaches are monitored, but less frequently.
When enterococci levels are higher than those recommended by the Microbiological Water Quality Guidelines for Marine and Freshwater Recreational Areas (Ministry for the Environment and Ministry of Health, 2003), councils liaise with health authorities to ensure the public is warned (by signs or other means) that there is an unacceptable health risk if they enter the water.
Image: Ministry for the Environment.
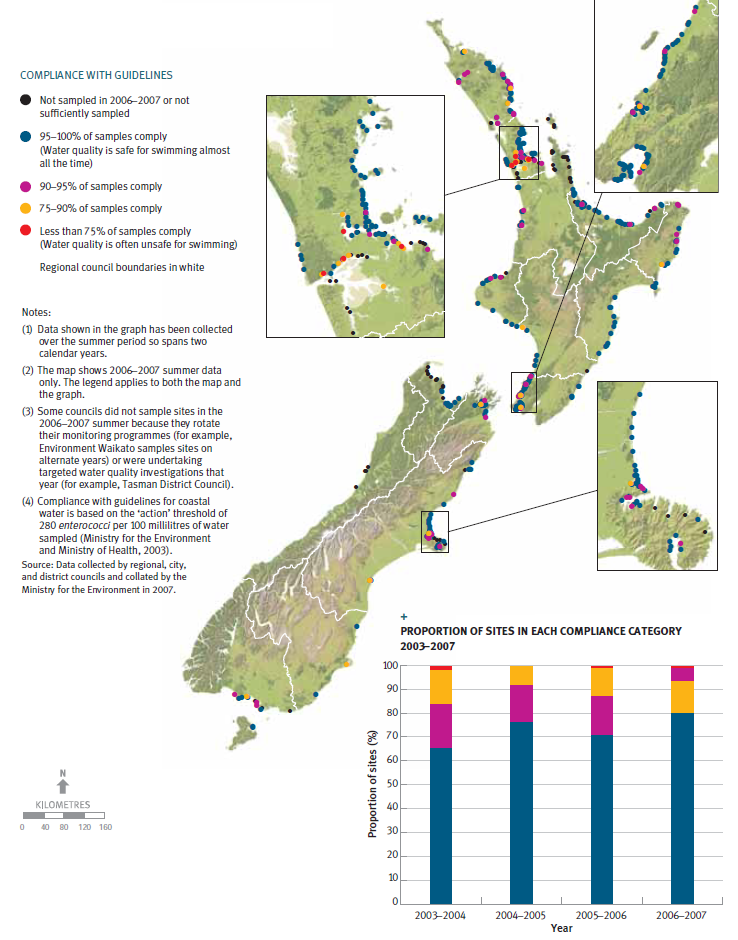
Figure 11.6 shows that over the 2006–2007 summer, water quality at 80 per cent of the 380 monitored beaches met the New Zealand guidelines for contact recreation almost all the time (at least 95 per cent of samples taken at these sites had safe enterococci concentrations). One per cent of sites breached guidelines regularly (more than 25 per cent of samples were non-compliant), indicating these beaches are often unsafe for swimming.
Figure 11.6 shows that more beaches met the guidelines in the 2006–2007 summer season than in previous summer seasons for which we have national data (2003–2004 and 2005–2006). While this is encouraging, the period for which we have data is not long enough to show whether the improvements in recreational water quality are a trend, or merely annual variations.
Several factors may cause variations in recreational water quality. For example, during a wet summer, more faecal matter is carried from the land into rivers and streams and out to the coast. Therefore, bacteria levels in coastal waters during wet summers are often high compared with levels in dry summers. Windy or stormy conditions can also lead to elevated bacteria levels, because increased wave action lifts sediment from the seabed, which may release faecal matter.
Coastal beaches generally have lower background levels of bacteria and/or shorter lasting bacterial contamination events than river and lake swimming spots. This difference is largely due to pollutants being more rapidly diluted and dispersed by currents and the large volumes of water at the coast.
Figure 11.6: Compliance of monitored coastal swimming spots with guidelines for contact recreation, 2003–2007

More about marine pollution
Marine pollution, from various sources, has the potential to affect marine biodiversity and habitats. Pollution includes marine debris, litter from land, run-off from land into coastal ecosystems, and oil spills.
Most oil spills occur in ports and harbours as a result of the high volume of shipping traffic. The spill rate for ports is about three times higher than the spill rate for all other coastal areas. Although oil spills from ships must be reported by law, most marine oil spills are from unknown sources and the volume of oil cannot be measured.
Figure 11.7 shows a decrease in the number of reported spills since 1999, possibly due to improving practices in the fishing and shipping industries. It is notable that in spite of a significant increase in shipping and tourism activities in recent years, there has been no large-scale marine spill in New Zealand since 2002.
It is possible that some spills continue to go undetected or are unreported.
Figure 11.7: Total number of reported marine spills, 1999–2006
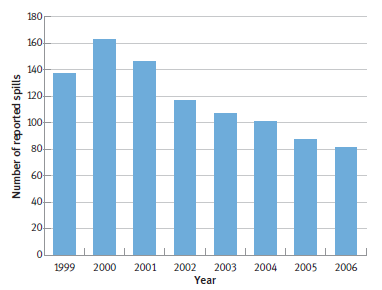
Source: Maritime New Zealand, 2007.
Threatened marine species
Several of New Zealand’s marine species are on the New Zealand Threat Classification lists (Hitchmough et al, 2007). In addition, several migratory marine mammals and seabirds that pass through New Zealand waters are on the IUCN Red List (International Union for the Conservation of Nature and Natural Resources, 2007).
Table 11.2 shows the number of species that breed in New Zealand waters that have a threat ranking in the New Zealand Threat Classification System (Hitchmough et al, 2007; Molloy et al, 2002).
Table 11.2 shows the high proportion (62.3 per cent) of seabirds (excluding waders and shorebirds) that are threatened. Sixteen of the 22 acutely threatened species or subspecies and eight of the 14 chronically threatened species or subspecies are endemic to New Zealand.
Table 11.2 also highlights that, of the threatened species, certain marine fish groups such as sharks, skates, dogfish, and rays are particularly vulnerable to fishing pressures. This vulnerability results from their long lives and low reproductive rates. The great white shark and basking shark are the only marine fish in the chronically threatened category (Hitchmough et al, 2007). Sharks, skates, and dogfish are also a significant proportion of the species in the at risk category. Both the North and South Island subspecies of Hector’s dolphin are acutely threatened.12
12 The North Island subspecies is also known as Maui’s dolphin.
Table 11.2: Number of marine species and subspecies in the New Zealand threat classification system, 2005
| Group | Acutely threatened | Chronically threatened | At risk | Total number of known species in threat catergories | Total number if known species1 | Percentage of total number of known species in threat categories (%) |
|---|---|---|---|---|---|---|
| Marine fish (sharks, bony fish) | 0 | 2 | 50 | 52 | 1,2462 | 4.2 |
| Marine invertebrates (crabs, corals, starfish, shellfish, limpets, octopus, and squid) | 13 | 19 | 238 | 270 | 11,255 | 2.4 |
| Marine mammals (seals, sea lions, dolphins, and whales) | 6 | 0 | 2 | 8 | 48 | 16.7 |
| Macroalgae (seaweeds and algae) | 1 | 0 | 37 | 38 | 847 | 4.5 |
| Seabirds (excluding waders and shorebirds) | 22 | 14 | 40 | 76 | 122 | 62.3 |
Data source: Adapted from Hitchmough et al, 2007.
Notes:
1 Information from D Gordon, National Institute of Water and Atmospheric Research, pers comm, number of known marine invertebrates, mammals, and macro-algae in New Zealand.
2 Information from A L Stewart, Te Papa Tongarewa, pers comm, number of known marine fish in New Zealand (inclusive of estuarine species).
Changes in threat classification
The New Zealand Threat Classification lists are updated every three years. In 2005, several hundred species were added to the lists. For marine species, the total number of species in the acutely threatened, chronically threatened, or at risk categories has increased by one for marine fish, one for marine mammal, two for macroalgae, and 26 for marine invertebrates.
In general, this increase is likely to reflect better information and a growing understanding of the threat status of species in the New Zealand marine environment, rather than a real change in threat status. However, there are some genuine declines and recoveries.
Two species of seabird, the Campbell mollymawk and black petrel, have shown enough recovery to have their threat classification lowered. However, the threat status of seven species of seabird has worsened since 2004 (Hitchmough et al, 2007).
Table 11.3 shows the species of migratory marine mammals and seabirds in New Zealand waters that are on the IUCN Red List.
The New Zealand species on the IUCN Red List are the sei, blue, and fin whales (classified as endangered); and the humpback and sperm whales, snowy albatross, and southern giant petrel (classified as vulnerable).
Table 11.3: Migrant seabirds and marine mammals in critically endangered, endangered, and vulnerable IUCN red list categories, 2005
| | Critically endangered | Endangered | Vulnerable | Total number of species in threat categories |
|---|---|---|---|---|
| Seabirds | 0 | 0 | 2 | 2 |
| Marine animals | 0 | 3 | 2 | 5 |
Data source: Adapted from International Union for the Conservation of Nature and Natural Resources, 2007.
Causes of population loss within species
Fishing bycatch (the accidental capture of non-target species during fishing activities) is a significant cause of the decreasing numbers of many seabird species worldwide. In New Zealand, bycatch is a serious threat to New Zealand-breeding albatrosses and some petrels (Wilson, 2006).
Commercial and recreational set-net fishing also pose an unquantified threat to Hector’s dolphins and some penguins, shearwaters, and shags.
Recent initiatives to minimise the harm from bycatch include a national action plan to reduce seabird mortality and regulatory measures to address dolphin mortality.
Pest species and loss of habitat also present significant risks to breeding and nesting sites for many of our rare marine species.
Loss of genetic diversity is another risk faced by some species. Genetic diversity is an important factor in a species’ resilience. A significant reduction in population, from human or natural pressures, may affect a species’ ability to adapt to further environmental changes, especially large-scale variations such as climate change.
Marine areas with legal protection
Marine reserves
Around the world, marine reserves are widely considered to be useful for achieving marine conservation goals, including:
- conserving habitats
- maintaining marine communities
- fostering the recovery of some species.
Marine reserves cover slightly more than 7 per cent of New Zealand’s territorial sea. Ninety-nine per cent of this area is in two remote offshore marine reserves – the Kermadec Islands Marine Reserve and Auckland Islands Marine Reserve.
New Zealand’s first marine reserve (Cape Rodney–Okakari Point Marine Reserve) was established in 1975. There are now 31 gazetted marine reserves in New Zealand’s territorial sea, 15 of which have been established since 2000. The area designated as marine reserve has also increased significantly in the last decade, from 7,602 square kilometres in 1997 to 12,764 square kilometres in 2007.
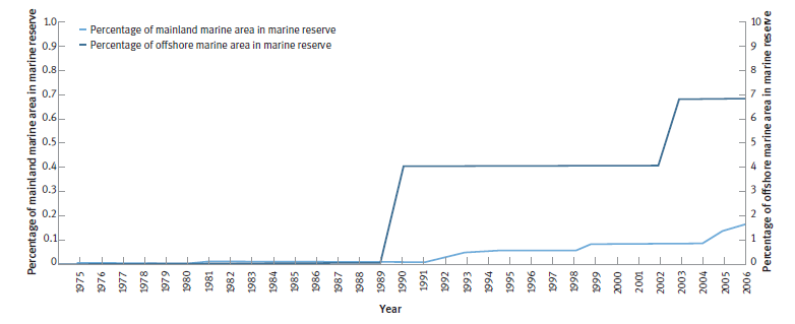
Figure 11.8 shows the increase of marine reserve area in the territorial sea since 1974. There have been two large increases of marine reserve area, which can be attributed to the establishment of marine reserves in the two remote offshore island groups mentioned above. In 1990, 7,280 square kilometres were protected around the Kermadec Islands, and in 2003, 4,980 square kilometres were protected around the Auckland Islands. These two reserves make up 99 per cent of the total area protected by marine reserve.
Less than 1 per cent of marine reserve area lies around the three main islands of New Zealand (the North, South, and Stewart Islands).
Figure 11.8: Percentage of territorial sea in marine reserves, 1975–2006

Marine reserve recovery
Monitoring of marine reserves in New Zealand has provided us with useful insights into the effectiveness of protection and the changes that have occurred in New Zealand waters. It has also helped us understand how species targeted by fishing respond to protection.
Research has been carried out in three of New Zealand’s oldest and most-studied reserves situated in the northeast of New Zealand (Cape Rodney–Okakari Point Marine Reserve, Cathedral Cove–Te Whanganui a Hei Marine Reserve, and the ‘no-take’ Tāwharanui Marine Park). Results of this research show the recovery of previously overfished populations and the re-establishment of natural ecosystems (Langlois and Ballantine, 2005; Langlois et al, 2006).
Coastal Biogeographic Regions Classification
The Coastal Biogeographic Regions Classification divides New Zealand’s territorial sea into 13 regions. Figure 11.9 shows the location of these regions and compares them with marine reserves around New Zealand.
Of the 13 regions, nine have at least one marine reserve. However, only two have a significantly large area protected in a marine reserve: the Kermadec Islands and the Subantarctic Island regions. With 100 per cent and 41.9 per cent of their respective territorial sea ecosystems protected, these two regions are recognised internationally as unique ecosystems.
Figure 11.9: Marine reserves in the territorial sea by coastal biogeographic regions classification

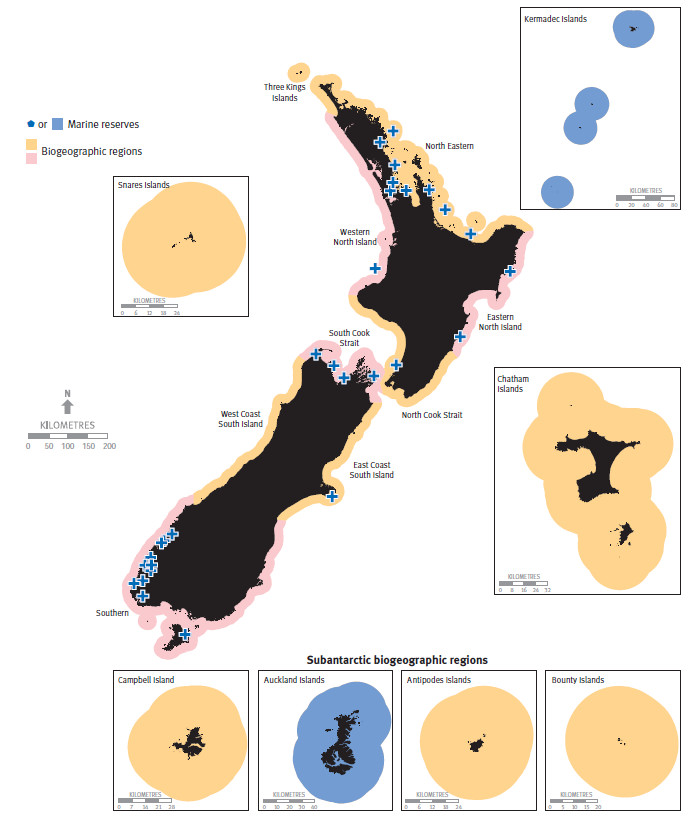
Figure 11.10 shows the proportion of mainland coastal biogeographic regions in designated marine reserves (none has more than 0.4 per cent). Four regions (Three Kings Islands, West Coast South Island, Snares Islands, and Chatham Islands) do not contain any marine reserves.
Figure 11.10: Percentage of mainland coastal biogeographic regions classification regions in marine reserves, 2007
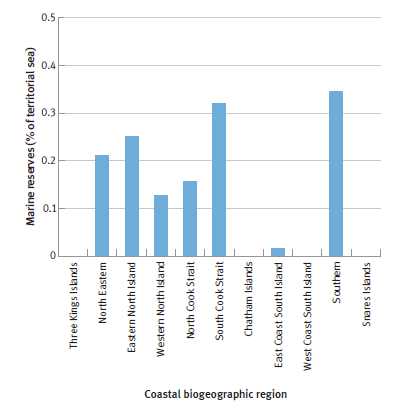
Data source: Department of Conservation.
Government action on protecting the marine environment
A number of cross-government initiatives aim to protect the New Zealand marine environment.
Oceans Policy
The Oceans Policy emphasises taking a coordinated and integrated approach to marine management. The Government has prioritised improving the regulation of environmental impacts in the Exclusive Economic Zone. In August 2007, the document, Improving the Regulation of Environmental Effects in New Zealand’s Exclusive Economic Zone, was released for public consultation.
Marine Protected Areas Policy and Implementation Plan
The Marine Protected Areas Policy and Implementation Plan aims to expand the network of Marine Protected Areas, so it covers a fully representative range of New Zealand’s coastal and marine ecosystems and habitats (Department of Conservation and Ministry of Fisheries, 2005). A key objective is to have at least one example of each identified marine habitat and ecosystem in the marine reserves.
A wide range of tools may contribute to a network of Marine Protected Areas (for example, marine reserves, special legislation, marine sanctuaries, and fisheries closures). Whether an area becomes part of the network will depend on how effectively the biodiversity values in the area are already protected.
Strategy for Managing the Environmental Effects of Fishing
The Strategy for Managing the Environmental Effects of Fishing sets out approaches to regulate the effects of fisheries to help achieve the sustainable use of fish stocks and ecological sustainability (Ministry of Fisheries, 2005), as defined under the Fisheries Act 1996.
Biosecurity Strategy
The Biosecurity Strategy sets out an overall direction for monitoring and managing biosecurity in New Zealand (Biosecurity Council, 2003).
New Zealand Marine Oil Spill Response Strategy
The New Zealand Marine Oil Spill Response Strategy aims to minimise the impact of oil pollution on the marine environment within New Zealand’s area of responsibility (Maritime New Zealand, 2006).
New Zealand Biodiversity Strategy
New Zealand’s Biodiversity Strategy sets out a vision for coastal and marine biodiversity protection. The strategy lists four desired outcomes for the marine environment by 2020.
- New Zealand’s natural marine habitats and ecosystems are maintained in a healthy, functioning state. Degraded marine habitats are recovering. A full range of marine habitats and ecosystems representative of New Zealand’s indigenous biodiversity is protected.
- No human-induced extinctions of marine species occur within New Zealand’s marine environment. Rare or threatened marine species are adequately protected from harvesting and other human threats, enabling them to recover.
- Marine biodiversity is appreciated, and harvesting or marine development is done in an informed, controlled, and ecologically sustainable manner.
- No new undesirable introduced species is established, and threats to indigenous biodiversity from established exotic organisms are being reduced and controlled.
The strategy includes the goal of having 10 per cent of the marine environment in a network of Marine Protected Areas by 2010 (Department of Conservation and Ministry for the Environment, 2000).
The 1997 report, The State of New Zealand’s Environment 1997, concluded that:
New Zealand’s environmental information needs considerable upgrading if the state of the nation’s environment is to be accurately described and trends detected. …
The main pressures on indigenous biodiversity today are insufficient habitat in lowland areas, declining quality of many of the remaining land and freshwater habitats, the impacts of pests and weeds and, for some marine species and ecosystems, human fishing activities. …
The main responses to biodiversity decline have focused on ecosystem and species recovery programmes on offshore islands and extensive pest control operations on the mainland, but the need for partial restoration of the representative indigenous lowland and coastal ecosystems and for wider protection of marine ecosystems has yet to be addressed. …
The status of more than half the commercially exploited fish stocks is unknown but, of the stocks whose status is known, about 10 percent are considered to be below the level of Maximum Sustainable Yield and measures have been set to rebuild these stocks. …
Pressures on marine life from fishing include direct harvesting pressure as well as indirect pressures from trawling and dumping of offal on nursery ecosystems (e.g. coral communities, seamounts, bryozoan mats), and bycatch of non-target species (e.g. 1,000 marine mammals, several hundred seabirds, and many nontarget fish per year). …
The new Fisheries Act 1996 recognises that environmental sustainability requires more than just sustaining the yield from target stocks but also requires the maintenance of marine biodiversity and ecosystems. …
Protected marine areas can act as both reservoirs of biodiversity and nurseries for some commercial fisheries yet, apart from the Kermadec and Auckland Islands, protected marine areas are under-represented in both our coastal and our deep water ecosystems, e.g. seamounts.
Ministry for the Environment, 1997, chapter 10.
Progress since 1997
Since 1997, considerable effort has been made to strengthen marine information systems and put in place more extensive monitoring to improve the management of New Zealand’s marine area. Government strategies, research funding, and management policies have collectively focused on improving our understanding of the marine environment, its ecosystems, and its biodiversity.
Limited knowledge of long-term impacts
In recent years, marine research in New Zealand has increased its emphasis on improving its understanding of the:
- wider ecosystem effects of human activities on our marine area
- distribution and structure of our marine ecosystems
- interdependence between marine species and ecosystems.
Despite this shift, our knowledge of the long-term ecosystem impacts of human activities in the New Zealand marine environment remains somewhat limited. Bringing together land, freshwater, and marine research will be particularly important in studying the resilience of our inshore ecosystems to land-based pressures.
More about Māori indicators for marine protection
In 2004, Ngāti Konohi, the Department of Conservation, and the Ministry for the Environment worked together to establish a framework for marine protection for the rohe moana (coastal area) of Ngāti Konohi of Whangarā. The rohe extends from Waihau Bay in the north to Tatapouri Heads in the south, and includes Te Tapuwae o Rongokako Marine Reserve, established in 1999.
Identifying the indicators (tohu)
The project aimed to:
- define a process to identify Māori marine indicators (tohu) that would measure the health of the rohe moana
- pilot the implementation of tohu
- test how marine reserves contribute to iwi conservation objectives.
The project involved members of Ngāti Konohi who regularly used the rohe moana to gather kaimoana (seafood). The project identified traditionally important locations and species and collected information on traditional catch techniques and customs relating to management of kaimoana. Using this information, tohu were developed by Ngāti Konohi to monitor changes in the health of their rohe moana and address problems using customary management practices.
Primary and secondary tohu
Ngāti Konohi established primary and secondary tohu.
Primary tohu were divided into species-focused and process-focused tohu. Species-focused tohu monitor the availability, accessibility, abundance, and quality of species of traditional importance. For example, tohu indicate whether kaimoana can be readily harvested to provide for customary needs.
Process-focused tohu monitor the condition and presence of processes that indicate a healthy marine environment. For example, seasonal observations of ‘bait fish’ feeding or predators (such as marine mammals or sea birds) were categorised as process-focused tohu.
Secondary tohu included:
- a series of plots established at various locations in the rohe moana to quantify the size and location of key indicator species
- data on water quality, shellfish health, and beach bathing standards from marine environmental monitoring undertaken by Gisborne District Council
- a series of land-based tohu, which were defined to aid management of the rohe. These include the flowering seasons of the kōwhai, pōhutakawa, and tī kouka (cabbage tree) as indicators of ripeness of kina for harvesting.
The identification of marine environmental tohu has proven to be a catalyst for heightened interest in and awareness of marine protection in the area.
New tools to improve understanding
Since 1997, new marine databases and national coordination tools such as the National Aquatic Biodiversity Information System have become important aids to understanding our marine environments and their associated biodiversity.
New ecological classification systems have also helped us to better understand our marine environment.
These classification systems include:
- the Marine Environment Classification
- the Marine Environment Classification optimised for demersal fish
- the Demersal Fish Community Classification
- the Coastal Biogeographic Regions Classification.
Marine monitoring programmes that have been implemented since 1997 include:
- the non-indigenous marine species monitoring programme
- regional monitoring of the quality of beach bathing water
- regional monitoring of wastewater and stormwater discharges into the coastal marine area
- estuarine and coastal monitoring of sedimentation, nutrients, and other pollutants
- monitoring of Māori marine indicators (see box ‘More about Māori indicators for marine protection’)
- the Ocean Survey 20/20 mapping initiative.
In addition, research funding was allocated in 2007 to gather more detailed information on commercial fish catches in coastal waters. The aim of this funding is to ensure that inshore fisheries are managed sustainably. The research aims to increase our understanding of interactions between target fish stocks, bycatch species, and fishing effects on the wider inshore environment, with a view to improved planning and management of inshore fisheries. The research is also expected to inform coastal planning decisions on marine protection and aquaculture development.
Biosecurity
The protection of New Zealand’s marine environment will continue to require a focus on biosecurity. Increased marine-based trade and travel as well as climate change are expected to add to the existing pressures of pests, diseases, and pathogens. Controlling these threats is important for protecting our fisheries and Marine Protected Areas as well as for preserving wider coastal amenity values (Ministry of Research, Science and Technology, 2007).
State of our fisheries
The Fisheries Act 1996 has been in place for more than a decade. Of the 99 fish stocks for which sufficient information is available to assess stock status, 85 per cent have been fished sustainably and 15 per cent have been overfished and are now being rebuilt.
It is difficult, however, to compare the 15 per cent of stocks overfished in 2007 with the 10 per cent of stocks overfished in 1997. The number of species in the quota management system has increased from 42 species in 1997 to 96 species in 2007, and the number of assessed fish stocks has increased from 74 to 99 over the same period. Furthermore, methodologies for assessing stocks have improved. Even so, it is clear that pressures on our fisheries stocks remain and our fish stocks will continue to need careful management into the future.
The pressures identified for our fisheries in the 1997 report remain important environmental issues in fisheries management today: bycatch, habitat destruction, and indirect and wider ecosystem impacts.
Initiatives to address these issues include:
- the Strategy for Managing the Environmental Effects of Fishing
- the National Plan of Action to Reduce the Incidental Catch of Sea Birds in New Zealand Fisheries
- industry-initiated benthic protection areas.
See box ‘Government action on protecting the marine environment’ for more information on government initiatives to protect the marine environment.
However, more monitoring and research into the effects of fisheries, including seabed trawling, on the wider ecosystem is warranted, because we have significant gaps in our understanding of the impacts of human activity on the marine environment.
Marine protection
Since the 1997 report, monitoring and research have conclusively demonstrated the positive effect of marine protection on both the size and abundance of marine life and the recovery of ecosystems under pressure.
In 1997, almost 7,602 square kilometres of New Zealand waters were protected in marine reserves. This area has increased by about 5,162 square kilometres in the last decade. Thirty-one marine reserves now comprise 7 per cent of our territorial sea, a high proportion by Organisation for Economic Co-operation and Development standards. Nearly half of these have been established since 2000, and the area designated as marine reserves has nearly doubled in this time. However, 99 per cent of our protected area is in two offshore marine reserves, and some key habitats remain unprotected.
Progress on classifying the marine environment and developing and implementing a 10 per cent Marine Protected Area network throughout the Exclusive Economic Zone (EEZ) (targeted for 2010) has been slow. However, the Marine Protected Areas Policy and Implementation Plan is expected to increase momentum to expand the network to fully represent the range of New Zealand’s coastal and marine ecosystems and habitats (see box ‘Government action on protecting the marine environment’).
Other initiatives to protect important marine habitats from disturbance include:
- proposed benthic protection areas (which will close 30 per cent of the EEZ to seabed trawling)
- seamount closures (which will close 100,000 square kilometres to seabed trawling).
In addition, customary closures and restrictions are an integral part of fisheries management.
Recent years have also seen the emergence of innovative local initiatives for coastal management, such as the coastal management plan proposed by the Fiordland Guardians and supported by the Government.
Looking ahead
New Zealand’s marine environment will continue to face pressures from fishing activities. In the light of improved information over time about fish stocks and the broader effects of fishing on marine ecosystems, the challenges will be to ensure fisheries are utilised in a sustainable way and to allow the recovery of stocks that have been overfished in the past.
Land-based pressures on the inshore marine environment will continue to challenge the health of our marine environment. Discharges of pollution, stormwater, nutrients, and sediments to the sea from land development appear unlikely to ease, given our increasing population and shift towards more intensive land use.
Balancing the competing needs of the users of our marine area will continue to be important and may become increasingly difficult as our population increases and technology advances. The need for accurate information to help set priorities for future use and protection of our marine area will increase.
In the future, greater attention is likely to turn to the significant changes to our oceans and coasts that climate change is expected to bring, and how New Zealand will respond.
Associate Minister of Energy. 2007. Great South Basin Oil and Gas Quest Set to Begin. Retrieved from https://www.beehive.govt.nz/release/great-south-basin-oil-and-gas-quest-set-begin (6 August 2007).
Auckland Regional Council. 2004. Contaminant Monitoring in Shellfish: Results of the 2002 Shellfish Contaminant Monitoring Programme (PDF, 1.1MB). Auckland: Auckland Regional Council.
Biosecurity Council. 2003. Tiakina Aotearoa – Protect New Zealand: The Biosecurity Strategy for New Zealand (PDF, 1.7MB). Wellington: Biosecurity Council.
Biosecurity New Zealand. 2006. Organism Impact Assessment: Styela clava. Retrieved from http://www.biosecurity.govt.nz/seasquirt (1 August 2007).
Biosecurity New Zealand. 2007. Summary of Biosecurity New Zealand surveys of 16 high risk ports and marinas, unpublished, prepared for the Ministry for the Environment. Wellington: Ministry for the Environment.
Cranfield, H J, Michael, K P, and Doonan, I J. 1999. Changes in the distribution of epifaunal reefs and oysters during 130 years of dredging for oysters in Foveaux Strait, Southern New Zealand. Aquatic Conservation: Marine and Freshwater Ecosystems vol 9, pp 461–483.
Cryer, M, Hartill, B, and O’Shea, S. 2002. Modification of marine benthos by trawling: Toward a generalisation for the deep ocean? Ecological Applications vol 12, pp 1824–1839.
Department of Conservation. 2007. Marine Protected Areas: Taiapure. Retrieved from http://www.doc.govt.nz/templates/page.aspx?id=33950 (9 July 2007).
Department of Conservation and Ministry for the Environment. 2000. The New Zealand Biodiversity Strategy: Our chance to turn the tide – Whakakōhukihukitia te tai roroku te tai oranga (PDF, 3MB). Wellington: Department of Conservation and Ministry for the Environment.
Department of Conservation and Ministry of Fisheries. 2005. Marine Protected Areas: Policy and Implementation Plan (PDF, 809KB). Wellington: Department of Conservation and Ministry of Fisheries.
Dodgshun, T J, Taylor, M D, and Forrest, B M. 2007. Human-Mediated Pathways of Spread for Non-Indigenous Marine Species in New Zealand (PDF, 491KB). Wellington: Department of Conservation.
Evans, J. 2007. Sea surface temperature at Leigh Marine Lab, unpublished, prepared for the Ministry for the Environment. Wellington: Ministry for the Environment.
Gordon, D P (ed). 2007. In The New Zealand Inventory of Biodiversity. Volume 1. Kingdom Animalia: radiata, lophotrochazoa, and deuterostomia. Christchurch: Canterbury University Press.
Hannah, J. 2004. An updated analysis of long-term sea level change in New Zealand. Geophysical Research Letters vol 31, pp 1–4.
Hays G C, Richardson, A J, and Robinson, C. 2005. Climate change and marine plankton. Trends in Ecology and Evolution vol 20, pp 337–344.
Hitchmough, R, Bull L, and Cromarty, P (compilers). 2007. New Zealand Threat Classification System Lists, 2005 (PDF, 472KB).
Intergovernmental Panel on Climate Change. 2007. Climate Change 2007: The physical science basis. Contribution of Working Group I to the Fourth Assessment Report of the Intergovernmental Panel on Climate Change (PDF, 29.1MB). Solomon, S, Qin, D, Manning, M, Chen, Z, Marquis, M, Averyt, K, Tignor, M B, and Miller, H L (eds). Cambridge, United Kingdom and New York, United States: Cambridge University Press.
International Union for the Conservation of Nature and Natural Resources. 2007. The IUCN Red List of Threatened Species.
Kirby, M X. 2004. Fishing down the coast: Historical expansion and collapse of oyster fisheries along continental margins. Proceedings of the National Academy of Sciences of the United States of America vol 101, pp 13096–13099.
Langlois, T J, Anderson, M J, Babcock, R C, and Kato, S. 2006. Marine reserves demonstrate trophic interactions across habitats. Oecologia vol 147, pp 134–140.
Langlois, T J, and Ballantine, W J. 2005. Marine ecological research in New Zealand: Developing predictive models through the study of no-take marine reserves. Conservation Biology vol 19, no 6, pp 1763–1770.
Leathwick, J, Dey, K, and Julian, K. 2006a. Development of a Marine Environment Classification Optimised for Demersal Fish, prepared for the Department of Conservation (PDF, 353KB). Hamilton: National Institute of Atmospheric and Water Research.
Leathwick, J, Francis, M, and Julian, K. 2006b. Development of a Demersal Fish Community Classification for New Zealand’s Exclusive Economic Zone, prepared for the Department of Conservation (PDF, 494KB).
MacDiarmid, A (ed). 2006. An assessment of biodiversity in the New Zealand marine ecoregion, unpublished, prepared for the World Wildlife Fund for Nature – New Zealand. Wellington: World Wildlife Fund for Nature.
MacDiarmid, A (compiler). 2007. The Treasures of the Sea: A summary of biodiversity in New Zealand’s ecoregion, prepared for the World Wildlife Fund for Nature – New Zealand. Wellington: World Wildlife Fund for Nature.
Maritime New Zealand. 2006. New Zealand Marine Oil Spill Response Strategy. Wellington: Maritime New Zealand.
Maritime New Zealand. 2007. Marine Spills Spreadsheet 1998–2006. Wellington: Maritime New Zealand.
McDowall, R M. 1990. New Zealand Freshwater Fishes: A Natural History and Guide, revised edition. Auckland: Heinemann Reed.
Ministry of Economic Development. 2007. Neptune to Begin Offshore Kermadec Minerals Exploration. Retrieved from http://www.crownminerals.govt.nz/cms/news/2007/news_item.2007-05-09.1858822155 (6 August 2007).
Ministry for the Environment. 1997. The State of New Zealand’s Environment 1997 (PDF, 9.6MB). Wellington: Ministry for the Environment and GP Publications.
Ministry for the Environment. 2005. Offshore Options: Managing Environmental Effects in New Zealand’s Exclusive Economic Zone (PDF, 349KB).
Ministry for the Environment. 2006. Gentle Footprints: Boots ‘n’ All. Wellington: Ministry for the Environment.
Ministry for the Environment and Ministry of Health. 2003. Microbiological Water Quality Guidelines for Marine and Freshwater Recreational Areas (PDF, 2.8MB). Wellington: Ministry for the Environment and Ministry of Health.
Ministry of Fisheries. 2005. Strategy for Managing the Environmental Effects of Fishing (PDF, 173KB). Wellington: Ministry of Fisheries.
Ministry of Fisheries. 2007a. Maori Customary Fisheries. Retrieved from http://www.fish.govt.nz/en-nz/Maori/default.htm (28 March 2007).
Ministry of Fisheries. 2007b. Ministry of Fisheries Monthly Harvest Returns 2005/06. Wellington: Ministry of Fisheries.
Ministry of Fisheries. 2007c. Statement of Intent, 2007–2012. Retrieved from http://www.fish.govt.nz/en-nz/Publications/Statements+of+Intent/SOI+2007-2012/default.htm?WBCMODE=PresentationUnpublished (2 August 2007).
Ministry of Research, Science and Technology. 2007. Roadmap for Science: Environmental Research. Wellington: Ministry of Research, Science and Technology.
Molloy, J, Bell, B, Clout, M, de Lange, P, Gibbs, G, et al. 2002. Classifying Species According to Threat of Extinction: A System for New Zealand (PDF, 575KB). Wellington: Department of Conservation.
National Institute of Water and Atmospheric Research. 2007. Benthic trawl data, unpublished. Wellington: National Institute of Water and Atmospheric Research.
Organisation for Economic Co-operation and Development. 2007. OECD Environmental Performance Reviews: New Zealand (PDF, 4.2MB). Paris: OECD Publishing.
Pinkerton, M. 2007. Sea productivity from satellite data, unpublished, prepared for the Ministry for the Environment. Wellington: Ministry for the Environment.
Robertson, B M, and Stevens, L. 2007. Major issues for New Zealand estuaries and selected case studies for state of environment report, unpublished, prepared for the Ministry for the Environment. Wellington: Ministry for the Environment.
Statistics New Zealand. 2006a. New Zealand’s Marine Economy 1997–2002.
Statistics New Zealand. 2006b. Overseas Cargo Statistics. Retrieved from: http://www.stats.govt.nz/products-and-services/hot-off-the-press/overseas-cargo/overseas-cargo-statistics-ye-jun06-hotp.htm?page=para004Master (1 May 2007).
Statistics New Zealand. 2007a. Fish Monetary Stock Account 1996–2006. Retrieved from http://www.stats.govt.nz/analytical-reports/fish-monetary-stock-account-1996-2006.htm (29 March 2007).
Statistics New Zealand. 2007b. Overseas merchandise trade: May 2007. Retrieved from http://www.stats.govt.nz/products-and-services/hot-off-the-press/overseas-merchandise-trade/overseas-merchandise-trade-may07-hotphtm?page=para014Master (9 July 2007).
Taylor, C N, and Buckenham, B. 2003. Social Impacts of Marine Reserves in New Zealand (PDF, 203KB). Wellington: Department of Conservation.
Thrush, S F, Hewitt, J E, Cummings, V J, Dayton, P K, Cryer, M, et al. 1998. Disturbance of the Marine Benthic Habitat by Commercial Fishing: Impacts at the scale of the fishery. Ecological Applications vol 8, pp 866–879.
United Nations Environment Programme. 2006. Marine and Coastal Ecosystems and Human Wellbeing: A synthesis report based on the findings of the Millennium Ecosystem Assessment.
Wilson, K J. 2006. The State of New Zealand’s Birds: Special report seabirds (PDF, 1MB). Wellington: Ornithological Society of New Zealand.
Chapter 11: Oceans
December 2007
© Ministry for the Environment