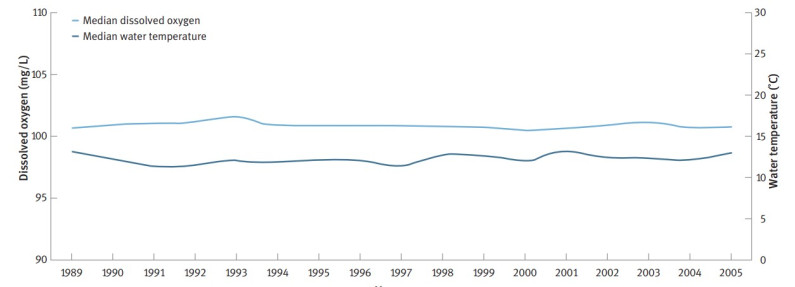
|
|
Median dissolved oxygen |
Median water temperature |
|---|---|---|
|
1989 |
100.55 |
12.9 |
|
1990 |
100.75 |
12.3 |
|
1991 |
101 |
11.3 |
|
1992 |
101 |
11.35 |
|
1993 |
101.5 |
11.9 |
|
1994 |
100.8 |
11.7 |
|
1995 |
100.7 |
12.15 |
|
1996 |
100.75 |
11.9 |
|
1997 |
100.75 |
11.3 |
|
1998 |
100.75 |
12.55 |
|
1999 |
100.65 |
12.55 |
|
2000 |
100.3 |
11.95 |
|
2001 |
100.7 |
13.05 |
|
2002 |
100.9 |
12.1 |
|
2003 |
101.05 |
12.3 |
|
2004 |
100.6 |
12 |
|
2005 |
100.65 |
12.9 |
|
|
Median dissolved oxygen |
Median water temperature |
|---|---|---|
|
1989 |
100.55 |
12.9 |
|
1990 |
100.75 |
12.3 |
|
1991 |
101 |
11.3 |
|
1992 |
101 |
11.35 |
|
1993 |
101.5 |
11.9 |
|
1994 |
100.8 |
11.7 |
|
1995 |
100.7 |
12.15 |
|
1996 |
100.75 |
11.9 |
|
1997 |
100.75 |
11.3 |
|
1998 |
100.75 |
12.55 |
|
1999 |
100.65 |
12.55 |
|
2000 |
100.3 |
11.95 |
|
2001 |
100.7 |
13.05 |
|
2002 |
100.9 |
12.1 |
|
2003 |
101.05 |
12.3 |
|
2004 |
100.6 |
12 |
|
2005 |
100.65 |
12.9 |
Notes:
(1) Different scales are used for dissolved oxygen and water temperature.
(2) mg/L = milligrams per litre.
Source: Adapted from Ministry for the Environment, 2006d.
Figure 10.9: Trends in dissolved oxygen and water temperature in rivers in the national monitoring network, 1989–2005
April 2021
© Ministry for the Environment