
Notes:
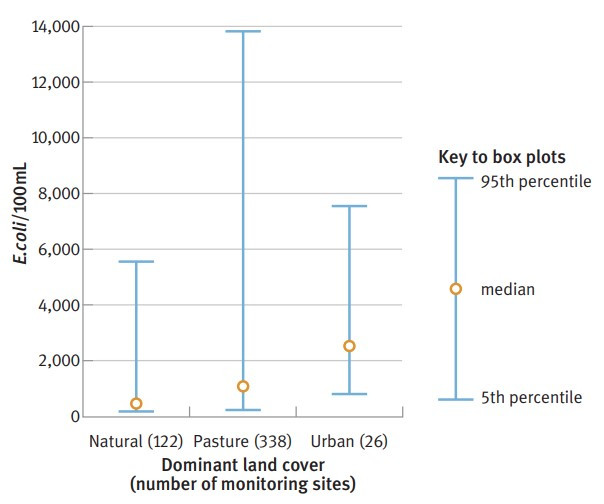
(1) Statistics in the graph are derived from 95th percentile data.
(2) These results include winter sampling results, when faecal-bacteria loads are typically relatively high. This is because there is increased run-off from higher winter rainfall and bacteria tend to live longer in cooler temperatures. However, in general, recreational activities such as swimming do not take place in winter.
(2) mL = millilitres (of water).
Data source: Ministry for the Environment, in press a.
Between 1989 and 2003, the median visual clarity improved in rivers within the national monitoring network. Almost half of the 77 monitored sites showed increases in visual clarity of more than 1 per cent per year over this time. Since 2000, the median visual clarity for monitored New Zealand rivers ranged between 1.0 and 1.9 metres (Ministry for the Environment, 2006d). This meets the requirements for ecosystem protection (Australia and New Zealand Environment Committee Council guidelines state that clarity of less than 0.7 metres, averaged for upland and lowland rivers, is unacceptable) but has, at times, been below the recommended minimum for human recreation (1.6 metres) (Australia and New Zealand Environment Committee Council, 2000).
Water clarity varies widely between rivers around the country. Visual clarity of only 10 to 40 centimetres is common in rivers with very high levels of sediment. These rivers include the lower Manawatü, the Waitara in Taranaki, and the Waipaoa in the Gisborne district.
Soil erosion is a common cause of low levels of clarity in New Zealand rivers and streams. This may be a consequence of poorly managed farmland (for example, the collapse of unprotected stream banks and sediment run-off from paddocks). Urban development and harvesting of plantation forestry can also produce high volumes of sediment run-off.
Natural factors can also determine clarity. For example, the low level of clarity in the Waipaoa River is caused by the geology of the catchment. Sandstones, mudstones, and gravels are easily eroded, which leads to high suspended-sediment loads (Gisborne District Council, no date). See also box ‘More about hill-country erosion and our geological history’ in chapter 9, ‘Land’.
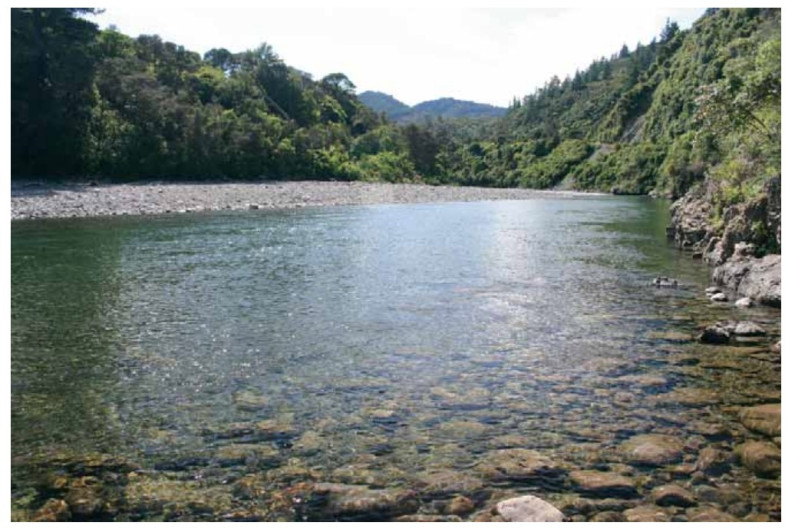
Visibility of more than 10 metres is common in the country’s clearest rivers (the upper Motueka, Clutha, and Monowai in the South Island high country). The upper catchment of the Motueka River is almost entirely native bush or bare mountain rock and, as a result, the amount of sediment-laden run-off that enters the upper reaches of the river after rainfall is minimal. The photo on the opposite page shows an example of a river with high visual clarity – the Waiohine River in the Wairarapa.
Waiohine river gorge in the wairarapa, a river with very high visual clarity

It is not yet possible to identify why the water clarity in rivershas improved. However, the improvement may be related to a reduction in sediment in the water as a result of better forestry and farm management (for example, fencing to prevent stock trampling river and stream banks).
Water temperature and dissolved oxygen
Water temperatures and levels of dissolved oxygen remained stable in rivers in the national monitoring network over 1989–2005 (see Figure 10.9). This is encouraging because trends towards higher temperatures and lower levels of dissolved oxygen would indicate water quality was declining.
Large rivers are less susceptible to signifi cant temperature changes than streams. There is some evidence from regional council reporting (for example, Tasman District Council, 2005) that streams in developed catchments regularly experience water temperatures that are high enough to threaten their ecology.
These streams are typically unshaded because the riparian vegetation has been cleared.
Figure 10.8: Concentrations of Escherichia coli (E. coli) bacteria in rivers and streams in catchments with different land uses, 1997–2002
April 2021
© Ministry for the Environment