
Notes:
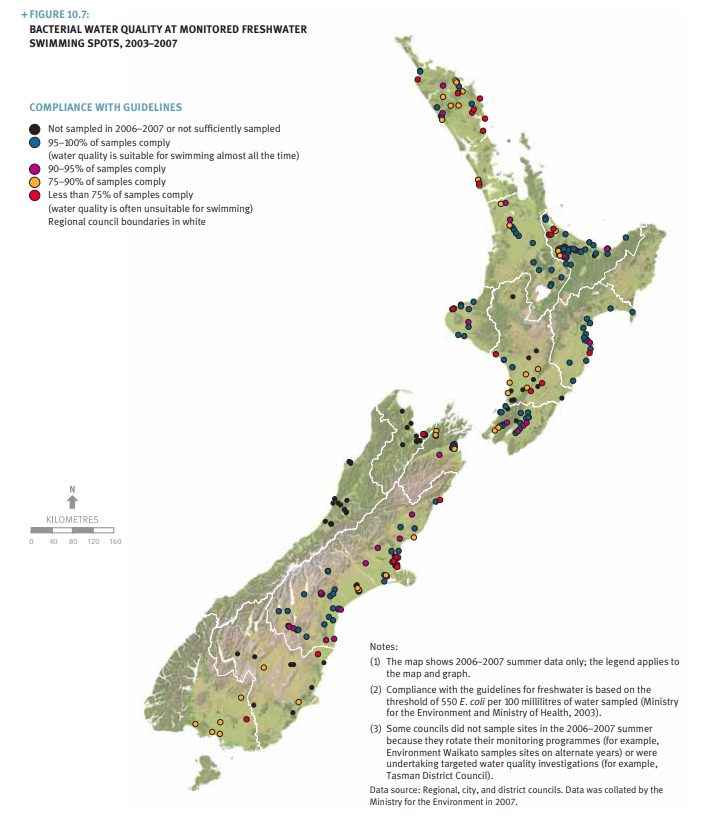
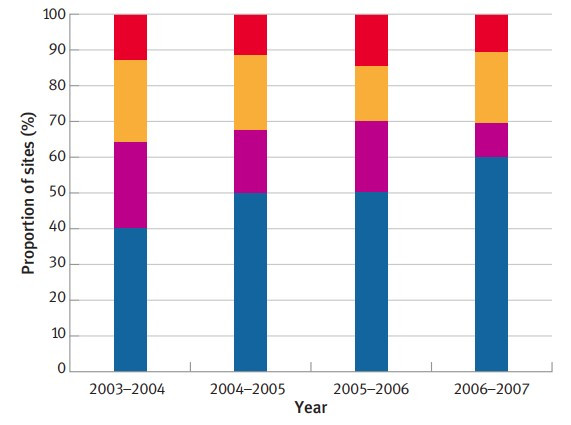
- The map shows 2006–2007 summer data only; the legend applies to the map and graph.
- Compliance with the guidelines for freshwater is based on the threshold of 550 E. coli per 100 millilitres of water sampled (Ministry for the Environment and Ministry of Health, 2003).
- Some councils did not sample sites in the 2006–2007 summer because they rotate their monitoring programmes (for example, Environment Waikato samples sites on alternate years) or were undertaking targeted water quality investigations (for example, Tasman District Council).
Data source: Regional, city, and district councils. Data was collated by the Ministry for the Environment in 2007.

Rivers and streams with the highest average levels of faecal pollution are those in towns and cities (see the comparison of median levels in Figure 10.8). Faecal matter from birds, cats, and dogs may be carried by stormwater into urban waterways, although there is little evidence that this source on its own results in infectious levels of bacteria (Ministry for the Environment, 2002). A signifi cant amount of faecal material comes from human waste leaking from sewerage systems.
Like those in urban areas, rivers and streams in pastoral areas also have high levels of bacteria (relative to waterways in natural catchments). While the levels of bacteria in pastoral waterways are lower than in urban sites, the worst pastoral sites that are monitored have signifi cantly higher levels of bacteria than the worst urban sites that are monitored (as indicated by the relatively high 95th percentile for pastoral sites in Figure 10.8).
It is known that farm stock with access to river and stream beds can contribute high amounts of faecal matter directly to the water. One study has shown that if cows cross a stream on their way to and from milking, they are 50 times more likely to defecate in the water than on adjacent raceways (DaviesColley et al, 2004).
Many sites in predominantly natural catchments, where land-use pressures are considered to be lowest, also have high levels of bacteria. These high levels could be caused by faecal matter from birds and other wild animals, such as possums, deer, and goats. Predominantly natural catchments may also have small pockets of urban or pastoral land use that deliver signifi cant amounts of faecal material to the water.
Figure 10.7: Bacterial water quality at monitored freshwater swimming spots, 2003–2007
April 2021
© Ministry for the Environment