|
Parameter |
Natural catchment (39 monitored lakes) |
Pasture catchment (55 monitored lakes) |
|---|---|---|
|
Total nitrogen |
0.00174 (scaled for graph) |
0.00733 (scaled for graph) |
|
Total phosphorus |
0.0083 |
0.051 |
|
Algae (Chlorophyll a) |
0.0017 |
0.0094 |
|
Visual clarity (m) |
6.4 |
1.2 |
|
Parameter |
Natural catchment (39 monitored lakes) |
Pasture catchment (55 monitored lakes) |
|---|---|---|
|
Total nitrogen |
0.00174 (scaled for graph) |
0.00733 (scaled for graph) |
|
Total phosphorus |
0.0083 |
0.051 |
|
Algae (Chlorophyll a) |
0.0017 |
0.0094 |
|
Visual clarity (m) |
6.4 |
1.2 |
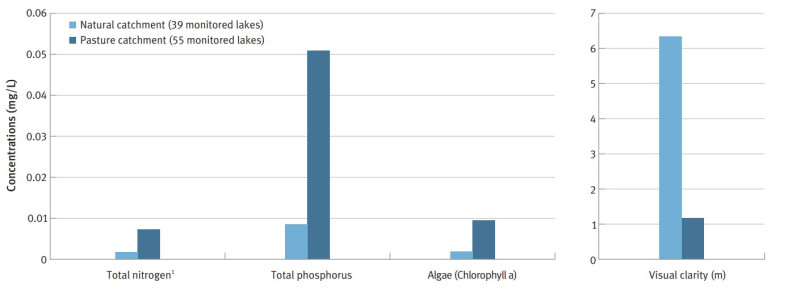
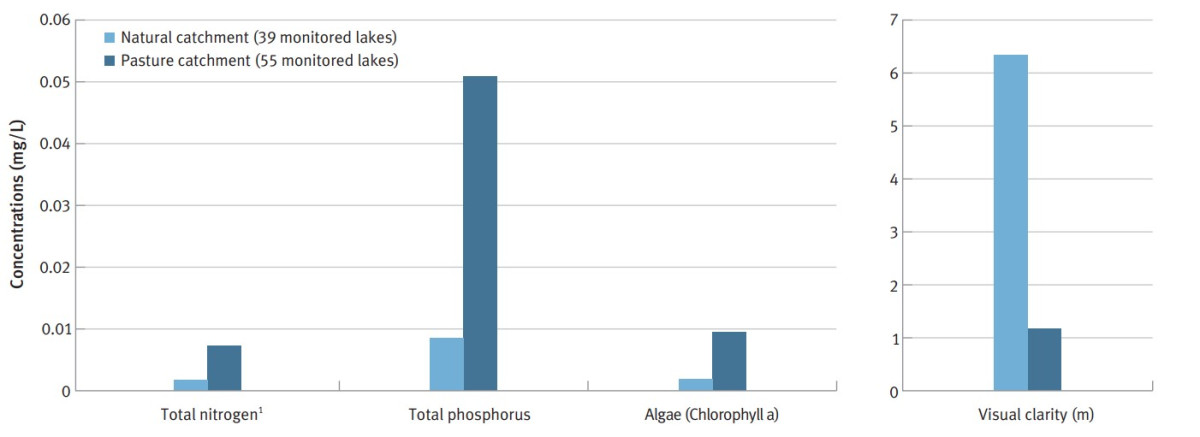
Notes:
- Total nitrogen concentrations are much higher than total phosphorus concentrations, but nitrogen values have been scaled down by 100 in this graph for the purposes of presenting information on both nutrients together.
- mg/L = milligrams per litre.
Data source: Ministry for the Environment, in press c.
Because algal concentrations affect water clarity, the lakes in natural catchments have water that is, on average, five times clearer than water in lakes in pastoral catchments. For example, lakes in the mountainous terrain of the South Island commonly have underwater visibility for more than 10 metres (Ministry for the Environment, 2006b), although this is lowered naturally in some cases by tannins leaching from beech forests or by fine glacial sediment.
The photo opposite shows an example of a degraded lowland lake that is surrounded by farmland – Lake Spectacle in the Auckland region. Many lakes that lie in intensively used catchments are the subject of management programmes that aim to stem the infl ow of pollutants from the surrounding land (see box ‘Local action to protect water quality in Lake Taupö and the Rotorua Lakes’).
Lake spectacle in the auckland region (with lake tomorata in the background).
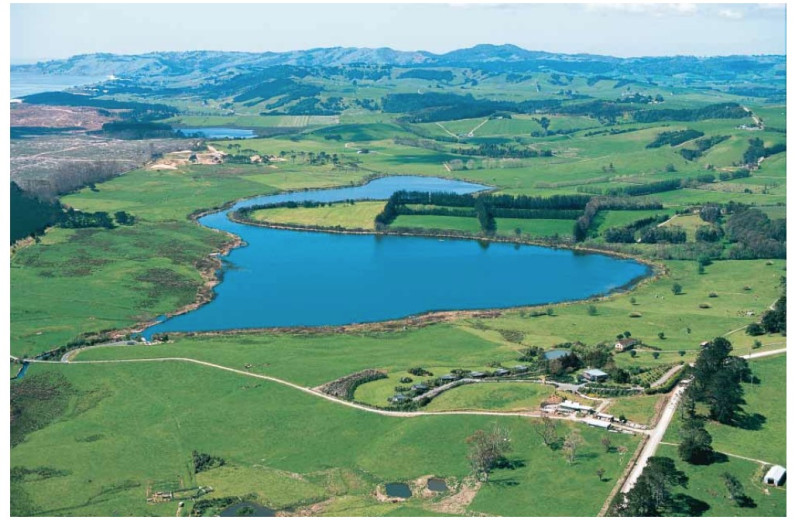
Figure 10.6: Comparison of Trophic Level Index water quality variables between lakes in pasture catchments and lakes in natural catchments, 2004–2006
April 2021
© Ministry for the Environment