NZ ETS forecasts of emissions, removals and entitlements from the Crown’s financial forecasting
Forecasts on this page can help NZ ETS participants make decisions on how to meet emissions obligations.
Forecasts on this page can help NZ ETS participants make decisions on how to meet emissions obligations.
The data in the table and graphs below is taken from the Government’s fiscal forecasts.
These forecasts are based on when emissions or removals occur. They are not based on when NZUs are surrendered or allocated.
The forestry NZU forecasts assume foresters report their emissions every year, as per the Voluntary Emissions Reporting Period (VERP). However, foresters may report in accordance with the Mandatory Emissions Reporting Period (MERP) every 5 years.
Refer to the detail about the forestry forecasts for additional information
This data is accurate as of October 2024 and there will be a further update mid-2025 following the release of the Government’s annual Budget.
|
Calendar year |
2025 |
2026 |
2027 |
2028 |
2029 |
|
|
Overall limit |
19.1 |
17.4 |
15.9 |
14.2 |
12.6 |
|
|
Auction volume |
6.0 |
5.2 |
4.3 |
3.3 |
2.4 |
|
|
Forecast industrial allocation |
6.0 |
5.7 |
5.7 |
5.6 |
5.5 |
|
|
Forestry removals |
13.2 |
15.0 |
16.8 |
18.3 |
19.2 |
|
|
Other removals |
2.0 |
2.0 |
2.0 |
2.0 |
2.0 |
|
|
Forecast NZU removals, industrial allocation, and auction volumes |
27.2 |
27.9 |
28.8 |
29.2 |
29.1 |
|
|
Liquid fossil fuels |
19.0 |
19.0 |
18.9 |
18.8 |
18.8 |
|
|
Stationary energy and industrial processes |
13.3 |
13.3 |
12.6 |
12.4 |
11.4 |
|
|
Waste and synthetic gases |
1.2 |
1.2 |
1.2 |
1.2 |
1.2 |
|
|
Deforestation and harvesting |
7.3 |
5.7 |
4.4 |
5.2 |
5.1 |
|
|
Forecast NZU emissions and deforestation |
40.8 |
39.2 |
37.1 |
37.6 |
36.5 |
|
|
Net difference |
-13.6 |
-11.3 |
-8.3 |
-8.4 |
-7.4 |
|
|
Potential additional entitlements of CCR volume |
7.1 |
6.5 |
5.9 |
5.3 |
4.7 |
|

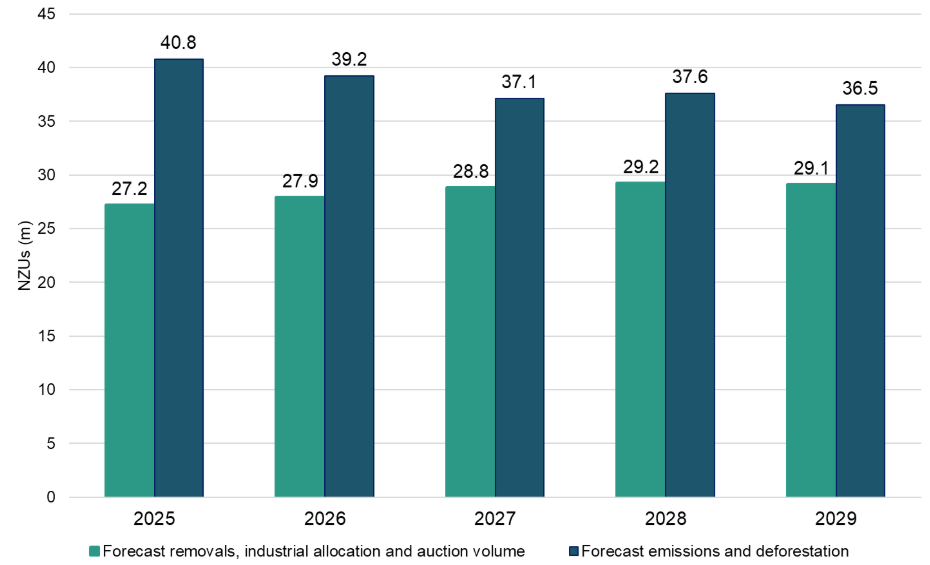
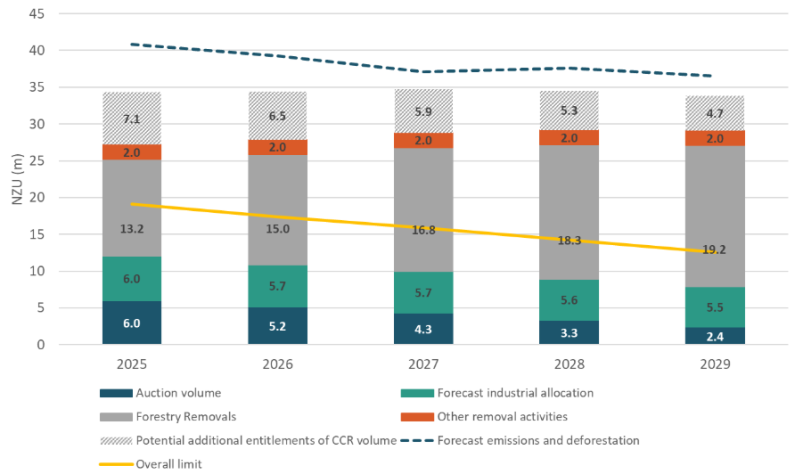

The forecasts show how NZU removals (plus industrial allocation and auction volumes) compare to NZU emissions and deforestation over time. This is also compared to the overall limit on NZUs and is set by The Minister of Climate Change each year.
The overall limit consists of units available by auction, by other means (eg, from industrial allocation) and approved overseas units (which, as New Zealand currently has no access to offshore mitigation, is zero).
For information on the number and type of units in the stockpile see Privately held units [EPA website].
Forecasts for forestry are challenging because there are many factors that influence forestry decision making in the NZ ETS.
They include the following factors.
The deforestation surrender forecasts assume 100 per cent compliance and that 100 per cent of post-1989 forest owners submit an annual voluntary emissions return.
For more information on forestry see About forestry in the Emissions Trading Scheme [MPI website].
We welcome your feedback on the data.
Email: ETSFeedback@mfe.govt.nz
The Ministry will keep these forecasts updated as new data becomes available.