NZ ETS forecasts of emissions, removals and entitlements from the Crown’s financial forecasting
This page provides the New Zealand Emissions Trading Scheme (NZ ETS) inputs into the Government's financial forecasts.
This page provides the New Zealand Emissions Trading Scheme (NZ ETS) inputs into the Government's financial forecasts.
The data in the table and graphs below show the forecast emissions and removals taken from the Government’s financial forecasts relating to the NZ ETS. The forecasts are used for the Government’s Budget Economic and Fiscal Updates published by the Treasury. The most recent updates can be found on the Treasury’s Budgets and forecasts webpage.
Budgets and forecasts [The Treasury]
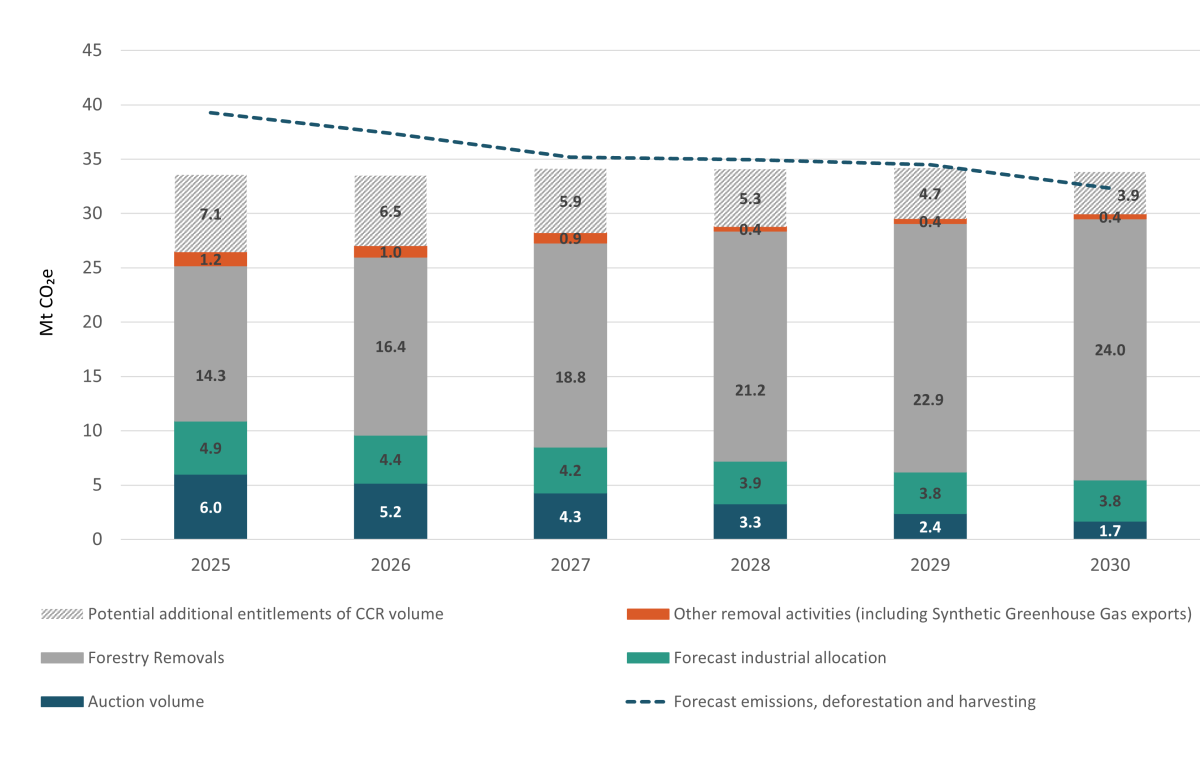
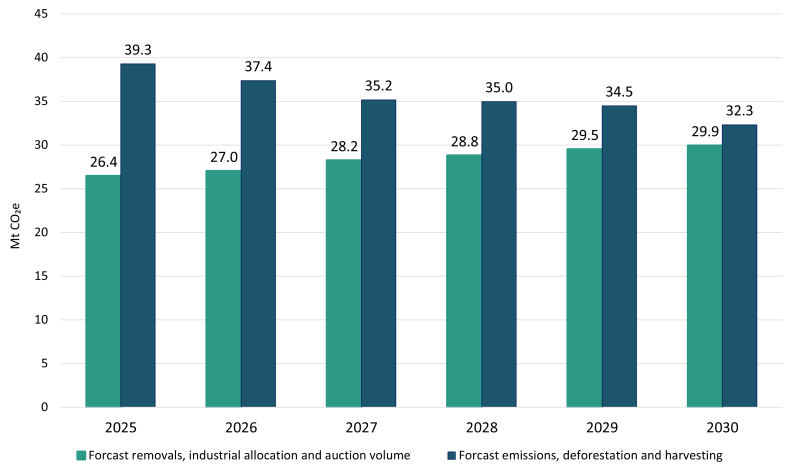
The forecasts predict removals, industrial allocation, auction volume, and emissions over time. Removals, industrial allocation, and auction volume are grouped together because they will lead to New Zealand emission units (NZUs) entering the NZ ETS. Emissions lead to NZUs being surrendered in the NZ ETS. Cost Containment Reserve (CCR) NZUs are shown at the bottom of the table – these are extra units that are made available at auction if a certain price is met.
For more information on auction units, see the annual updates to emission unit limits and price control settings.
It is important to be aware that these forecasts are based on when the activity (the emissions and removals) is forecast to occur. The surrender or allocation of the units relating to those emissions or removals will not happen until the next calendar year or later for some forestry activities. This is different for units bought at auction or provided through free industrial allocation. Auctioned units are transferred to a purchaser’s Emissions Trading Register account soon after they have been purchased. Most industrial allocations are provided in advance of the emissions, on a provisional basis, and then ‘trued up’ the following year once the actual emissions are known.
Annual emissions reporting is optional for forestry, and a forester only has to submit an emissions return at the end of a Mandatory Emissions Reporting Period (MERP). The forestry forecasts assume all foresters report their emissions every year, however foresters may report at the end of the MERP.
Refer to the detail about the forestry forecasts for additional information
This data is accurate as of October 2025 and there will be a further update mid-2026 following the release of the Government’s annual Budget.
The numbers in the table below are in millions of tonnes of carbon dioxide equivalent (Mt CO₂e).
|
Calendar year |
2025 |
End of 2023-2025 MERP* |
2026 |
2027 |
2028 |
2029 |
2030 |
End of 2026-2030 MERP* |
|
|
Forecast removals, industrial allocation, and auction volumes |
|||||||||
|
Auction volume |
6.0 |
|
5.2 |
4.3 |
3.3 |
2.4 |
1.7 |
|
|
|
Forecast industrial allocation |
4.9 |
|
4.4 |
4.2 |
3.9 |
3.8 |
3.8 |
|
|
|
Forestry removals |
14.3 |
MERP 4 Total: 39.1 |
16.4 |
18.8 |
21.2 |
22.9 |
24.0 |
MERP 5 Total: 103.3 |
|
|
Other removals and synthetic gases |
1.2 |
|
1.0 |
0.9 |
0.4 |
0.4 |
0.4 |
|
|
|
Total |
26.4 |
|
27.0 |
28.2 |
28.8 |
29.5 |
29.9 |
|
|
|
Forecast emissions, deforestation and harvesting |
|||||||||
|
Liquid fossil fuels |
19.0 |
|
19.0 |
18.9 |
18.8 |
18.7 |
18.4 |
|
|
|
Stationary energy and industrial processes |
12.6 |
|
12.3 |
11.5 |
10.8 |
10.5 |
10.0 |
|
|
|
Waste and synthetic gases |
1.0 |
|
1.0 |
0.8 |
0.8 |
0.7 |
0.7 |
|
|
|
Deforestation and harvesting |
6.7 |
MERP 4 Total: 25.1 |
5.1 |
3.9 |
4.6 |
4.6 |
3.2 |
MERP 5 Total: 21.4 |
|
|
Total |
39.3 |
|
37.4 |
35.1 |
35.0 |
34.5 |
32.3 |
|
|
|
Net Total |
-12.5 |
|
-10.1 |
-6.7 |
-6.0 |
-4.7 |
-2.2 |
|
|
|
Potential additional auction volume from CCR** |
7.1 |
|
6.5 |
5.9 |
5.3 |
4.7 |
3.9 |
|
|
*MERP – Mandatory Emissions Return Period
**cost containment reserve (CCR)
Industrial allocation and other removal activity forecasts are marginally lower than the figures included in the Crown’s fiscal forecasts, reflecting a minor calculation refinement that was assessed as immaterial at the time.


Forecasts for forestry are challenging because there are many factors that influence forestry decision making in the NZ ETS.
They include the following factors.
The deforestation surrender forecasts assume 100 per cent compliance and that 100 per cent of post-1989 forest owners submit an annual voluntary emissions return.
For more information on forestry see About forestry in the Emissions Trading Scheme [MPI website].
We welcome your feedback on the data.
Email: ETSFeedback@mfe.govt.nz