This report provides a snapshot of current lake water quality and lake water quality monitoring in New Zealand between and 1995 and 2005. It reports on the monitoring that is being done by councils and provides a national summary of monitoring results. The report focuses on collating recently published information on trophic (nutrient) status and ecological condition (LakeSPI) of lakes rather than on analysing actual water quality data.
This survey and report depended on the help and assistance of many people. Initiation, funding and direction for the project were provided by Nick Zaman (project manager), Mike Thompson and Vera Power from Ministry for the Environment. Brian Sorrell and Helen Harren (NIWA) helped integrate this survey with the current lake classification work; and Jonathan Brown, Elva Christianson, Andy Standley, Simon Curtus, Steph Brown, and Darryl Lew from Opus International Consultants supported the data collation, analysis and review.
Finally, but most importantly, this project relied on the assistance and co-operation of regional councils and unitary authorities. Particularly thanks to the following people: Emma Simpson (Northland Regional Council), Grant Barnes (Auckland Regional Council), Bill Vant (Environment Waikato), John McIntosh and Paul Scholes (Environment Bay of Plenty), Chris Fowles (Taranaki Regional Council), Kerry Hudson, (Gisborne District Council), Brett Stansfield (Hawke's Bay Regional Council), Olivier Ausseil and Barry Gilliland (Horizons Manawatu-Wanganui Regional Council), Alton Perrie (Greater Wellington Regional Council), Peter Hamill (Marlborough District Council), Paul Sheldon (Nelson City Council), Trevor James (Tasman District Council), Adrian Meredith and Shirley Hayward (Environment Canterbury), Jonny Horrox (West Coast Regional Council), Rachel Ozanne (Otago Regional Council), and Chris Jenkins (Environment Southland).
This report provides a snapshot of current lake water quality and lake water quality monitoring in New Zealand. It reports on what monitoring is being done by councils and provides a national summary of these monitoring results. The report focuses on collating recently published information rather than on analysing actual water quality data. This means that some caution is needed when comparing water quality state and trends between different lakes because data was analysed over different time periods.
This survey identifies that 153 New Zealand lakes are being monitored by 13 councils for trophic status, ecological condition or cyanobacteria through bathing beach monitoring programmes. Trophic status is being assessed in 119 lakes and ecological condition is being assessed using LakeSPI (submerged plant indicators) in 86 lakes. The number of lakes monitored by regional councils is expanding. Prior to 2000, about 87 lakes were being monitored (68 for trophic status). Since then, lake water quality monitoring has been initiated in Northland, Southland and the Chatham Islands, will be initiated in Hawke's Bay this year and has been expanded in other regions (eg, Otago).
LakeSPI monitoring provides valuable information on lake ecological condition but its use is currently restricted to three councils in the North Island. This means that no LakeSPI information is being reported for the South Island and for some lake types. It is likely several more councils will adopt LakeSPI monitoring in the near future (eg, Hawke's Bay Regional Council).
Lake trophic state is reported for 134 lakes using current and past monitoring programmes. Slightly over half the lakes monitored are eutrophic or worse. This not only reflects pressures on the lakes but also the tendency for shallower lakes to be more eutrophic.
Information on trends in trophic state is available for 70 lakes and shows that more lakes are improving (33 percent) compared to those with declining quality (19 percent). This is mostly due to improved water quality in the already pristine Canterbury high-country lakes. Trends in ecological condition were available for 46 lakes and are not so positive. Half the lakes show a decline in condition and only 22 percent show an improvement. This can be attributed to pressures such as invasive plants, exotic fish, sediment loads and nutrients.
Several gaps in our ability to report lake water quality at a national level were identified. These gaps relate to the extent to which indicators are used, the extent to which the monitoring network is representative of New Zealand lakes, and to ensuring appropriate management objectives against which to report. To improve our ability to report on national lake water quality it would be helpful to have appropriate targets or reference conditions for different types of lakes. A lake classification system is currently being developed by NIWA and the Department of Conservation which may improve our framework for reporting on lake water quality. Recommendations are made for further work.
1.1 Background
New Zealand's lakes are the 'crown jewels' of our country. We swim in them, fish in them, boat on them and enjoy looking at them. They provide water for drinking and hydroelectric power, reduce the effects of floods, and support diverse communities of plants and animals. However, lakes are vulnerable to activities within their catchments. This has been highlighted in recent years with political recognition of the threats facing Lake Taupo and the Rotorua lakes and the initiation of efforts to protect or restore these water bodies.
This report was prompted by the fact that we have no recent national picture of lake water quality and the concern that many of our lakes may be facing water quality pressures. The last comprehensive national monitoring programme of New Zealand lakes was carried out by NIWA between 1992 and 1996 (Burns and Rutherford 1998). Furthermore, the New Zealand State of Environment (SoE) Report published by the Ministry for the Environment in 1997 gave no overall perspective of lake water quality.
This report focuses on lake water quality monitoring undertaken by regional councils in the last 10 years, particularly the smaller, less iconic lakes. While other organisations monitor and investigate lake water quality, the bulk of the monitoring for state and trends is currently done by regional councils, or in association with regional councils. This report is not an inventory of New Zealand lakes such as that produced by Livingston et al (1986); it is not comprehensive and there will be information on other lakes, not covered by the Livingston report. Instead, this report provides a snapshot of current lake water quality monitoring by councils in New Zealand - its scope, extent and results. Additional information will be available from university research, Crown Research Institutes such as NIWA, one-off surveys or resource consent investigations.
Several important tools have been developed in the last 10 years to help with lake management. These include:
- the protocol for monitoring lake trophic levels and assessing trends in trophic state (Burns et al 2000)
- development of a method for using submerged aquatic macrophytes to assess lake condition, called LakeSPI (Clayton et al 2002)
- the publication of an update to the Lake Managers' Handbook (Elliott and Sorrell 2002; Mark and Single 2002; Champion et al 2002; Rowe and Graynoth 2002).
Also, a lake classification system is currently being developed by NIWA and the Department of Conservation and this is likely to provide a useful tool for prioritising lakes for more intense management intervention.
1.2 Snapshot survey method
This snapshot survey of lake water quality is a desktop assessment drawing together information from regional councils and published reports which describes lake monitoring programmes and their results. All regional councils and unitary authorities were contacted by letter and phone and asked to provide information on their lake monitoring programmes and results. This information was recorded in a template to improve consistency (see Appendix 1 and 2). Information in published reports was used to elaborate on the monitoring information supplied by councils. Many of these reports were supplied by the regional councils and others identified through a literature search. Actual water quality data was also requested from councils, primarily to assist with a parallel project being undertaken by NIWA to organise, classify and map information where available. This data was used to fill gaps where there was no recent published report describing lake water quality, or where insufficient details were provided to assess lake trophic status.
This survey identifies lakes as being monitored only if samples are collected from the lake itself, in contrast to samples from the rivers flowing out of the lakes. This is particularly the case with hydroelectric lakes on the Waikato River where water quality samples are collected downstream of the tailrace of several lakes as part of the river water quality monitoring network.
The trophic state for each lake is described using the most recent published results. Where no published results are available, a Trophic Level Index has been calculated from the data using the most recent 10-year period available (generally 1995-2005). The data has not been analysed for trends. The trends observed in this report are based on the results of published reports (primarily using methods in Burns et al (2000)) or, where not available, from comparative changes in the trophic state since the New Zealand Lake Water Quality Monitoring Programme (NZLMP) (Burns and Rutherford 1998).
1.3 Structure of report
This report is presented in six sections:
- an introduction
- a general overview of New Zealand lakes and factors affecting their water quality
- a snapshot of lake water quality monitoring
- a snapshot of lake water quality and trends identified by this monitoring
- a discussion of gaps for national reporting of lake water quality
- recommendations for further work to address gaps.
The key issues and themes are drawn together in the discussion and conclusions. Details of regional council monitoring programmes and the monitoring of individual lakes are provided in Appendix 1 and Appendix 2 respectively.
2.1 Classification of New Zealand lakes
New Zealand has 3,820 lakes over one hectare in size and many more that are smaller. Less than 40 lakes are greater than 1,000 hectares in size. [Based on the database of lakes produced by NIWA for developing a lake classification system.] The largest lake in New Zealand is Lake Taupo with an area of about 62,000 hectares and maximum depth of 163 metres. The next largest North Island lake is Lake Wairarapa with an area of almost 8,000 hectares and a maximum depth of less than three metres. The deepest North Island lake is Waikaremoana, at 248 metres deep, formed when a landslide blocked a valley 200 years ago (Spigel and Viner 1991, MfE 1997).
The South Island's largest lakes are Lake Te Anau, with an area of around 35,000 hectares and a maximum depth of 417 metres, and Lake Wakatipu with an area of 29,000 hectares and a maximum depth of 380 metres. The third largest South Island lake is Ellesmere (or Waihora) with an area of 18,000 hectares and a maximum depth of less than three metres. The deepest lake in New Zealand is Lake Hauroko in Southland with a maximum depth of 462 metres (Spigel and Viner 1991, MfE 1997).
Several broad categories of lakes can be identified that reflect formation processes. Volcanic eruptions created many of the North Island's larger lakes. Glacial ice gouged out the basins for many of the South Island lakes. Dune lakes are common in Northland and on the west coast of the North Island. Peat lakes are a distinctive feature of the Waikato region; they typically have slightly acidic and humic-stained water. Riverine lakes are formed when rivers change their course. Landslides blocking valleys can form large lakes. Lagoons are created by the movement of sandbars - they often have brackish water and are occasionally open to the sea. Finally, we create artificial lakes or reservoirs for hydro-power stations (Spigel and Viner 1991, MfE 1997).
NIWA is currently developing a classification system for New Zealand lakes for the Department of Conservation. This is a multivariate classification system based on lake variables (eg, physical attributes of area, depth, fetch etc) and catchment attributes (eg, proportion of catchment in beach forest, glaciers, peat, pasture, geology with high phosphorus etc). It is designed to discriminate the variation in the natural and existing character of New Zealand's lakes.
2.2 Factors affecting lake water quality
Lakes are intimately linked to their catchments. Land-use activities in a catchment affect the amount of water, nutrients, sediment and other contaminants that enter a lake. These inputs affect the water quality and the functioning of the lake's ecosystem. This is called eutrophication. Typically, an increase in nutrients to a lake stimulates growth of phytoplankton which reduces water clarity. At high nutrient levels algae blooms may occur, often of potentially toxic cyanobacteria species, causing surface scums and a decline in dissolved oxygen as the bloom decomposes. In very bad situations fish may die from the low dissolved oxygen levels. The state of the water quality and degree of nutrient enrichment is described by trophic state, with oligotrophic, mesotrophic and eutrophic lakes having progressively more nutrients, more algae biomass and poorer water clarity.
Although we report water quality in simple terms such as trophic state, the factors affecting lake water quality can be very complex. Some of the key factors that interact to affect lake water quality are: sediment resuspension and release of nutrients, grazing of phytoplankton, phytoplankton community composition, macrophytes and fish.
Wind has a strong influence on lakes; it can mix the water and resuspend bottom sediments - particularly in shallow lakes. This can increase the nutrients available for algae growth, at the same time the more turbid water can inhibit algae and macrophyte growth by reducing the amount of light available.
Lake Coleridge is a deep glacial lake in the South Island. In 1993, an earthquake triggered a large release of suspended sediments into the lake, reducing the water clarity. Over the next two years a die-off of native aquatic macrophytes (characean algae) occurred in the deep water so that the depth of macrophyte growth reduced from 30 metres to 20 metres. The depth of macrophyte growth has recently extended back down to 30 metres as the water has cleared (Elliot and Sorrell 2002).
The growth of aquatic macrophytes also has strong interactions with lake water quality. A collapse in the coverage of aquatic macrophytes has been observed in many shallow lakes around New Zealand - always with a corresponding decline in water quality, eg, Lake Rotokauri in 1996/97, Lake Rotomanuka 1996/97, Lake Rotoroa 1989/90, Lake Whangape in 1987 (in the Waikato), and Lake Omapere since 2000 (in Northland).
A crash in the macrophyte population can occur very quickly and be triggered by a storm, grazing by swans or fish, an increase in nutrient inputs or lowering of the water level. Following a die-off, the macrophytes decompose, releasing nutrients into the water which stimulates the growth of aquatic algae resulting in a decline in water clarity. Without the macrophyte cover, the lake sediments are more prone to resuspension - further increasing the turbidity of the water and the availability of nutrients. This turbid, phytoplankton-dominated state can last a long time and the macrophytes recover only slowly. When they do recover, as recently found in Lake Rotoroa (Hamilton), there is generally a corresponding increase in water quality.
Grazing by swan, fish or koura (native freshwater crayfish) has a very strong impact on the growth of aquatic macrophytes. In the North Island, koura (Parenephrops planifrons) reduce the density of charophytes in deeper water where the light is also limited. Introduced fish such as Japanese koi have a much larger impact on macrophytes and can completely destroy populations and prevent regeneration. A recent improvement in water quality in Lake Wainamu, near Bethels Beach in Auckland, has been partially attributed to the trapping and removal of coarse fish (eg, perch, goldfish, rudd) by the Auckland Regional Council and the local community. More information can be found on the Auckland Council website.
For further information on factors affecting lake water quality refer to the Lake Managers Handbook (Vant 1987) and the updated version on Land-Water Interactions (Elliot and Sorrell 2002).
3.1 General
Monitoring of lake water quality is an important aspect of lake management; it alerts us to potential problems and helps us measure the success of any management efforts. Two tools have recently been developed for monitoring New Zealand lakes. These are the Protocol For Monitoring Lake Trophic Levels And Assessing Trends In Trophic State (Burns et al 2000), and development of a method for using submerged aquatic macrophytes to assess lake condition, called LakeSPI (Clayton et al 2002). This snapshot survey identifies what lakes are currently being monitored by regional councils around New Zealand, the type of monitoring and how it is being undertaken. We found that the recently developed protocols for assessing trophic state (TLI) and lake condition (LakeSPI) are being widely adopted around the country.
3.2 Protocols for assessing lake trophic state and ecological condition
3.2.1 Protocols for monitoring trophic levels of New Zealand lakes and reservoirs
The protocol for monitoring trophic levels of New Zealand lakes and reservoirs (Burns et al 2000) provides procedures for monitoring lake water quality, assessing trophic state and determining trends. The protocol summarises water quality information into a Trophic Level Index (TLI). The TLI is an indicator of lake water quality compiled from annual values of total nitrogen, total phosphorus, algal biomass (as measured by concentrations of chlorophyll a) and water clarity (measured as secchi disc depth). A TLI score is calculated for each of these parameters and summarised into a single overall TLI score for the lake. The overall score is categorised into seven trophic states indicating progressively more nutrient enrichment, more algal productivity and reduced water clarity. These are:
- ultra-microtrophic TLI score <1 (pristine)
- microtrophic TLI score = 1-2
- oligotrophic TLI score = 2-3
- mesotrophic TLI score = 3-4 (moderately productive)
- eutrophic TLI score = 4-5
- supertrophic TLI score = 5-6
- hypertrophic TLI score >6 (extremely degraded, algae blooms common).
The monitoring protocols promote reasonably intensive monitoring, initially in order to obtain a baseline of lake water quality and to understand seasonal changes and lake dynamics. After several years, the monitoring intensity is sometimes reduced to focus on tracking water quality changes over the long term.
3.2.2 LakeSPI - a method for monitoring ecological condition in New Zealand lakes
LakeSPI is a management tool that uses Submerged Plant Indicators (SPI) to assess the ecological condition of New Zealand lakes and monitor trends in lake ecological condition (Clayton et al 2002). Key features of aquatic plant structure and composition are used to generate three LakeSPI indices. These are:
- Native Condition Index - this captures the native character of vegetation in a lake. A higher score means a healthier, more diverse community of native plants growing to greater depths.
- Invasive Condition Index - this captures the invasive character of vegetation in a lake. A higher score means more impact from exotic plants, which is often undesirable.
- LakeSPI Index - this is a synthesis of the Native Condition Index and the Invasive Condition Index and provides an overall indication of lake condition. The higher the score, the better the condition of the lake.
Lakes have differing physical characteristics that influence the extent and type of vegetation that can potentially be present. In this report, the LakeSPI indices are expressed as a percentage of a lake's maximum scoring potential and correspond to the depth of each lake. The highest possible LakeSPI Index is 100 percent.
3.3 Types of monitoring
There are generally two objectives for lake water quality monitoring programmes undertaken by regional councils. The first is state of the environment (SoE) monitoring, and the second is bathing beach monitoring to assess the suitability for contact recreation such as swimming.
SoE monitoring aims to assess state and trends, ie, how healthy are the lakes and are they getting better or worse? Assessing water quality (ie, trophic state) requires a different approach to the assessment of ecological conditions which focuses on submerged aquatic macrophytes, fish or koura. To assess water quality, sampling is usually done throughout the year and at locations either representative of the whole lake or an area of the lake most likely to respond to pressures, ie, shore or near inlet. The monitoring programmes are often designed to also increase our knowledge of the functioning and dynamics of a particular lake, hence a wide range of parameters are often sampled. LakeSPI is the most widely-used indicator of biological condition and it is likely to be more widely adopted. Some councils also collect information on the populations of koura, freshwater mussels and fish, but there is currently no commonly reported indicator for these organisms.
Bathing beach monitoring is designed to assess the suitability of a lake for contact recreation such as swimming, boating or fishing. Generally the sites monitored are at popular beaches with samples collected approximately weekly during the summer. Samples are analysed for parameters indicating the suitability for human health, ie, E. coli bacteria and in some cases cyanobacteria and cyanotoxins. This monitoring and the response to an exceedance of guideline values are based on the New Zealand Microbiological Water Quality Guidelines for Marine and Freshwater Recreational Areas (MfE 2003). More information on bathing beach monitoring can be found on the MfE website and on council websites.
A number of organisations undertake research, investigations and surveys on lake water quality, hydrology and biology which we have not identified in this snapshot survey but the information is extremely valuable. Capturing this information was beyond the scope of this report but could be addressed with an update of the inventory of New Zealand lakes (Livingston et al 1986).
While this snapshot survey has focused on SoE monitoring, it also reports information on bathing beach monitoring in order to assess the extent to which cyanobacteria are being monitored. Cyanobacteria are also monitored in some water supplies by city and district councils to ensure the suitability of the drinking water. In order to gain a more complete picture of cyanobacteria monitoring, a search was made of the Water Information New Zealand (WINZ) database to identify where cyanobacteria are being monitored in natural lakes.
3.4 State of environment (SoE) monitoring
3.4.1 General
New Zealand has 17 regional councils/unitary authorities (including the Chatham Islands Council) with 13 of these councils monitoring lake water quality. Those council which don't monitor lakes either have no natural lakes (ie, Nelson City), have lakes with very few pressures due to their location in the conservation estate (ie, Tasman District and Marlborough District), or they have plans to initiate lake monitoring in the near future (ie, Hawke's Bay Regional Council). [See Appendix 1 for the list of lakes planned to be monitored.]
This survey found a total of 153 lakes were being monitored by 13 councils for trophic status, ecological condition or cyanobacteria through bathing beach monitoring. This number is expanding; prior to 2000 about 87 lakes were being monitored (68 for trophic status). Since then, lake monitoring has been initiated in Northland (30 lakes), Southland (three lakes) and the Chatham Islands (10 lakes) and expanded in other regions. Furthermore, there are firm intentions by Hawke's Bay Regional Council to monitor a further eight lakes starting in 2006 and Otago Regional Council is planning to monitor a further two lakes. [Otago Regional Council is also changing the method of lake monitoring to be consistent with the protocol (Burns et al 2000).] The extension of monitoring to additional lakes is also being considered by Greater Wellington Regional Council and Tasman District Council - contingent on the outcome of monitoring reviews.
A detailed summary of lake monitoring being undertaken by regional councils is provided in Tables 10 and 11 in Appendix 1 along with lake specific information. These tables also identify the key publications used in this survey for each council.
Lakes with trophic level monitoring are mapped in Figures 1 and 2 (in red) along with all lakes greater than one hectare (in blue). Figures 3 and 4 map the same information but only show lakes greater than 50 hectares in size. For display purposes, a buffer has been placed around each lake so they appear larger than they actually are.
3.4.2 Distribution of monitored lakes
The largest lake monitored is Lake Taupo (62,000 hectares) and the smallest, Lake Rotopiko South (1.4 hectares). Although small, this lake is 3.5 metres deep and has a high ecological condition. About half (55 percent) of all the lakes monitored are shallow (less than 10 metres deep) and about half (49 percent) are less than 50 hectares in size.
Out of all lakes over 50 hectares in size, about one-third are being monitored (75 out of 229 lakes). Many of the large lakes not being monitored are in national parks (particularly in Fiordland) or are reservoirs for hydroelectric power generation. The Waikato River is monitored for water quality but the hydro lakes on the Waikato are not specifically monitored for water quality.
3.4.3 Monitoring of different lake types
Lake types differ across the country and this is reflected in the monitoring programmes. Table 1 shows the number of lakes and different types of lakes monitored in each region. A breakdown of monitoring according to lake type is given in Table 2. Council priorities for deciding which lakes to sample are based on the pressures on lakes, their values and uses rather than morphologically defined lake type. However, analysing the types of lakes monitored provides an indication of how representative a monitoring programme is being. For example, in the Waikato region there are no west coast dune lakes and few volcanic lakes monitored for water quality. Similarly, the numbers in Table 2 suggest there is value in extending the use of LakeSPI ecological assessments to glacial lakes, landslide lakes and lagoons.
Table 1: Types of lakes monitored by each regional council
|
Region |
Number of lakes monitored for: |
Type of lakes monitored |
|
|---|---|---|---|
|
SOE water quality |
LakeSPI |
||
|
Auckland |
7 |
2 |
Volcanic, dune, landslide |
|
Bay of Plenty |
12 |
12 |
Volcanic |
|
Canterbury: High country Lowland |
22 4 |
0 0 |
Glacial, reservoirs, lagoons, riverine |
|
Chatham Islands (monitored on behalf by Environment Canterbury) |
10 |
0 |
|
|
Gisborne District |
1 |
0 |
Lagoon |
|
Greater Wellington |
1 |
0 |
Riverine |
|
Hawke's Bay |
0 (8 starting September 2006) |
0 |
|
|
Manawatu-Wanganui |
1 |
0 # |
Dune |
|
Marlborough District |
0 |
0 |
|
|
Nelson City |
0 |
0 |
|
|
Northland |
30 |
39 |
Dune, volcanic, reservoir |
|
Otago |
10 |
0 |
Glacial, reservoir, riverine |
|
Southland |
4 |
0 |
Glacial, lagoon |
|
Taranaki |
1 |
0 |
Reservoir |
|
Tasman District |
0 |
0 |
|
|
Waikato |
15 (4 not current) ** |
33 |
Peat, riverine, volcanic*, dune* |
|
West Coast |
1 |
0 |
Glacial |
|
Total |
119 |
86 |
|
Notes:
* In the Waikato region, no dune lakes were monitored for water quality and Lake Taupo was the only volcanic lake monitored for water quality.
** These figures do not include sampling from the Waikato River downstream of the tailrace of two hydroelectric lakes (part of Environment Waikato's river water quality monitoring network).
# = Macrophyte surveys have been done prior to the development of LakeSPI in four additional lakes.
Table 2: Lake monitoring according to lake type
|
Lake type |
Number of lakes monitored for: |
Total number monitored |
|
|---|---|---|---|
|
LakeSPI |
SOE water quality |
||
|
Dune |
42 |
35 |
50 |
|
Glacial |
0 |
23 |
23 |
|
Volcanic |
19 |
15 |
21 |
|
Peat |
12 |
10 |
14 |
|
Riverine |
9 |
8 |
13 |
|
Reservoir |
3 |
3 |
7 |
|
Lagoon |
0 |
6 |
6 |
|
Landslide |
1 |
1 |
1 |
|
Not determined |
0 |
18 |
18 |
|
Total |
86 |
119 |
153 |
3.4.4 Water quality (trophic level index)
This survey found that trophic status is being assessed in 119 New Zealand lakes. In most cases, (ie, for 78 lakes and 10 councils) this was assessed using the Trophic Level Index. In some cases, a modified version of the Trophic Level Index is used. This is the case for 36 lakes in the Canterbury high country, the Chatham Islands and Southland's Waituna Lagoon. The reduced number of parameters was primarily because the system which collects the water quality samples makes measurements of secchi depth impractical - in the case of the Chatham Islands samples were collected from the lake edge, and lakes in the Canterbury high country were sampled by helicopter. [Alternative measurements are made such as black disc distance or turbidity.] A further four lakes are monitored for water quality but do not include two key TLI parameters of secchi depth and chlorophyll a. These lakes are in Southland (outlet to Mavora Lake South), Otago (Lake Dunstan and Lake Hawea,) and Gisborne (Ratahi Lagoon).
The last comprehensive national monitoring programme of New Zealand lakes monitored 27 lakes between 1992 and 1996, providing a good baseline of lake water quality information (Burns and Rutherford 1998). Water quality monitoring has continued on all but five of these lakes: Lake Tahroa (Waikato), Lake Tutira (Hawke's Bay), Lake Dudding (Manawatu-Wanganui), Lake Rotoiti (Tasman district) and Lady Lake (West Coast).
Most monitoring programmes were designed to characterise a lake's temporal and spatial variability, establish baseline water quality information, and assess state and trends. However, there were a variety of sample frequencies, parameters and a choice of sample sites. The lakes chosen for monitoring were generally chosen because they were one or more of the following:
- the lakes of highest value or quality (eg, Northland)
- the largest lakes in the region (eg, Auckland, Greater Wellington)
- lakes at high risk of eutrophication (eg, shallow lakes in the Waikato) or
- lakes of high use and public interest (eg, Canterbury high-country lakes).
In many cases, lakes were monitored on a roving rather than continuous basis, with several years of monitoring to collect baseline data followed by a period of no monitoring. Since 2000, new lake monitoring programmes have been initiated by Southland Regional Council, Northland Regional Council, Otago Regional Council, Canterbury Regional Council, Chatham Islands Council [Canterbury Regional Council has recently been contracted to provide regional council services to Chatham Island Council.] and (in 2006) Hawke's Bay Regional Council. In most cases, the new programmes are consistent with the lake monitoring protocols (Burns et al 2000). However, in some cases (eg, Canterbury high country and Chatham Islands) cost and practicalities demand a different approach such as sampling from the lake edge rather than from a central lake location or not doing profiles of dissolved oxygen-temperature.
Several regional councils have extended the parameters monitored beyond the traditional physical and chemical variables. Phytoplankton analysis is being done for lakes in Northland, Auckland, Waikato, Bay of Plenty, Taranaki and Canterbury. Bay of Plenty has started monitoring koura (freshwater crayfish) and kakai (freshwater mussels) to help assess ecological condition in some Rotorua lakes.
3.4.5 Ecological condition (LakeSPI)
This survey found that ecological condition was being assessed in 86 New Zealand lakes using LakeSPI with macrophyte monitoring in a further eight lakes prior to development of LakeSPI. Hawke's Bay is considering using LakeSPI in the future. Four regions (Northland, Auckland, Waikato and Bay of Plenty) are currently using both LakeSPI and the TLI to monitor a total of 57 lakes.
LakeSPI is a relatively new method and there is considerable scope to extend its use. Where it has been used, it has generally been done as a one-off survey. Northland Regional Council intends to repeat LakeSPI surveys approximately every five years.
3.5 Cyanobacteria monitoring for public health
Cyanobacteria can potentially produce toxins. When blooms occur and large numbers of cyanobacteria are present, this can be an issue for human and animal health as well as affecting the wider ecosystem (eg, by inhibiting the feeding of zooplankton). Five councils are monitoring phytoplankton and cyanobacteria as part of their state of environment monitoring programmes but most cyanobacteria monitoring is undertaken as part of bathing beach monitoring.
This survey identifies 41 lakes where cyanobacteria cell counts (or scan) and identification is being undertaken. For 23 of these lakes, this monitoring is part of a bathing beach monitoring programme. Cyanobacteria monitoring from bathing beach monitoring programmes provides water quality information for an additional four lakes where water quality monitoring does not otherwise occur. Scanning for cyanobacteria has not detected any issues in Lake Rotomanu in Taranaki; however, high cyanobacteria cell counts have occurred in Lake Dudding, Lake Pauri and Lake Wiritoa in the Manawatu-Wanganui region.
Where lakes or reservoirs are used to supply drinking water the suppliers often monitor for cyanobacteria to ensure the suitability of the supply. A review of the WINZ database and a survey of district health boards identified four natural lakes where cyanobacteria are monitored as part of drinking-water supplies. These are: Lake Taupo, Lake Karapiro (Waikato), Lake Te Anau (Southland), and Lake Mangamahoe (Taranaki).
Figure 1: Lakes in which water quality is monitored compared to all lakes > 1 hectare – North Island
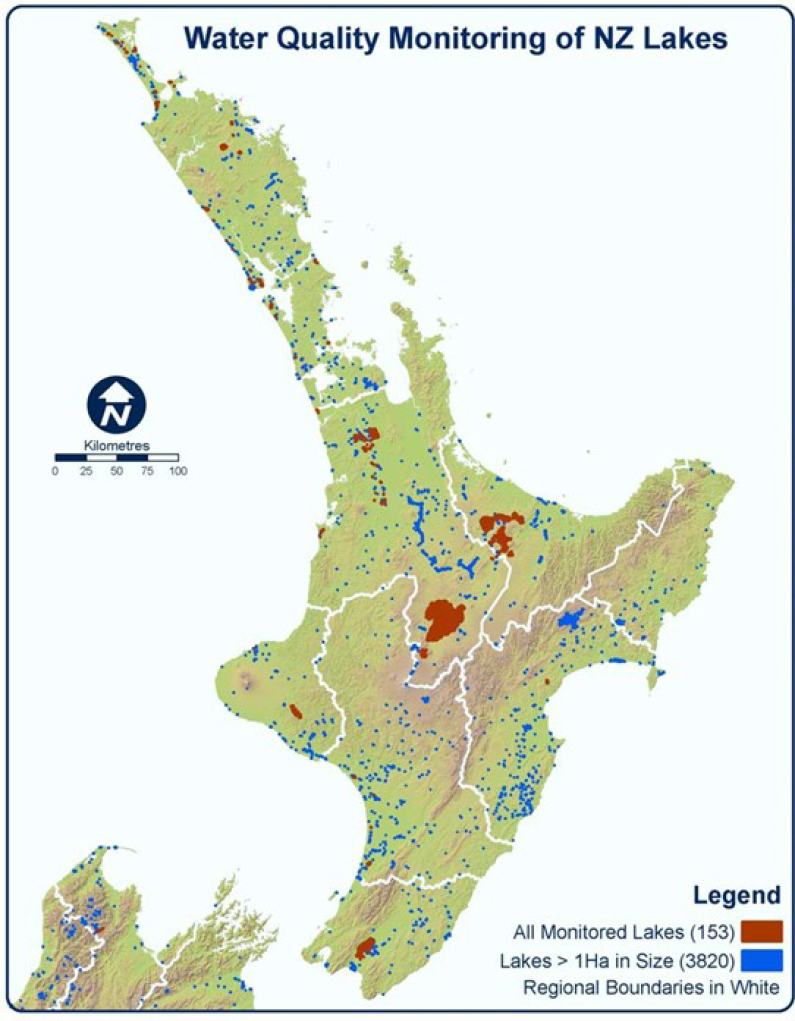
Image: Data source – Layer for lakes > 1 hectare sourced from NIWA.
Image: Data source – Layer for lakes > 1 hectare sourced from NIWA.
Figure 2: Lakes for which water quality is monitored compared to all lakes > 1 hectare – South Island
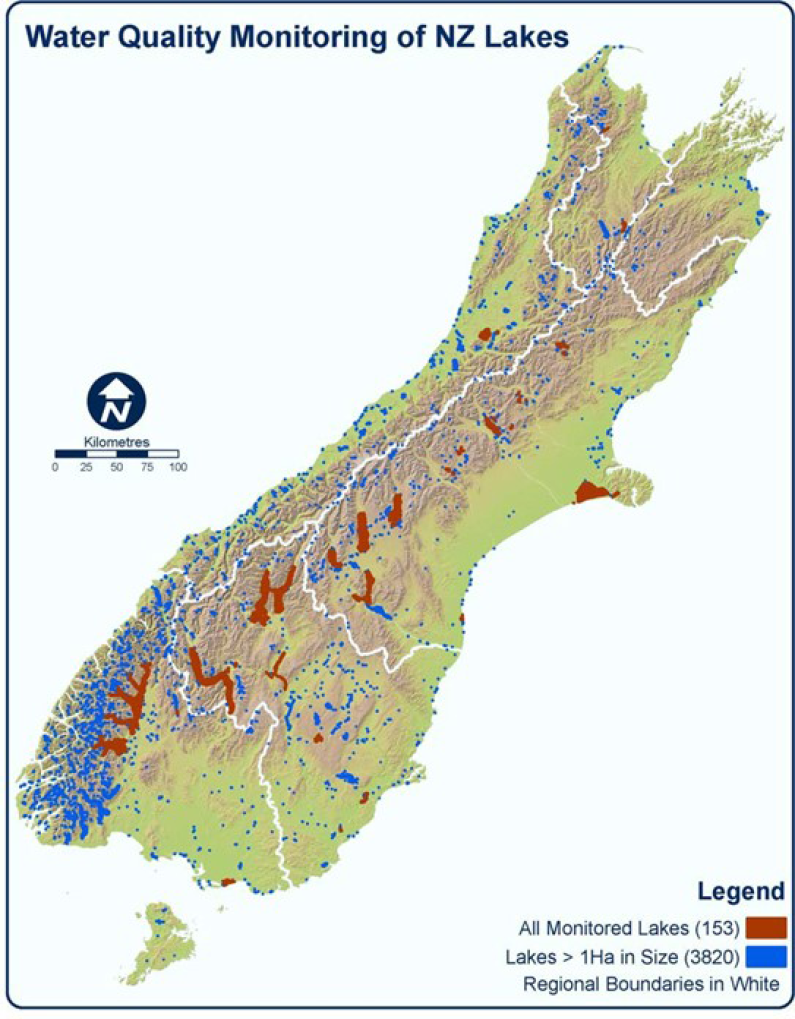
Image: Data source – Layer for lakes > 1 hectare sourced from NIWA.
Image: Data source – Layer for lakes > 1 hectare sourced from NIWA.
Figure 3: Lakes in which water quality is monitored compared to all lakes > 50 hectare – North Island
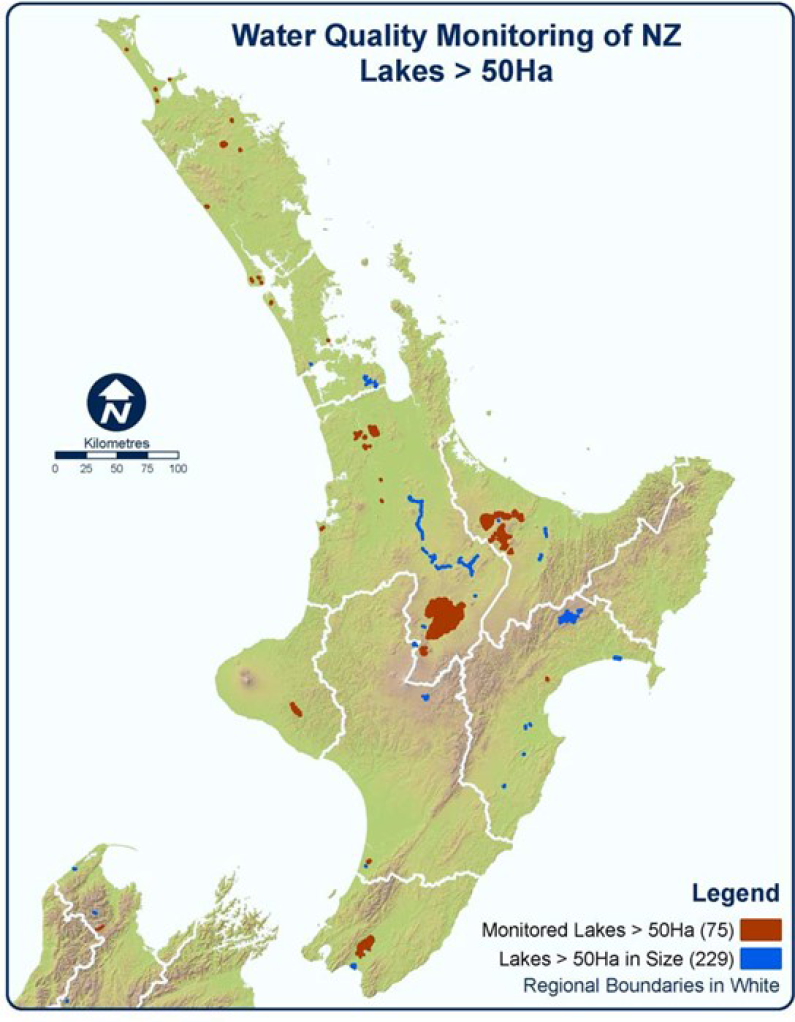
Image: Data source – Layer for lakes > 50 hectare sourced from NIWA.
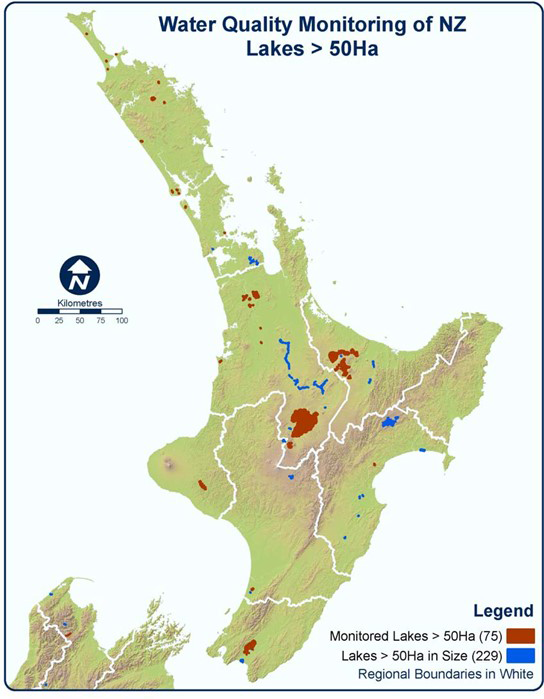
Image: Data source – Layer for lakes > 50 hectare sourced from NIWA.
Figure 4: Lakes for which water quality is monitored compared to all lakes > 50 hectare – South Island
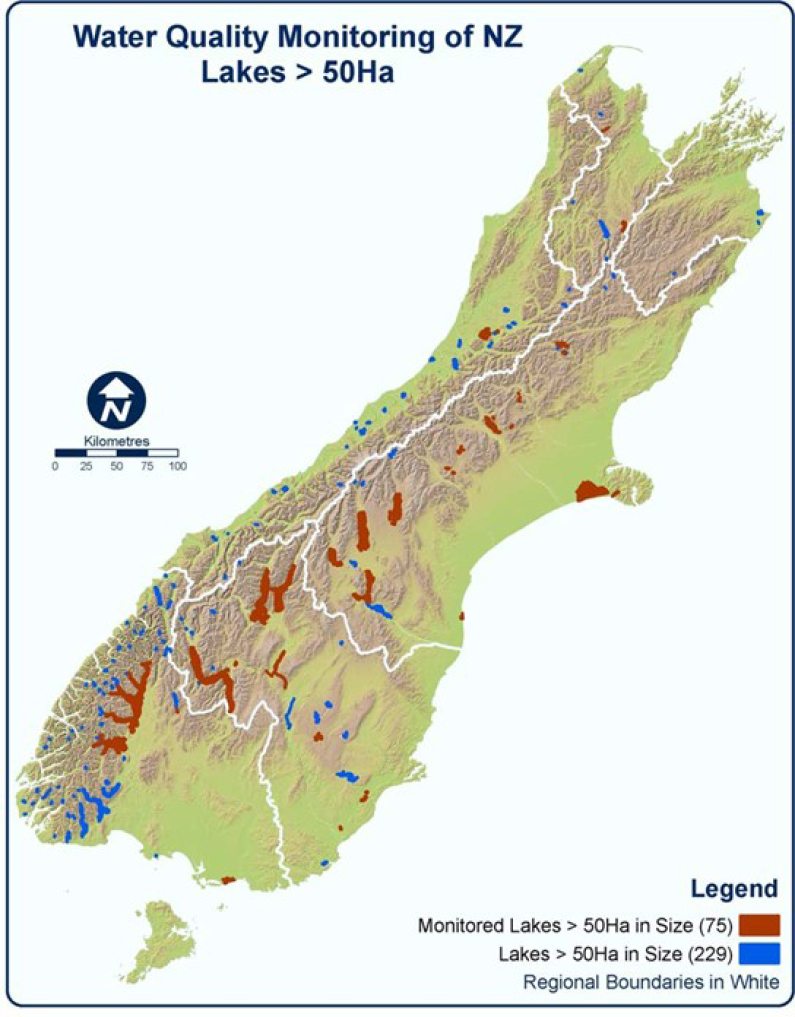
Image: Data source – Layer for lakes > 50 hectare sourced from NIWA.
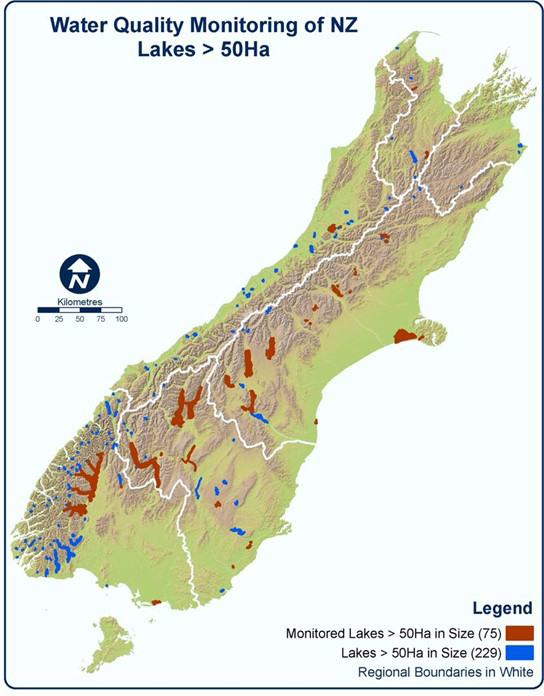
Image: Data source – Layer for lakes > 50 hectare sourced from NIWA.
4.1 Water quality (TLI)
Trophic state was assessed using the Trophic Level Index (TLI) or a modified version of the TLI for 134 lakes. Thirteen of these lakes are not currently monitored and the trophic state is based on either the results of a survey (the case for nine lakes in Northland) or based on the results of the New Zealand Lake Water Quality Monitoring Programme (NZLWQMP) conducted between 1992 and 1996 (Burns and Rutherford 1998). [This is the case for five lakes: Lake Taharoa (Waikato), Lake Dudding (Manawatu/Wanganui), Lake Tutira (Hawke's Bay), Lake Rotoiti (Tasman District) and Lake and Lady Lake (West Coast).]
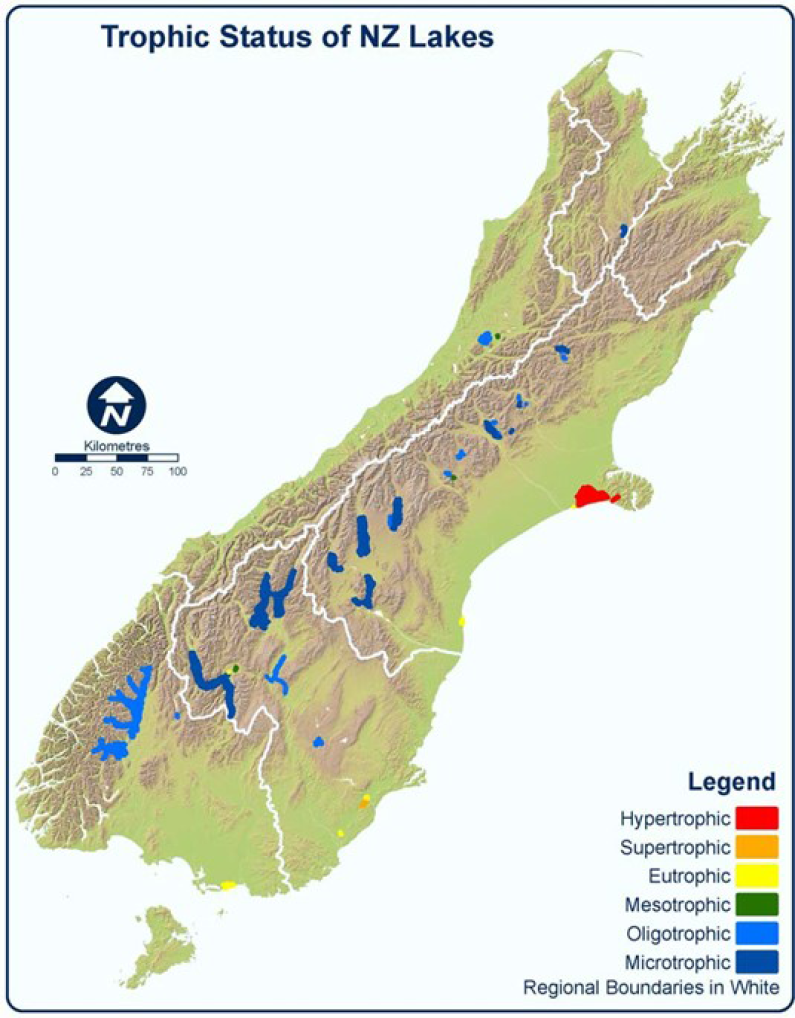
A summary of trophic state for New Zealand lakes is shown in Tables 3 and 4; lake specific information is in Appendix 1. The trophic level of New Zealand lakes is mapped in Figures 6 and 7. For display purposes, a buffer has been placed around each lake so that they appear larger then they are in reality.
There is a relatively even spread of lakes in each trophic type with about half of the 134 lakes monitored being eutrophic or worse. The monitored lakes with the best water quality (ie, microtrophic) are all in the South Island, reflecting their depth and fewer land-use pressures. In the South Island, the two most pristine lakes are Lake Tekapo and Lake Coleridge in the Canterbury high country. In the North Island, the lakes with the best water quality (ie, oligotrophic or better) are Lake Taupo, four Rotorua lakes (Lake Okatina, Lake Rotoma, Lake Tarawera and Lake Tikitapu) and two dune lakes in Northland (Lake Taharoa and Lake Waikere).
The most eutrophic lakes (ie, hypertrophic) are eight shallow lakes in the Waikato region (eg, Lake Hakanoa and Mangakawhere), several dune lakes in Northland (Lake Omapere, Kapoai, Rotokawau and Waiporohita) and Auckland (Lake Specticle), and two coastal lagoons in Canterbury (Lake Ellesmere/Te Waihora and Forsyth/Te Wairewa).
The trophic status of a lake is strongly related to depth. This is illustrated in Figure 5 which graphs the percentage of lakes in each trophic category that are either deep (>10 metres deep) or shallow (<10 metres deep). This shows that the more eutrophic lakes (ie, with a higher TLI) are more commonly shallow lakes and that the more pristine lakes are more commonly deep lakes. The association with depth corresponds with shallow lakes being both naturally more eutrophic and having less capacity to absorb incoming nutrient loads due to their smaller volume.
Table 3: Trophic state assessed using the TLI for each region
|
Regional council |
Impacted – Pristine |
Total |
|||||
|---|---|---|---|---|---|---|---|
|
Hyper-trophic |
Super-trophic |
Eutrophic |
Meso-trophic |
Oligo-trophic |
Micro-trophic |
||
|
Auckland |
1 |
1 |
4 |
1 |
7 |
||
|
Bay of Plenty |
1 | 3 |
4 |
4 |
|
12 |
|
|
Canterbury |
2 |
2 |
1 | 12* | 9* |
26 |
|
|
Chatham Islands |
2* | 6* |
|
2* |
10 |
||
|
Gisborne District |
|
|
|
0# |
|||
|
Greater Wellington |
1 |
|
|
|
|
1 |
|
|
Hawke’s Bay |
|
|
|
1 |
|
1## |
|
|
Manawatu-Wanganui |
1* |
1 |
2 |
||||
|
Northland |
5* |
26* |
9* | 2* |
42## |
||
|
Otago |
|
1 |
3* |
1* |
2* |
3* |
10 |
|
Southland |
|
|
1 |
|
3* |
|
4 |
|
Taranaki |
1 |
1 |
|||||
|
Tasman District |
1 |
1## |
|||||
|
Waikato |
8 |
2* |
4 |
1 |
15 |
||
|
West Coast |
1 |
1 |
2## |
||||
|
Total |
18 |
13 |
44 |
21 |
25 |
13 |
134 |
|
Total perecent |
13% |
10% |
33% |
16% |
19% |
10% |
|
Note:
- ‘*’ indicates that a modified version of the TLI or a limited data set was used to calculate the TLI for one or more of the lakes.
- # There is a long record of water quality monitoring of Ratahi Lagoon by Gisborne District Council, however the parameters measured do not correspond well with those needed to assess TLI.
- ## These numbers include past monitoring that has identified the trophic status of additional lakes in some regions. In Northland, 12 additional lakes were assessed in a survey. Lakes previously monitored by the New Zealand Lake Monitoring Programme (NZLMP) are Lake Taharoa (Waikato), Lake Dudding (Manawatu/Wanganui), Lake Tutira (Hawke’s Bay), Lake Rotoiti (Tasman district) and the Lady Lake (West Coast).
Table 4: Trophic state assessed using the TLI for each lake type
|
Lake type |
Impacted – Pristine |
Total |
|||||
|---|---|---|---|---|---|---|---|
|
Hyper-trophic |
Super-trophic |
Eutrophic |
Meso-trophic |
Oligo-trophic |
Micro-trophic |
||
|
Dune |
5* |
2* |
24* |
10* |
2* |
43 |
|
|
Glacial |
2* |
12* |
10* |
24 |
|||
|
Lagoon |
2 |
3 |
5 |
||||
|
Landslide |
1 |
1 |
2 |
||||
|
Peat |
5 |
1* |
4 |
10 |
|||
|
Reservoir |
4 |
1 |
1* |
1* |
7 |
||
|
Riverine |
3 |
3 |
1 |
1 |
8 |
||
|
Volcanic |
1 |
1 |
5 |
4 |
5 |
16 |
|
|
nd |
2* |
6* |
2 |
3 |
4* |
2 |
19 |
|
Total |
18 |
13 |
44 |
21 |
24 |
14 |
134 |
Note:
- ‘*’ indicates that a modified version of the TLI or a limited data set was used for one or more of the lakes.
- nd = lake type is not determined.
Figure 5: Percentage of lakes in each trophic category that are deep (> 10m) or shallow (< 10m)
Figure 6: Trophic status of New Zealand lakes – North Island
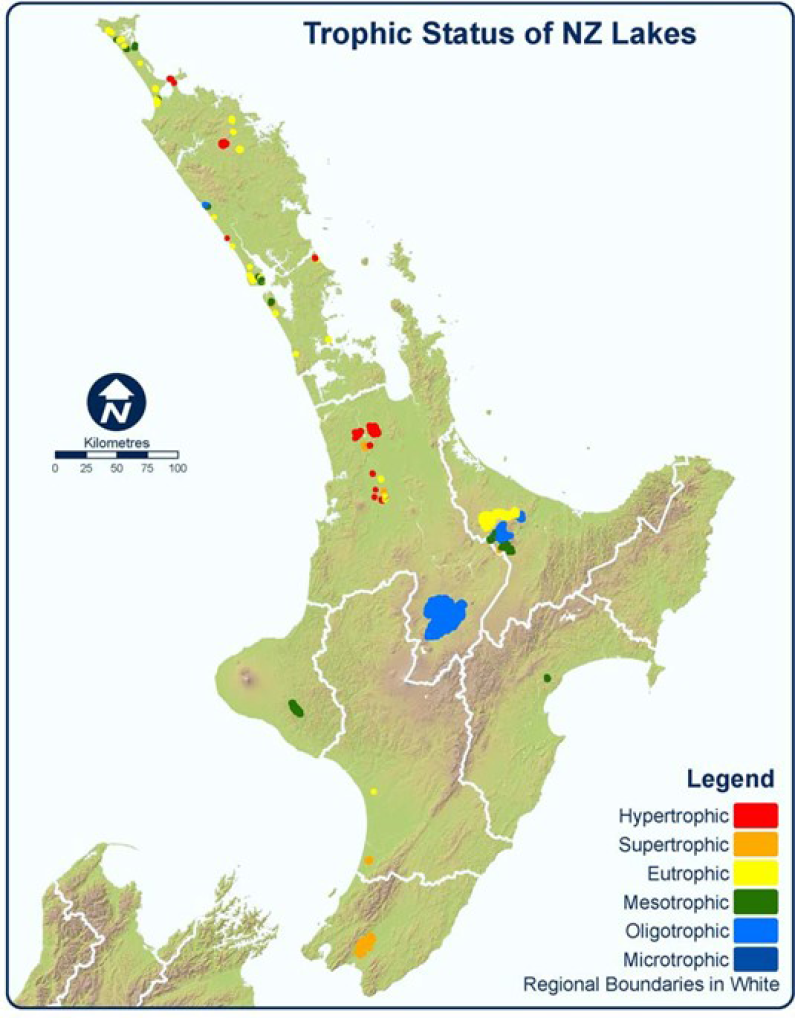
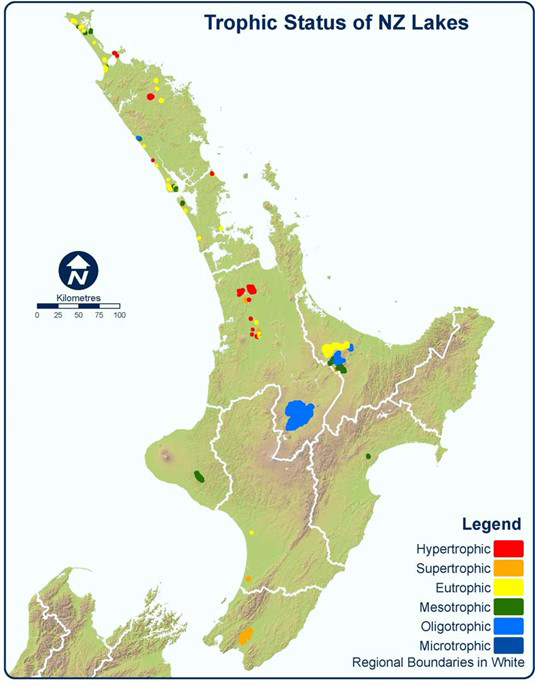
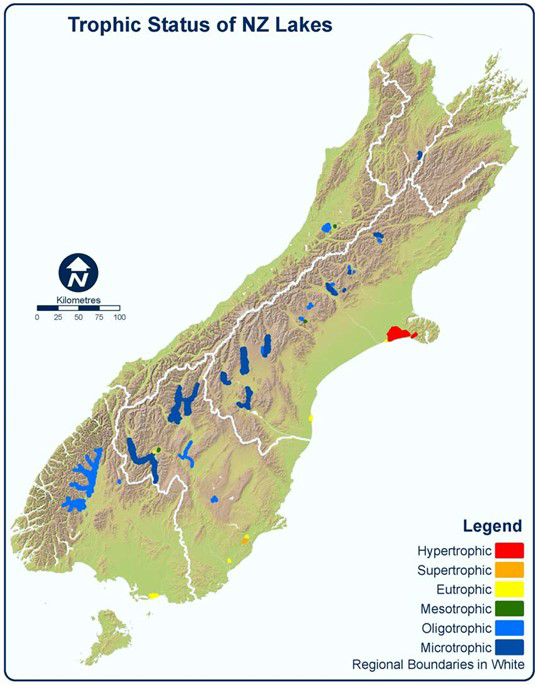
Figure 7: Trophic status of New Zealand lakes – South Island
4.2 Ecological condition (LakeSPI)
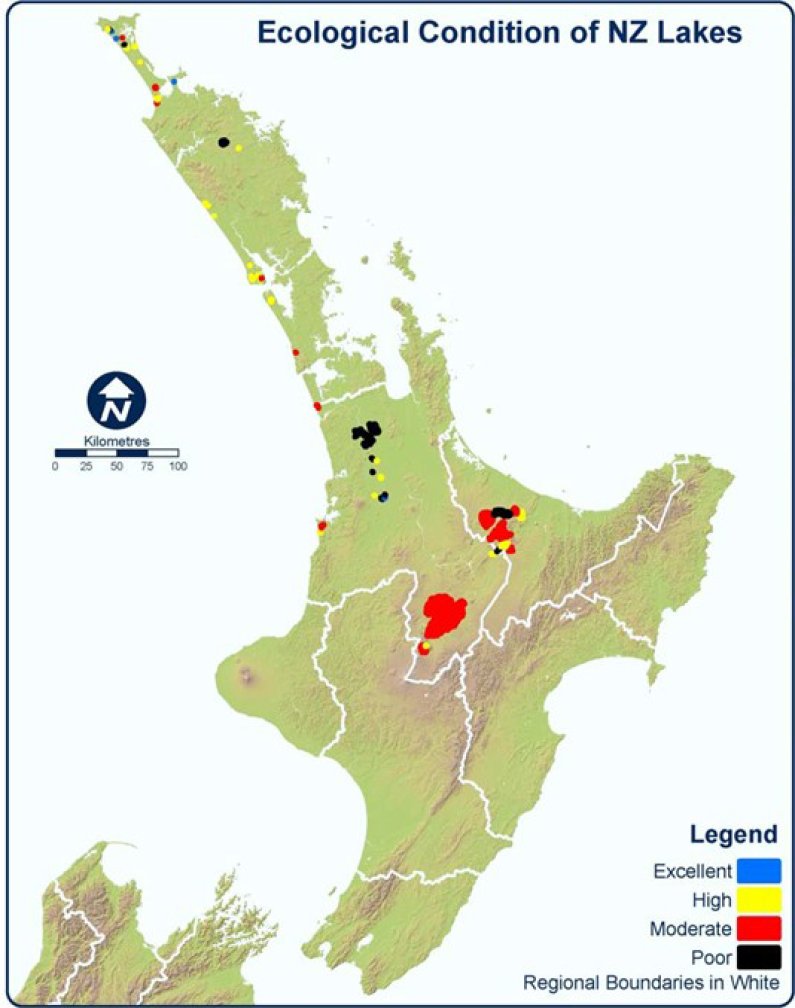
Ecological condition was assessed using LakeSPI for 76 lakes. These lakes are all within the Northland, Auckland, Waikato and the Bay of Plenty regions. There are 14 lakes in the Northland region where LakeSPI is assessed but was not available for this survey. For the purpose of this report, ecological condition is categorised into four levels corresponding to the following LakeSPI scores. The four levels are:
- 'Excellent' >85%
- 'High' 50-85%
- 'Moderate' 20-50%
- 'Poor' <20%.
A summary of ecological condition based on LakeSPI is shown in Tables 5 and 6 and mapped in Figure 8. For display purposes, a buffer has been placed around the lakes so they appear larger than in reality. Few lakes were in the excellent category, but lakes were spread evenly over the other categories. The six lakes with excellent ecological condition are the Northland dune lakes - Kuhuparere, Pretty, Waiporohita, and Te Paki - and the Waikato peat lakes - Rotopiko east and Rotopiko north. The trophic state of these lakes ranges from mesotrophic (ie, Lake Pretty) to hypertrophic (ie, Lake Waipophita).
There is no clear relationship between ecological condition and lake type. Neither does there appear to be any clear relationship between ecological condition and lake depth. [The number of deep and shallow lakes in each category are respectively: excellent (0 and 6), high (12 and 14), moderate (12 and 11), poor (2 and 19).] This probably reflects the fact that many of the factors affecting ecological condition, such as exotic (invasive) plants and exotic fish, can impact on any lake.
From the information available, no strong relationship can be observed between ecological condition and trophic state. Lakes with 'poor' ecological condition correspond to trophic states of eutrophic or worse, however lakes with 'excellent' and 'high' ecological condition have a wide range of trophic states. This is not surprising as the two indices (LakeSPI and the TLI) measure different aspects of lake health. A correlation might be expected between water clarity (secchi depth) and maximum depth of plants, but past studies have found no obvious link between eutrophication and the potential for invasion by introduced plants (Hughes 1976) - which forms a major component of the overall LakeSPI score.
Table 5: Ecological condition assessed using LakeSPI for each region
|
Regional council |
Excellent |
High |
Moderate |
Poor |
Total |
|---|---|---|---|---|---|
|
Bay of Plenty |
2 |
8 |
2 |
12 |
|
|
Northland |
4 |
15 |
7 |
3 |
29 |
|
Auckland |
1 |
1 |
2 |
||
|
Waikato |
2 |
8 |
7 |
16 |
33 |
|
Total |
6 |
26 |
23 |
21 |
76 |
Table 6: Ecological condition assessed using LakeSPI for each lake type
|
Lake type |
Excellent |
High |
Moderate |
Poor |
Total |
|---|---|---|---|---|---|
|
Dune |
4 |
16 |
11 |
2 |
33 |
|
Glacial |
0 |
||||
|
Lagoon |
0 |
||||
|
Landslide |
1 |
1 |
|||
|
nd |
0 |
||||
|
Peat |
2 |
4 |
6 |
12 |
|
|
Reservoir |
1 |
1 |
2 |
||
|
Riverine |
9 |
9 |
|||
|
Volcanic |
5 |
10 |
4 |
19 |
|
|
Total |
6 |
27 |
22 |
21 |
76 |
Figure 8: Ecological condition (LakeSPI) of New Zealand lakes
4.3 Trends
4.3.1 Changes in trophic state of New Zealand lakes
Information on trends in trophic state is available for 70 lakes. This report has not analysed data but has instead relied on results from published reports. Where water quality trends have not been assessed by councils, it was usually because the length of record was too short.
Changes in trophic state are identified in this report based on the results of trend analysis from published reports (primarily using methods in Burns et al (2000)) or, where these were not available, from changes in the reported trophic state since the New Zealand Lake Monitoring Programme (NZLMP) (Burns and Rutherford 1998). The trends identified by this report are for the most recent period of reporting, typically 1995-2002, but the precise period was different for each lake and region. Consequently, caution is needed when comparing the results across different lakes.
Furthermore, these trends only show past changes and can not automatically be used to extrapolate future changes. It is worth noting that the water quality of some lakes can fluctuate over time, for example, in many shallow lakes water quality changes in response to changes in the macrophytes community.
A summary of trends in trophic state for New Zealand lakes is shown in Tables 7 and 8 and in Figures 9 and 10. For display purposes, the lakes on the map have been buffered so they appear larger than in reality. On a national scale, there are more lakes with improving quality than declining quality. Most of the lakes with improving water quality are in the Canterbury high country [Note that information on water quality trends for Canterbury lakes is based on changes in reported trophic state over the lake over 10 years rather than on a comprehensive trend analysis of the data.] which, as previously reported, already has near pristine water quality.
The lakes with declining water quality are: Lake Ngatu, Lake Omapere and Lake Rotokawau West in Northland; Lake Spectacle and Lake Ototoa in Auckland; Lake Rotomanuka South, Lake Waikare and Lake Whangape in the Waikato; Lake Okataina, Lake Rotoiti and Lake Tikitapu (in the Bay of Plenty); and Lake Brunner on the West Coast. Recent monitoring data suggest that water quality is also deteriorating in Lake Taupo (in the central North Island).
Table 7: Changes in trophic state for each region
|
Regional council |
Declining quality |
No change |
Improving quality |
Total |
|---|---|---|---|---|
|
Auckland |
2 |
3 |
2 |
7 |
|
Bay of Plenty |
3 |
6 |
3 |
12 |
|
Canterbury |
8* |
12* |
20 |
|
|
Chatham Islands |
|
0 |
||
|
Gisborne District |
0 |
|||
|
Greater Wellington |
|
1# |
1 |
|
|
Hawke’s Bay |
0 |
|||
|
Manawatu-Wanganui |
|
|
|
0 |
|
Northland |
3* |
6* |
3* |
12 |
|
Otago |
|
2 |
|
2 |
|
Southland |
|
3* |
|
3 |
|
Taranaki |
1 |
|
1 |
|
|
Tasman District |
0 |
|||
|
Waikato |
4* | 5 |
2* |
11 |
|
West Coast |
1 |
1 |
||
|
Total |
13 |
34 |
23 |
70
|
|
Total percentage |
19% |
48% |
33% |
Note:
- ‘*’ indicates that the trend in one or more of the lakes was based on a change in trophic level compared with previous monitoring rather than on a comprehensive trend analysis such as described in Burns et al (2000).
- # Greater Wellington Regional Council report that improvements in key water quality parameters are slight for this lake (Lake Wairarapa). Rates of changes in water quality parameters are slow and likely to have little biological significance.
Table 8: Changes in trophic state for each lake type
|
Lake type |
Declining quality |
No change |
Improving quality |
Total |
|---|---|---|---|---|
|
Dune |
4* |
6* |
4* |
14 |
|
Glacial |
1 |
8* |
6 |
15 |
|
Lagoon |
2 |
2 |
||
|
Landslide |
1 |
1 |
||
|
Peat |
1 |
4 |
2 |
7 |
|
Reservoir |
2* |
1 |
3 |
|
|
Riverine |
2 |
4* |
1 |
7 |
|
Volcanic |
5 |
7 |
3 |
15 |
|
nd |
6 |
6 |
||
|
Total |
13 |
34 |
23 |
70 |
4.3.2 Changes in lake ecological condition
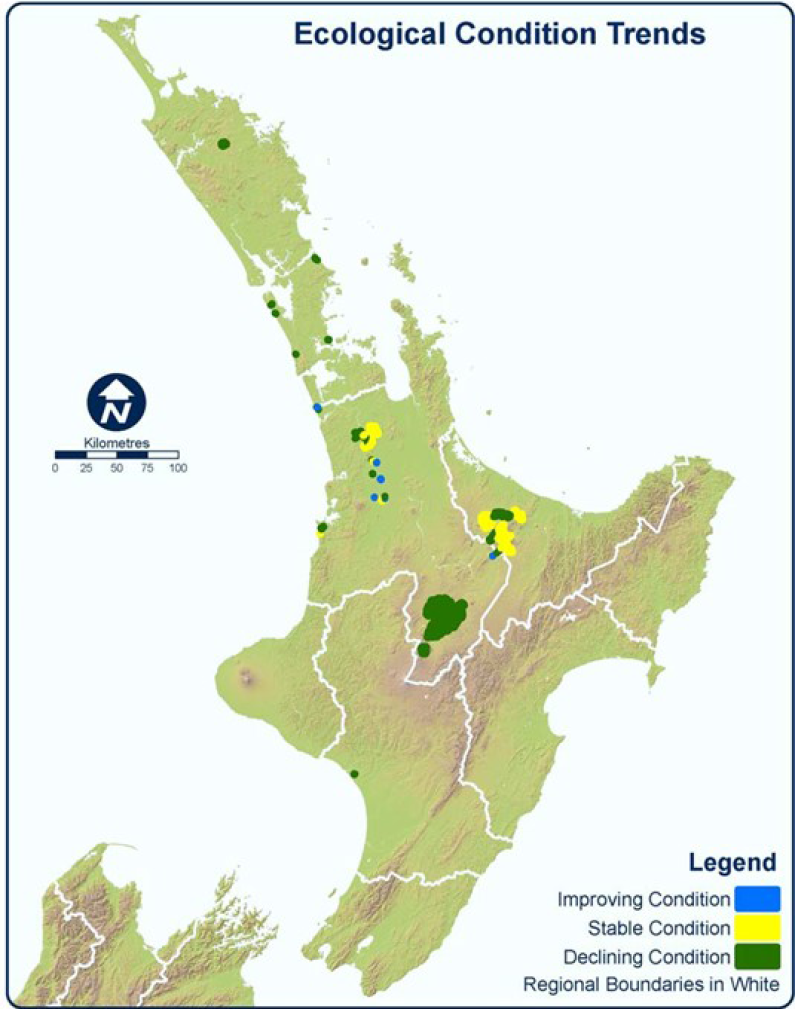
Information on changes in ecological condition (LakeSPI) is available for 44 lakes. A summary of these changes is shown in Table 9 and in Figure 11. The figures are based on LakeSPI surveys done by NIWA for Environment Waikato and for Environment Bay of Plenty (Edwards et al 2005; Scholes and Bloxham 2005). We did not interpret changes from macrophyte surveys in Auckland lakes [Note that Auckland Regional Council has LakeSPI scores for Lake Wainamu (calculated on four occasions), however, this data has not been published.] (Gibbs et al 1999) and changes in ecological condition were not determined with LakeSPI assessments for Northland lakes. For this report, a trend was reported if there was a change of more than five percent in the LakeSPI score compared to previous surveys. The time period between surveys differs for each lake and typically ranges from five to 20 years.
In the Waikato and Bay of Plenty, there are greater declines in ecological condition than in water quality. Almost half the lakes (45%) show a decline in their ecological condition compared to previous surveys. In contrast, about a third of the lakes in the Waikato and Bay of Plenty show a decline in water quality. This worsening of ecological condition may reflect the expansion of exotic (invasive) plants and exotic fish into many lakes. For example, an invasion of hornwort was responsible for the decline in LakeSPI in Lake Tarawera.
No significant correlation was found between trends in TLI and trends in the LakeSPI. [The cumulative binomial distribution probability of 0.9 was calculated for trends from TLI and from LakeSPI. For the 21 lakes with trend information for both TLI and LakeSPI, 13 lakes showed the same trend (improving, declining or no change) for both index.] This is not surprising because the trends for each index are based on different time periods (LakeSPI generally having a longer period), the sample size was small and past studies have found no obvious link between eutrophication and the potential for invasion by introduced plants (Hughes 1976). Nevertheless, a collapse of macrophyte populations in shallow lakes is typically followed by deterioration in water quality which improves again after macrophytes re-establish. In Lake Whangape, macrophytes collapsed in 1987 and there was a corresponding decline in water quality. Water quality improved as macrophytes re-established again in the mid-1990s. The pattern has been repeated more recently with the collapse of macrophytes in Lake Rotokauri and Lake Rotomanuka (Waikato) in 1996/97 and Lake Omapere (Northland) in 2000. Some lakes are also returning to more stable macrophyte dominated state, for example, native macrophytes are re-establishing in Lake Rotorua (Hamilton) and the water quality is improving.
Table 9: Changes in ecological condition as assessed by LakeSPI by lake types
|
Lake type |
Declining condition |
Stable |
Improving condition |
Total |
|---|---|---|---|---|
|
Dune |
4 |
2 |
6 |
|
|
Glacial |
||||
|
Lagoon |
||||
|
Landslide |
||||
|
Peat |
3 |
3 |
5 |
11 |
|
Reservoir |
||||
|
Riverine |
3 |
6 |
9 |
|
|
Volcanic |
10 |
7 |
1 |
18 |
|
Total |
20 |
16 |
8 |
44 |
|
Total percentage |
45% |
36% |
20% |
Figure 9: Changes in water quality of New Zealand lakes
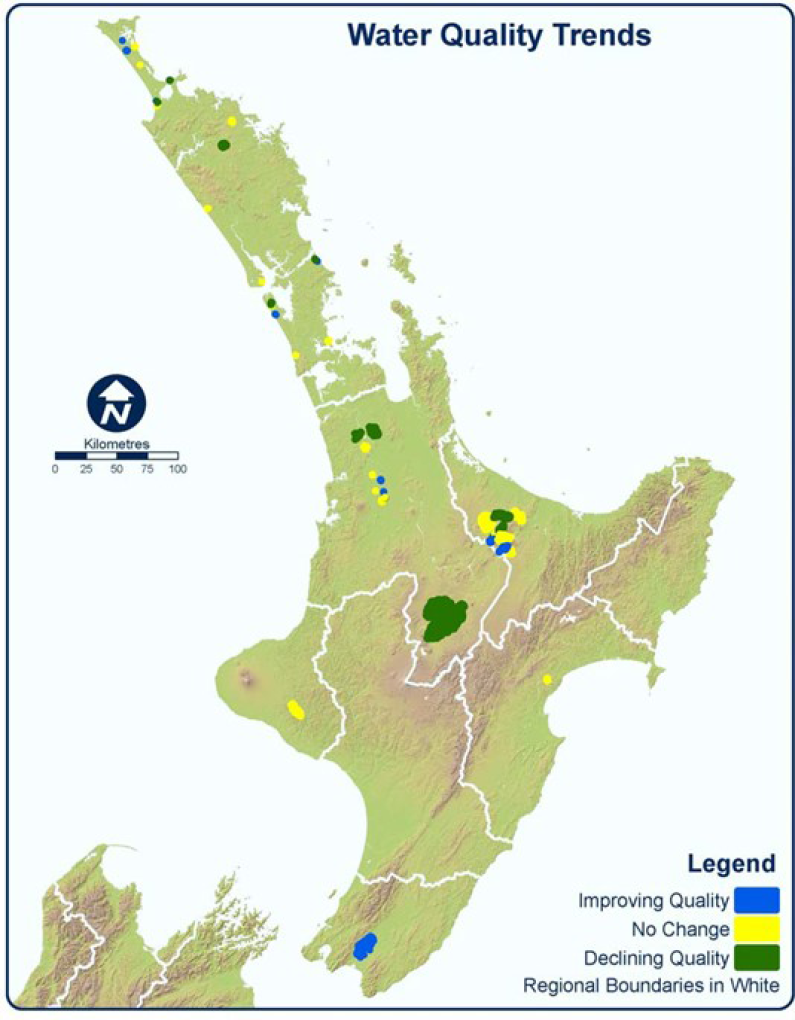
Figure 10: Changes in water quality of New Zealand lakes
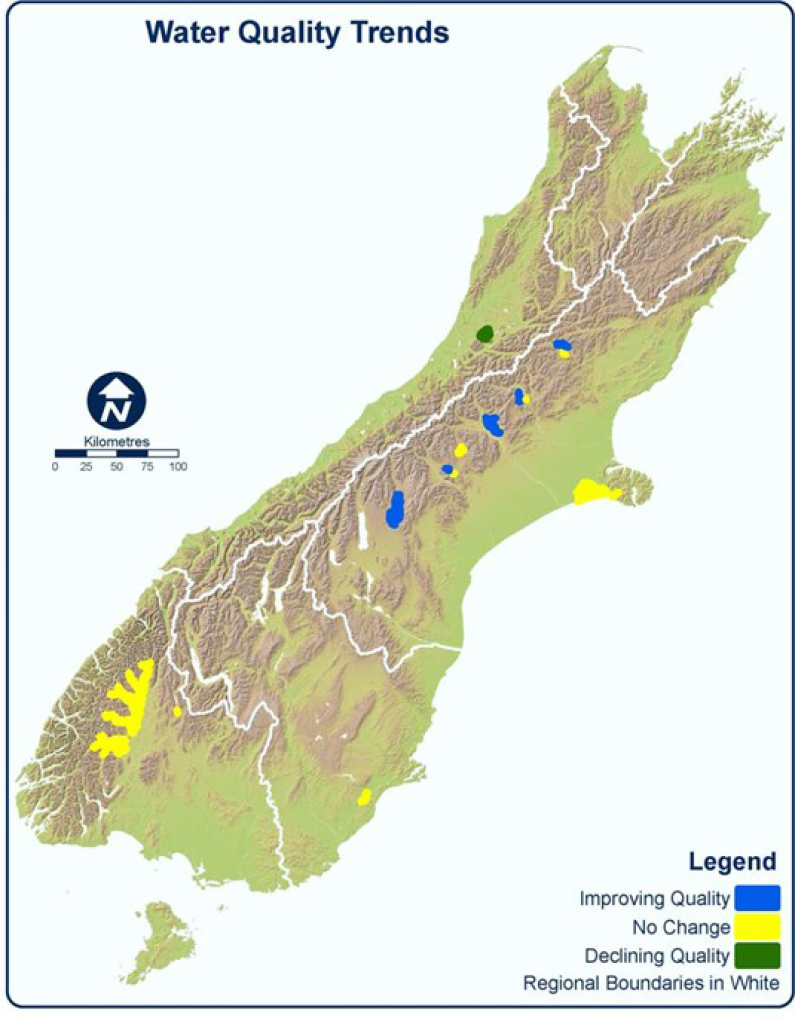
Figure 11: Changes in ecological condition of North Island lakes
4.4 Pressures on lake water quality
The monitoring programmes and reports from regional councils have identified a number of key pressures on lake water quality. These are:
- invasive plants
- exotic fish
- increased sediment and nutrient loadings
- drainage and the lowering of water levels.
Controlling the loads of sediment and nutrients entering lakes is a universal concern for lake managers in New Zealand and a key to preventing and reducing algae blooms. External nutrient loads of both nitrogen and phosphorus are a concern for eutrophication of lakes, however, lakes differ as to which particular nutrient limits phytoplankton growth. Nitrogen is typically limiting in lakes on the central volcanic plateau and Rotorua lakes because the pumice soils are naturally high in phosphorus. Phosphorus, or both phosphorus and nitrogen, tend to be the limiting nutrient in many other parts of the country (eg, Canterbury high-country lakes).
This survey found only two lakes that receive a direct effluent discharge, Ratahi Lagoon on the East Coast and Lake Waikare in the Waikato. Effluent discharges to Lake Horowhenua and Lake Rotorua stopped many years ago but their impacts are still being felt as nutrients are internally recycled within the lakes.
A more extensive problem being tackled by councils is the control of contaminants from diffuse pollution entering lakes directly or via rivers. Diffuse pollution can be difficult to define but for the purposes of this report it refers to pollution arising from land-use activities which are dispersed across a catchment and do not arise from municipal sewage or process effluents. Some examples of diffuse pollution sources include application of fertiliser and pesticides to farmland and forestry, road surface runoff, soil erosion, septic tanks, organic waste applied to farmland, effluent from farm stock, and surface water outfalls from field drains.
Controlling diffuse pollution is a major focus of the Rotorua Lakes Protection and Restoration Programme. There is some concern about the possible impact of on-site wastewater treatment systems from communities around some Canterbury high-country lakes (Lake Alexandrina and Lake Clearwater) and around some Central Otago lakes (eg, Lake Hayes). Protecting the lake margins from direct run-off and from stock access is a key first step in controlling diffuse pollution. These measures have shown positive results in Lake Emma (Canterbury).
Lowering of water levels and drainage of surrounding land is a major issue for many lakes. Lowered water levels due to drainage are a particular concern for peat lakes and in many lagoons water levels are managed by opening to the sea. This year, there was also concern about the dry summer causing many lakes in the Canterbury high country to be about half their normal water levels with potential impacts on lake ecology.
5.1 Lake monitoring
This survey identified that 13 of the 17 regional authorities in New Zealand currently monitor 153 lakes for various indices and analyses including trophic status, ecological condition and/or cyanobacteria through bathing beach monitoring programmes. State of Environment monitoring programmes assessed trophic status in 119 lakes and ecological condition in 86 lakes. The number of lakes monitored by regional councils is increasing. Prior to 2000, about 87 lakes were being monitored (68 for trophic status). Since then, lake water quality monitoring has been initiated in Northland, Southland and the Chatham Islands and extended in other regions.
The New Zealand protocols for monitoring lakes and reservoirs (Burns et al 2000) is widely used throughout New Zealand as a tool for monitoring and reporting lake water quality. However, resourcing constrains the way lakes are monitored and which lakes are monitored by councils. For example, Canterbury Regional Council has chosen to monitor water quality at a large number of high-country lakes by taking surface grab samples rather than applying the more intensive method in the protocol to fewer lakes. Similarly, up until recently many of the lakes monitored by Otago Regional Council involved samples from the lake outlet as part of the river monitoring programme. While sampling methods differ, in many cases a modified version of the TLI can still be calculated for the sake of national reporting, although some caution is needed in interpreting the results.
Most of New Zealand's large lakes are monitored but it is clear that a considerable number of smaller lakes are not being monitored. While it is not feasible to monitor all these small lakes, it is important that a representative number are monitored on an ongoing basis. There are a range of reasons why some lakes may not be monitored; these include:
- a lack of land-use/pollution pressures not warranting an investment in monitoring programmes
- the fact that some lakes are already in poor condition and no further monitoring investment is necessary to ascertain their condition
- some lakes are considered too small or to have too few values or uses to be monitored
- regional councils prioritising their resources for monitoring.
Some further work would be required to address key issues identified by this report, in particular how do lake monitoring networks compare with the values and management objectives set for lakes in the planning process? If lakes are not monitored is there monitoring of the river entering or leaving them? Does the national monitoring network cover a full range of lake types and pressures? This last question may be best addressed using the multivariate classification system being developed by NIWA and the Department of Conservation.
LakeSPI (Clayton et al 2002) is a recent tool offering considerable value to monitor and report on ecological condition; it is also gaining wide acceptance in New Zealand. Its use by regional councils is currently limited to Northland, Waikato and the Bay of Plenty However, some councils have plans to initiate LakeSPI monitoring in the future. As a result, there is likely to be an increase in the types of lakes being monitored for ecological condition - perhaps extending to glacial lakes or lagoons.
5.2 Reporting of results
There are few targets or reference conditions for reporting lake water quality on a national scale. This is more of an issue for reporting water quality than ecological condition. The LakeSPI scores can be adjusted for lake depth which overcomes a major source of variability between different lakes and allows more accurate comparison of lakes. The TLI, on the other hand, provides a good measure of trophic state but does not provide management targets or adjustments for naturally eutrophic lakes. It is an excellent tool for managing lakes and reporting on individual lakes but there are difficulties with national reporting because some lakes are naturally eutrophic even without human pressures. This was partially illustrated earlier in the report by the correlation between trophic status and lake depth. Similarly, trophic state and ecological condition do not necessarily correlate; Lake Rotopiko North is eutrophic but has one of the best LakeSPI scores in the Waikato. Eutrophication will be a key issue to address for a number of important lakes and it would be helpful to have realistic targets to help water managers measure progress.
This issue of reporting against appropriate reference conditions may be partially addressed by current and future work on lake classification currently being undertaken by NIWA for the Department of Conservation. It potentially allows the classification of lakes according to physical attributes (eg, area, depth) and catchment attributes (eg, proportion of catchment in beach forest, glaciers, peat, pasture, geology with high phosphorus, etc). These, and other attributes, affect the clarity and nutrient levels that a lake can naturally and realistically attain.
An alternative approach to reporting on trophic state would be to report on the suitability of lake water quality for different uses. This is done when reporting the results of bathing beach monitoring and there are clear guidelines for acceptable levels of faecal indicator bacteria and cyanobacteria for contact recreation. Using this approach, the targets would relate to achievement of guidelines for intended uses of the lake and may be identified through the planning process.
Regional authorities have a fundamental role in identifying values and setting goals for water management. Targets for lake management are generally set on a regional or catchment scale through regional plans or strategies for specific lakes (eg, Rotorua lakes protection and restoration programme, Protecting Lake Taupo Strategy), and it may be appropriate to use these targets for reporting on a national scale. This would require reviewing the approaches to managing lake water quality and condition, collating the regional, catchment and lake-specific targets set for lakes and, if possible, using these targets to report current condition.
When reporting on the State of the Environment (SoE) it would also be valuable to gain a better understanding of the response to monitoring results. To what extent are the results of SoE monitoring feeding back into the planning process (particularly regarding management of lakes with declining quality)? Is SoE monitoring providing sufficient information for the planning process, and are planning mechanisms responding to the results of SoE monitoring? These questions would need to be addressed in a separate review.
Finally, it became clear while undertaking this work that there is a considerable amount of new information available on New Zealand lakes, but it is distributed amongst many organisations around the country and not all of it is published. This information would be much more accessible if summarised in a single location such as an updated version of the Inventory of New Zealand Lakes produced in 1986 by Livingston et al (1986).
This report and discussion has highlighted several areas where further work could be undertaken or advanced to improve the monitoring, reporting and management of New Zealand lakes. These are:
- identify specific gaps in the monitoring network by using the NIWA/DoC multivariate classification system to classify lakes according to types and pressures
- develop reference conditions for trophic status or appropriate management objectives for different lake types
- review lake management objectives set in regional plans and report the results of lake monitoring against these objectives nationally. Many councils have begun this review process
- review the integration of lake monitoring and regional plans - is monitoring addressing the appropriate questions and are the results feeding back into the planning process? Again, many councils have begun this process
- update the 1986 version of the Inventory of New Zealand Lakes which was produced in 1986 to allow a more comprehensive understanding of information available on lake water quality around New Zealand.
Appendix 1: Summary of Council Monitoring Programmes
Table 10: Lake water quality monitoring done by regional councils in 2006 – programme summary
| Region | Number of lakes monitored for: | Bathing beach with cyanobacteria | Typical frequency | Typical parameters monitored | Name of lakes regularly monitored | |
|---|---|---|---|---|---|---|
| SOE water quality | LakeSPI | |||||
| Northland Regional Council | 30 | 39 | 2 | Quarterly | Temperature, DO, EC, secchi depth, SS, Chl a, pH, TN, TP, SS, VSS, and phytoplankton identification, DO-temperature profile. | Lake Carrot, Heather, Morehurehu, Ngapua, Ngakeketa, Ngakeketa north, Ngatu, Rotokawau, Rotoroa, Te Kahika, Te Paki dune, Wahakari, Waihopo, Waipara, Waiparera, Waiporohita, Kai iwi, Midgeley, Taharoa, Waikere, Humuhumu, Kahuparere, Kanono, Kapoai, Karaka, Mokeno, Rotokawau, Rototuna, Wainui, Lake Omapere. |
| Auckland Regional Council | 7 | 2 | 2* | Bimonthly | Temperature, pH, chloride, EC, turbidity, secchi depth, SS, BOD, NNN, NH4-N, TKN, TP, DRP, Chl a, DO-temperature profile, E. coli, phytoplankton count and identification, zooplankton. | Lake Ototoa, Pupuke, Tomarata, Wainamu, Kereta, Kuwakatai, Spectacle. |
| Environment Waikato | 15 (4 of which are on hold)** | 33 | 7 + 1 additional to SOE (also three Waikato hydro lakes) | Monthly. Bimonthly for Waahi, Waikare and Whangape | Secchi depth, TKN, TP, Chl a, NNN, NH4, DRP, EC, pH, DO, TOC, DIN, turbidity, SS, VSS, absorbency, phytoplankton count and identification, DO-temperature profile. Water level. |
Lake Taupo. Peat Lakes (Ngaroto, Rotokauri, Rotomanuka North, Rotomanuka South, Lake Rotoroa, Lake Mangakaware, Lake Rotopiko East, Rotopiko North). Riverine Lakes (Waahi, Waikare, Whangape, Lake Hakanoa, Lake Mangahia, Lake Maratoto). Also, bathing beach monitoring on Lake Kainui assesses cyanobacteria. |
| Environment Bay of Plenty | 12 | 12 | 7 | Monthly | EC, pH, secchi depth, TN, TP, TKN, NNN, Chl a, phytoplankton count and identification. Profiles of temperature-DOfluorescence-turbidity-radiation. Also assessment of koura and kakahi. | Lake Rotorua, Rotoiti, Okareka, Okaro, Rotoehu, Tarawera, Rotoma, Tikitapu, Okataina, Rotomahana, Rerewhakaaitu, Rotokakahi. |
| Taranaki Regional Council | 1 | 0 | 1 (additional to SoE) | 4 times per annum | EC, pH, turbidity, secchi depth, SS, NNN, NH4-N, TN, TKN, TP, DRP, Chl a, DO-temperature profile, benthic macroinvertebrates, phytoplankton scan and identification. E.Coli is measured at Lake Rotomanu only as part of the annual bathing beach survey). | Lake Rotorangi, Lake Rotomanu (bathing beach monitoring). |
| Gisborne District Council | 1 | 0 | 0 | Bimonthly | Turbidity, ammonia, sulphate, DRP, BOD, total and calcium hardness, chloride, sodium, potassium, suspended solids, faecal coliforms, Enterococci, pH, DO. | Ratahi Lagoon. |
| Hawke’s Bay Regional Council | 0 (8 starting September 2006) | 0 | 0 | Monthly | n/a | Lake Kaweka (year 1, 2), Runanga, Oingo (year 3, 4), Opouahi, Rotonuiaha, Tutira (year 5, 6), Waikaremoana, Waikareiti (year 7, 8). |
| Horizons Manawatu-Wanganui Regional Council | 1 | 0# | 4 (3 additional) | Monthly | Temperature, DO, pH, EC, Chl-a, NNN, NH4-N, TN, TP, DRP, turbidity, secchi depth, E. coli. | Lake Horowhenua (SoE monitoring and bathing beach monitoring), Lake Pauri, Lake Wiritoa and Lake Dudding (bathing beach monitoring). |
| Greater Wellington Regional Council | 1 | 0 | 0* | Quarterly | Temperature, pH, EC, DO, turbidity, SS, VSS, NNN, NH4-N, TKN, TP, DRP, Chl a, secchi depth, faecal coliform. | Lake Wairarapa. |
| Marlborough District Council | 0 | 0 | 0 | n/a | n/a | n/a |
| Nelson City Council | 0 | 0 | 0 | n/a | n/a | n/a |
| Tasman District Council | 0 | 0 | 0 | n/a | n/a | n/a |
|
Environment Canterbury High country |
22 | 0 | 0* | Monthly December–April | TN, TP, Chl a, NNN, NH4, DRP,phytoplankton taxa. Also for lowland lakes: (SS, DO salinity, temperature,secchi depth). | High country: Lake Sumner, Loch Katrine, Taylor, Pearson, Sarah, Grasmere, Hawdon, Lyndon, Georgina, Selfe, Ida, Coleridge, Heron, Clearwater, Camp, Emma, Tekapo, Alexandrina, Pukaki, Ohau, Benmore. |
|
Environment Canterbury Lowland |
4 | 0 | 0 | Monthly and fortnightly | Lowland: Lake Ellesmere/Te Waihora, Lake Forsyth/Te Wairewa, Coopers Lagoon, Wainono Lagoon. | |
| West Coast Regional Council | 1 | 0 | 0* | Quarterly | TN, TP, Chl a, NNN, NH4, DRP, DO-temperature profile, secchi depth. | Lake Brunner (Lake Kaniere for bathing beach only). |
| Otago Regional Council | 10 | 0 | 0* | Bimonthly and monthly | TN, TP, NNN, NH4-N, DRP, EC, pH, DO, Chl-a, secchi depth, DO-temperature profiles, E. coli bacteria. | Lake Waipori, Waihola, Hayes, Johnson, Onslow, Wakatipu, Wanaka, Hawea, Tuakitoto, Dunstan. |
| Environment Southland | 4 | 0 | 0* | Monthly | EC, pH, Chl-a, NNN, NH4-N, TN, TP, DRP, turbidity, VSS, TSS, secchi depth, DO-temperature profiles. | Lake Te Anau, Lake Manapouri, Waituna Lagoon. Mavora Lake South (outlet sampled as part of river monitoring network). |
| Chatham Islands Council (monitored on behalf by Environment Canterbury) | 10 | 0 | 0 | Quarterly | Black disc, TN, TP, Chl-a, NNN, NH4, DRP, EC, pH, DO, TOC, DIN, TON, sulphate. | Lake Tennants, Kaingarahu, Rangitai, Wharemanu, Huro, Causeway, Te Wapu, Koomutu, TeRoto, Marakapia. |
| Total | 119 | 84 | 23 | |||
* There are additional lakes monitored for bathing beach water quality but without sampling for cyanobacteria.
** Environment Waikato also monitors the Waikato hydroelectric lakes downstream of the tailraces as part of its river water quality monitoring network.
# Four additional lakes have been surveyed for macrophytes prior to the development of LakeSPI.
Table 11: Lake water quality monitoring done by regional councils in 2006 – programme description
| Region | Monitoring programmes | Possible changes to monitoring | Reference |
|---|---|---|---|
| Northland Regional Council |
Northland Regional Council contracted NIWA to assess the status of 65 lakes during 2004-2005. Information was collected on macrophytes using LakeSPI, water quality, birds, fish and invertebrates. LakeSPI was used on all 65 lakes, water quality samples were collected from 37 lakes. 32 lakes were identified for further monitoring (water quality and LakeSPI) and 11 of these lakes identified for ongoing exotic plant surveillance. Samples have been collected quarterly at 32 lakes since December 2005 with the intention to identify possible seasonal trends and controlling factors. In addition, Lake Omapere is sampled monthly at two sites for water quality and cyanobacteria. Bathing beach monitoring is done at two lakes for E. coli and cyanobacteria. |
None planned. | Northland Regional Council (2005a), Northland Regional Council (2005b), Champion et al (2005). |
| Auckland Regional Council |
The current programme began in 1988 with the seven largest lakes sampled quarterly (except Lake Pupuke which is sampled six times per year and has water quality records back to 1966). Additional parameters were included in 1992. Samples are collected from the top and bottom waters at a single sample site located mid-lake along with measurement of DO-temperature profiles. Bathing beach monitoring is done at Lake Pupuke and Lake Wainamu (measuring E. coli and cyanobacteria) by Northshore CC and Waitakere CC respectively. |
Extend the use of LakeSPI beyond Lakes Ototoa and Wainamu. | Barnes and Burns (2006); Gibbs et al (1999); Auckland Regional Council 2005. |
| Environment Waikato |
Environment Waikato has 13 lakes in the shallow lakes monitoring programme. Water quality samples are collected monthly from a single site mid-lake except for lakes Waahi, Waikare and Whangape which are monitored every two months. The method is consistent with Burns et al (2002). In addition, Lake Rotoroa is monitored monthly by NIWA on behalf of Hamilton City Council. Monitoring is on hold at four of these lakes (Lake Mangahia, Lake Ngaroto, Lake Rotokauri and Lake Rotomanuka South) as there is sufficient data to determine their trophic status. Lake Taupo is monitored at three deep water sites every 2–3 weeks (top and bottom samples + DO-temperature profiles). There was a LakeSPI investigation and survey of 33 lakes in 2004/05 including a comparison with historical data. Bathing beach monitoring including cyanobacteria is undertaken at Lake Taupo and Lake Kainui. |
Possible review of shallow lake monitoring in 2006/07. | Barnes (2002), Edwards et al (2005), Gibbs (2005). |
| Environment Bay of Plenty |
EBOP monitor 12 lakes in the Rotorua district every month. Monitoring began between 1990 and 1994. Sample sites are located at the deepest basin of each lake and samples collected from the surface (integrated) and bottom (half hypolimnion depth + 1 m above bottom) to assess trophic status. Monthly profiles of: temperature, DO, EC, turbidity, fluorescence, and irradiance. The LakeSPI method is used to assess lake condition every second year. In addition, weekly summer monitoring is undertaken at bathing beaches to assess recreational water quality (E. coli and cyanobacteria). In 2006 monitoring also began to assess changes in koura and kakahi (freshwater mussels) in some lakes. Cyanobacteria also assessed in mid-lake stations since 2004. |
Extend koura and kakahi monitoring in 2006. Possibly extend the programme to smaller and hard to access lakes. | Scholes and Bloxham (2005). |
| Taranaki Regional Council |
Taranaki Regional Council has monitored water quality in Lake Rotorangi since 1984. Samples are collected from the surface and bottom at three sites four times per year. Bathing beach monitoring is undertaken at one site on Lake Rotomanu during the summer bathing season. Samples are scanned for cyanobacteria with cell counts where needed – there has never been sufficient densities to require further action. |
Additional cyanobacteria monitoring of three small recreational lakes is beginning in the 2006/07 summer (Lakes Ratapiko, Opunake and Rotokare). | Taranaki Regional Council (2005a), Taranaki Regional Council (2005b). |
| Gisborne District Council | Gisborne District Council has monitored water quality in Ratahi Lagoon (Te Puia springs) since 1980. Grab samples are collected bimonthly. | Three-yearly reviews. | |
| Hawke’s Bay Regional Council | No lakes are currently monitored, however lake monitoring will commence in September 2006. Eight lakes will be monitored on a rotational basis. | Initiate a lake monitoring programme in 2006, review in 2015. Monthly water quality samples for two years plus use of LakeSPI every four years. | Hawke’s Bay Regional Council (2006). |
| Horizons Manawatu-Wanganui RC |
Horizons MW have collected monthly water quality samples from Lake Horowhenua since 1998. Three sites in the lake are sampled and bulked into a single sample for analysis. Macrophyte monitoring was undertaken by NIWA on Lake Horowhenua, Lake Wiritoa, Lake Duddings and Pukepuke Lagoon in 2001 prior to development of LakeSPI. Bathing beach monitoring (measuring cyanobacteria) is undertaken weekly during the summer at Lakes Horowhenua, Lake Pauri, Lake Wiritoa and Lake Dudding. |
Will consider extending SoE monitoring to dune lakes. | Edwards and Clayton (2002). |
| Greater Wellington Regional Council |
Greater Wellington RC monitors Lake Wairarapa quarterly at four sites since 1994. A single sub-surface grab sample is taken at each location. Bathing beach monitoring is also undertaken at Lake Wairarapa but cyanobacteria are not measured. |
Possibly extend monitoring to include: Lake Pounui, Lake Onoke, Lake Kohangatera and/or Lake Kohangapiripiri. | Perrie (2005). |
| Marlborough District Council | No lakes are currently monitored by MDC. Lakes within the district are considered to have few pressures or threats to water quality and most are in the Conservation estate. | None planned. | |
| Nelson City Council | There are no natural lakes within the Nelson City Council boundary. | None planned. | |
| Tasman District Council |
No lakes are currently monitored by TDC but the surface water monitoring strategy is being reviewed. Lake Rotoiti was sampled by NIWA from February 1992 to June 1994 and there was some paleolimnological sampling of the Lake Rotoiti sediments by NIWA (2001–03). Cobb Lake was briefly monitored for a consent application in 2003 (see Cawthron for data). |
Possibly extend monitoring to include: Lake Rotoiti, Otuhie and the Kaihoka lakes. | |
| Environment Canterbury |
Environment Canterbury monitors water quality in four lowland coastal lakes. In Lake Ellesmere monthly surface samples are collected from four mid-lakes sites (since 1993). At Lake Forsyth, fortnightly lake edge samples are collected (since 1993). Monthly lake edge samples are collected from Wainono Lagoon and Coopers Lagoon (since 2000 and 2003 respectively). ECan monitors 21 high-country lakes five times per year during the summer (since December 2004). Surface samples are collected mid-lake using a helicopter. Samples are analysed for TN, TP, turbidity and Chl a. A subset of these lakes was previously sampled ad hoc since the early 1990s. Bathing beach monitoring is also undertaken on Lake Ellesmere (including cyanobacteria). |
None planned. | CRC (1996), Meredith (2004a), Meredith (2004b). |
| West Coast Regional Council |
Lake Brunner is monitored quarterly by NIWA on behalf of West Coast Regional Council (records since 1995). Bathing beach monitoring is undertaken during the summer on Lake Brunner and Lake Kaniere but cyanobacteria is not assessed. |
None planned. | Kelly (2006), WCRC (2005). |
| Otago Regional Council |
Otago Regional Council has monitored 10 lakes bimonthly at the lake margin or outlet since 1994. Monthly TLI monitoring is being phased in on a rotational basis for nine lakes: Lake Waihola and Lake Waipori, 2002–2005 (but also records from Otago University 1997–1998); Lakes Hayes, Johnson, Wakatipu, Wanaka and Onslow, December 2005–present. TLI monitoring is proposed for Lakes Mahinerangi and Tuakitoto in July 2007–2010. Lakes monitored for TLI (Wakatipu, Wanaka, Johnson, Hayes): a profile is taken and then the Burns et al (2000) protocol applied. Where samples are taken on that profile depends on lake stratification status. For Lakes Waihola and Waipori, a single top sample is taken. For Lake Onslow, samples are still from the outlet. In addition, samples are collected fortnightly from the outlet of Lake Hawea and Dunstan as part of the river SOE monitoring network. |
Phasing in the lake monitoring programme to include Lakes Mahinerangi and Tuakitoto in July 2007–2010. | Otago Regional Council (2005), Milne (2002). |
| Environment Southland |
Environment Southland collects monthly samples from Lake Te Anau, Lake Manapouri and Waituna Lagoon. Regular SoE monitoring began on Lake Te Anau in July 2000 and on Lake Manapouri in July 2002. Surface and bottom samples are collected from two sample locations on Lake Te Anau and three on Lake Manapouri (based on Burns et al (2000)). A single surface sample is collected from four sites on Waituna Lagoon (since 2002). Bathing beach monitoring is also done at Lake Te Anau and Lake Manapouri but cyanobacteria are not measured. A single sample and DO profile is collected from Lake George (D46:146 154). |
Regular reviews. | Environment Southland (2005). |
| Chatham Islands Council (monitored on behalf by Environment Canterbury) | Environment Canterbury, on behalf of Chatham Islands Council, has monitored Chatham Islands streams and lakes since April 2005. A single sample is collected from lake margins and analysed for TN, TP, DRP, NNN, NH4, Chla, turbidity and black disc. | Currently baseline assessment. May reduce for long-term depending on resources. | Meredith (2005). |
Appendix 2: Summary of Monitoring for Individual Lakes
|
Region |
Lake name |
LID |
Easting |
Northing |
Lake type |
Maximum depth (m) |
Monitoring programme |
NZLWQMP 1992–1996 |
WQ monitored |
Bathing water monitored |
Cyano-bacteria monitored |
Trophic state |
LakeSPI condition |
TLI trends |
LakeSPI trends |
Possible causes |
Indicators used |
TLI (most recent) |
LakeSPI trend period |
WQ trend period |
WQ results period |
|---|---|---|---|---|---|---|---|---|---|---|---|---|---|---|---|---|---|---|---|---|---|
|
Auckland |
Lake Kereta |
49884 |
2625000 |
6511400 |
Dune |
1.5 |
Quarterly samples since 1988. Additional parameters included in 1992. Epilimnion and hypolimnion samples from a mid-lake site. Temp–DO profile. |
No |
Yes |
No |
Yes |
Eutrophic |
n/a |
Improving quality |
nd |
Koi carp may add to nutrient cycling. |
TLI, macrophytes |
4.7 |
|
1992–2005 |
1992–2005 |
|
Lake Kuwakatai |
50269 |
2621500 |
6518500 |
Dune |
19 |
Quarterly samples since 1988. Additional parameters included in 1992. Epilimnion and hypolimnion samples from a mid-lake site. Temp–DO profile. |
No |
Yes |
No |
Yes |
Supertrophic |
n/a |
No change |
nd |
Agricultural intensification, stock access and introduced fish contributing to decline in water clarity since 1950s. |
TLI, macrophytes |
5.4 |
|
1992–2005 |
1992–2005 |
|
|
Lake Ototoa |
50270 |
2621400 |
6519800 |
Dune |
29 |
Quarterly samples since 1988. Additional parameters included in 1992. Epilimnion and hypolimnion samples from a mid-lake site. Temp–DO profile. |
No |
Yes |
No |
Yes |
Mesotrophic |
High |
Declining quality |
nd |
Agricultural intensification. |
TLI, macrophytes |
3.9 |
|
1992–2005 |
1992–2005 |
|
|
Lake Pupuke |
50151 |
2880000 |
6489500 |
Volcanic |
57 |
Quarterly samples since 1988. Additional parameters included in 1992. Epilimnion and hypolimnion samples from a mid-lake site. Temp–DO profile. |
Yes |
Yes |
Yes |
Yes |
Eutrophic |
n/a |
No change |
nd |
Improved following diversion of sewage and agricultural waste. Further improvement limited by stormwater, diffuse inputs and internal recycling. |
TLI, macrophytes |
4.3 |
|
1992–2005 |
1992–2005 |
|
|
Lake Spectacle |
22999 |
2657200 |
6556500 |
Dune |
7 |
Quarterly samples since 1988. Additional parameters included in 1992. Epilimnion and hypolimnion samples from a mid-lake site. Temp–DO profile. |
No |
Yes |
No |
Yes |
Hypertrophic |
n/a |
Declining quality |
nd |
Lack of aquatic plants, koi carp, shallow depth. High internal and external nutrient load. |
TLI, macrophytes |
6.5 |
|
1992–2005 |
1992–2005 |
|
|
Lake Tomarata |
21871 |
2658900 |
6555000 |
Dune |
5 |
Quarterly samples since 1988. Additional parameters included in 1992. Epilimnion and hypolimnion samples from a mid-lake site. Temp–DO profile. |
No |
Yes |
No |
Yes |
Eutrophic |
n/a |
Improving quality |
nd |
Rudd may have contributed to extinction of Chara sp. and Nitella sp. |
TLI, macrophytes |
4.4 |
|
1992–2005 |
1992–2005 |
|
|
Lake Wainamu |
45819 |
2641400 |
6478200 |
Landslide |
15 |
Quarterly samples since 1988. Additional parameters included in 1992. Epilimnion and hypolimnion samples from a mid-lake site. Temp–DO profile. |
No |
Yes |
Yes |
Yes |
Eutrophic |
Moderate |
No change |
Declining condition |
Collapse of Egeria beds in 1996/97 |
TLI, macrophytes |
4.6 |
|
1992–2005 |
1991–2005 |
|
|
Bay of Plenty |
Lake Okareka |
15325 |
2804400 |
6331800 |
Volcanic |
33.5 |
Monthly samples. Sample sites are located at the deepest basin of each lake and samples collected from the epilimnion (integrated) and hypolimnion (half hypolimnion depth + 1m above bottom) to assess trophic status. Monthly profiles of: temperature, DO. |
Yes |
Yes |
Yes |
Yes |
Mesotrophic |
Moderate |
No change |
Declining condition |
|
TLI, Lake SPI |
3.3 |
1988–2003 |
|
|
|
Lake Okaro |
14290 |
2806900 |
6317100 |
Volcanic |
18 |
Monthly samples. Sample sites are located at the deepest basin of each lake and samples collected from the epilimnion (integrated) and hypolimnion (half hypolimnion depth + 1m above bottom) to assess trophic status. Monthly profiles of: temperature, DO. |
Yes |
Yes |
No |
Yes |
Supertrophic |
Poor |
Improving quality |
Declining condition |
Water level rising since 1988 with corresponding improvement in water quality. |
TLI, Lake SPI |
5.6 |
1982–2003 |
|
|
|
|
Lake Okataina |
54731 |
2810300 |
6337400 |
Volcanic |
78.5 |
Monthly samples. Sample sites are located at the deepest basin of each lake and samples collected from the epilimnion (integrated) and hypolimnion (half hypolimnion depth + 1m above bottom) to assess trophic status. Monthly profiles of: temperature, DO. |
Yes |
Yes |
Yes |
Yes |
Oligotrophic |
Moderate |
Declining quality |
Stable |
|
TLI, Lake SPI |
2.91 |
1988–2005 |
|
|
|
|
Bay of Plenty |
Lake Rerewhakaaitu |
40071 |
2816290 |
6317980 |
Volcanic |
15.8 |
Monthly samples. Sample sites are located at the deepest basin of each lake and samples collected from the epilimnion (integrated) and hypolimnion (half hypolimnion depth + 1m above bottom) to assess trophic status. Monthly profiles of: temperature, DO. |
No |
Yes |
No |
Yes |
Mesotrophic |
Moderate |
No change |
Stable |
|
TLI, Lake SPI |
3.4 |
1988–2005 |
|
|
|
Lake Rotoehu |
40188 |
2820440 |
6347060 |
Volcanic |
13.5 |
Monthly samples. Sample sites are located at the deepest basin of each lake and samples collected from the epilimnion (integrated) and hypolimnion (half hypolimnion depth + 1m above bottom) to assess trophic status. Monthly profiles of: temperature, DO. |
No |
Yes |
No |
Yes |
Eutrophic |
Moderate |
No change |
Stable |
|
TLI, Lake SPI |
4.6 |
1988–2003 |
|
|
|
|
Lake Rotoiti |
54730 |
2810900 |
6344900 |
Volcanic |
125 |
Monthly samples. Sample sites are located at the deepest basin of each lake and samples collected from the epilimnion (integrated) and hypolimnion (half hypolimnion depth + 1m above bottom) to assess trophic status. Monthly profiles of: temperature, DO. |
Yes |
Yes |
Yes |
Yes |
Eutrophic |
Poor |
Declining quality |
Declining condition |
|
TLI, Lake SPI |
4.5 |
1988–2003 |
|
|
|
|
Lake Rotokakahi |
15621 |
2800250 |
6326400 |
Volcanic |
32 |
Monthly samples. Sample sites are located at the deepest basin of each lake and samples collected from the epilimnion (integrated) and hypolimnion (half hypolimnion depth + 1m above bottom) to assess trophic status. Monthly profiles of: temperature, DO. |
Yes |
Yes |
No |
Yes |
Mesotrophic |
Moderate |
Improving quality |
Declining condition |
|
TLI, Lake SPI |
|
1988–2005 |
|
|
|
|
Lake Rotoma |
40102 |
2822950 |
6346630 |
Volcanic |
83 |
Monthly samples. Sample sites are located at the deepest basin of each lake and samples collected from the epilimnion (integrated) and hypolimnion (half hypolimnion depth + 1m above bottom) to assess trophic status. Monthly profiles of: temperature, DO. |
Yes |
Yes |
Yes |
Yes |
Oligotrophic |
High |
No change |
Stable |
|
TLI, Lake SPI |
2.5 |
1988–2005 |
|
|
|
|
Lake Rotomahana |
54733 |
2811080 |
6320840 |
Volcanic |
125 |
Monthly samples. Sample sites are located at the deepest basin of each lake and samples collected from the epilimnion (integrated) and hypolimnion (half hypolimnion depth + 1m above bottom) to assess trophic status. Monthly profiles of: temperature, DO. |
No |
Yes |
No |
Yes |
Mesotrophic |
High |
Improving quality |
Stable |
|
TLI, Lake SPI |
3.8 |
1988–2005 |
|
|
|
|
Lake Rotorua |
11133 |
2798200 |
6343200 |
Volcanic |
44.8 |
Monthly samples. Sample sites are located at the deepest basin of each lake and samples collected from the epilimnion (integrated) and hypolimnion (half hypolimnion depth + 1m above bottom) to assess trophic status. Monthly profiles of: temperature, DO. |
Yes |
Yes |
Yes |
Yes |
Eutrophic |
moderate |
No change |
Stable |
|
TLI, Lake SPI |
4.7 |
1988–2003 |
|
|
|
|
Lake Tarawera |
54732 |
2807700 |
6327400 |
Volcanic |
87.5 |
Monthly samples. Sample sites are located at the deepest basin of each lake and samples collected from the epilimnion (integrated) and hypolimnion (half hypolimnion depth + 1m above bottom) to assess trophic status. Monthly profiles of: temperature, DO. |
Yes |
Yes |
Yes |
Yes |
Oligotrophic |
moderate |
No change |
Stable |
|
TLI, Lake SPI |
2.9 |
1994–2005 |
|
|
|
|
Bay of Plenty |
Lake Tikitapu |
15312 |
2801800 |
6328800 |
Volcanic |
27.5 |
Monthly samples. Sample sites are located at the deepest basin of each lake and samples collected from the epilimnion (integrated) and hypolimnion (half hypolimnion depth + 1m above bottom) to assess trophic status. Monthly profiles of: temperature, DO. |
No |
Yes |
Yes |
Yes |
Oligotrophic |
Moderate |
Declining quality |
Declining condition |
|
TLI, Lake SPI |
2.95 |
1988–2005 |
|
|
|
Canterbury |
Coopers Lagoon |
47568 |
2453905 |
5704367 |
Lagoon |
2 |
Monthly lake edge samples from Coopers Lagoon January 2003. |
No |
Yes |
No |
No |
Eutrophic |
n/a |
n/a |
n/a |
Upstream land-use and lake level management are primary drivers for their current states. |
TLI modified |
|
|
|
|
|
Lake Alexandrina |
47193 |
2304700 |
5694000 |
Glacial |
30 |
Five samples per year during summer since December 2004. Surface samples are collected mid-lake using a helicopter. |
Yes |
Yes |
No |
|
Oligotrophic* |
n/a |
Improving quality* |
n/a |
? |
TLI modified |
2.6 |
|
1990s compared to 2004/05 |
December 2004–April 2006 |
|
|
Lake Benmore |
7409 |
2288000 |
5644000 |
Reservoir |
120 |
Five samples per year during summer since December 2004. Surface samples are collected mid-lake using a helicopter. |
No |
Yes |
No |
|
Microtrophic* |
n/a |
n/a |
n/a |
|
TLI modified |
|
|
|
December 2004–April 2006 |
|
|
Lake Camp |
41306 |
2353100 |
5730700 |
Glacial |
13 |
Five samples per year during summer since December 2004. Surface samples are collected mid-lake using a helicopter. |
No |
Yes |
No |
|
Oligotrophic* |
n/a |
Improving quality* |
n/a |
|
TLI modified |
2.5 |
|
1990s compared to 2004/05 |
December 2004–April 2006 |
|
|
Lake Clearwater |
41305 |
2352300 |
5731900 |
Glacial |
18 |
Five samples per year during summer since December 2004. Surface samples are collected mid-lake using a helicopter. |
No |
Yes |
No |
|
Oligotrophic* |
n/a |
Improving quality* |
n/a |
|
TLI modified |
2.7 |
|
1990s compared to 2004/05 |
December 2004–April 2006 |
|
|
Lake Coleridge |
48451 |
2389200 |
5765800 |
Glacial |
200 |
Five samples per year during summer since December 2004. Surface samples are collected mid-lake using a helicopter. |
No |
Yes |
No |
|
Microtrophic* |
n/a |
Improving quality* |
n/a |
|
TLI modified |
1.16 |
|
1990s compared to 2004/05 |
December 2004–April 2006 |
|
|
Lake Ellesmere/ Te Waihora |
48177 |
2467369 |
5713866 |
Lagoon |
3 |
Monthly surface samples from four mid-lakes sites in Lake Ellesmere since 1993. In addition, one lake edge site sampled weekly during summer for recreational bathing (E. coli). |
No |
Yes |
Yes |
No |
Hypertrophic |
n/a |
No change |
n/a |
Upstream land-use and lake level management are primary drivers for their current states. |
TLI |
|
|
|
|
|
|
Lake Emma |
41299 |
2357300 |
5728500 |
Glacial |
3 |
Five samples per year during summer since December 2004. Surface samples are collected mid-lake using a helicopter. |
No |
Yes |
No |
|
Mesotrophic* |
n/a |
No change* |
n/a |
|
TLI modified |
3.8 |
|
1990s compared to 2004/05 |
December 2004–April 2006 |
|
|
Lake Forsyth/ Te Wairewa |
47579 |
2489760 |
5712012 |
Lagoon |
3 |
Fortnightly lake edge samples from Lake Forsyth since 1993. Phytoplankton taxa and toxins monitored. |
Yes |
Yes |
No |
Yes |
Hypertrophic |
n/a |
No change |
n/a |
Upstream land-use and lake level management are primary drivers for their current states. |
TLI modified |
|
|
|
|
|
|
Lake Georgina |
48447 |
2393900 |
5764500 |
Glacial |
10 |
Five samples per year during summer since December 2004. Surface samples are collected mid-lake using a helicopter. |
No |
Yes |
No |
|
Oligotrophic* |
n/a |
No change* |
n/a |
|
TLI modified |
2.3 |
|
1990s compared to 2004/05 |
December 2004–April 2006 |
|
|
Lake Grassmere |
48663 |
2410100 |
5793200 |
nd |
15 |
Five samples per year during summer since December 2004. Surface samples are collected mid-lake using a helicopter. |
No |
Yes |
No |
|
Oligotrophic* |
n/a |
Improving quality* |
n/a |
|
TLI modified |
2.2 |
|
1990s compared to 2004/05 |
December 2004–April 2006 |
|
|
Lake Hawdon |
48669 |
2416400 |
5788600 |
Glacial |
13 |
Five samples per year during summer since December 2004. Surface samples are collected mid-lake using a helicopter. |
No |
Yes |
No |
|
Oligotrophic* |
n/a |
No change* |
n/a |
|
TLI modified |
2.3 |
|
|
December 2004–April 2006 |
|
|
Lake Heron |
47892 |
2361900 |
5745300 |
Riverine |
37 |
Five samples per year during summer since December 2004. Surface samples are collected mid-lake using a helicopter. |
No |
Yes |
No |
|
Oligotrophic* |
n/a |
No change* |
n/a |
|
TLI modified |
2 |
|
1990s compared to 2004/05 |
December 2004–April 2006 |
|
|
Lake Ida |
48455 |
2391300 |
5773600 |
nd |
9 |
Five samples per year during summer since December 2004. Surface samples are collected mid-lake using a helicopter. |
No |
Yes |
No |
|
Oligotrophic* |
n/a |
Improving quality* |
n/a |
|
TLI modified |
2.2 |
|
1990s compared to 2004/05 |
December 2004–April 2006 |
|
|
Canterbury |
Lake Lyndon |
48597 |
2404700 |
5766500 |
Glacial |
28 |
Five samples per year during summer since December 2004. Surface samples are collected mid-lake using a helicopter. |
No |
Yes |
No |
|
Microtrophic* |
n/a |
n/a |
n/a |
|
TLI modified |
1.8 |
|
|
December 2004–April 2006 |
|
Lake Ohau |
45514 |
2258100 |
5659500 |
Glacial |
129 |
Five samples per year during summer since December 2004. Surface samples are collected mid-lake using a helicopter. |
No |
Yes |
No |
|
Microtrophic* |
n/a |
n/a |
n/a |
|
TLI modified |
1.4 |
|
|
December 2004–April 2006 |
|
|
Lake Pearson – North |
48660 |
2410800 |
5789000 |
nd |
17 |
Five samples per year during summer since December 2004. Surface samples are collected mid-lake using a helicopter. |
Yes |
Yes |
No |
|
Microtrophic* |
n/a |
Improving quality* |
n/a |
|
TLI modified |
1.6 |
|
1990s compared to 2004/05 |
December 2004–April 2006 |
|
|
Lake Pearson – South |
48660 |
2410600 |
5787200 |
nd |
17 |
Five samples per year during summer since December 2004. Surface samples are collected mid-lake using a helicopter. |
Yes |
Yes |
No |
|
Microtrophic* |
n/a |
Improving quality* |
n/a |
|
TLI modified |
1.7 |
|
1990s compared to 2004/05 |
December 2004–April 2006 |
|
|
Lake Pukaki |
46564 |
2283200 |
5680357 |
Glacial |
70 |
Five samples per year during summer since December 2004. Surface samples are collected mid-lake using a helicopter. |
No |
Yes |
No |
|
Microtrophic* |
n/a |
n/a |
n/a |
|
TLI modified |
1.38 |
|
|
December 2004–April 2006 |
|
|
Lake Sarah |
48673 |
2410300 |
5794700 |
nd |
6.7 |
Five samples per year during summer since December 2004. Surface samples are collected mid-lake using a helicopter. |
No |
Yes |
No |
|
Oligotrophic* |
n/a |
Improving quality* |
n/a |
|
TLI modified |
2.3 |
|
1990s compared to 2004/05 |
December 2004–April 2006 |
|
|
Lake Selfe |
48213 |
2389700 |
5773100 |
nd |
30 |
Five samples per year during summer since December 2004. Surface samples are collected mid-lake using a helicopter. |
No |
Yes |
No |
|
Oligotrophic* |
n/a |
Improving quality* |
n/a |
|
TLI modified |
2.1 |
|
1990s compared to 2004/05 |
December 2004–April 2006 |
|
|
Lake Sumner |
54738 |
2446300 |
5835000 |
Glacial |
135 |
Five samples per year during summer since December 2004. Surface samples are collected mid-lake using a helicopter. |
No |
Yes |
No |
|
Microtrophic* |
n/a |
Improving quality* |
n/a |
|
TLI modified |
1.3 |
|
1990s compared to 2004/05 |
December 2004–April 2006 |
|
|
Lake Taylor |
39356 |
2446862 |
5826652 |
Glacial |
40.5 |
Five samples per year during summer since December 2004. Surface samples are collected mid-lake using a helicopter. |
No |
Yes |
No |
|
Oligotrophic* |
n/a |
No change* |
n/a |
|
TLI modified |
2.2 |
|
1990s compared to 2004/05 |
December 2004–April 2006 |
|
|
Lake Tekapo |
47228 |
2310900 |
5697400 |
Glacial |
120 |
Five samples per year during summer since December 2004. Surface samples are collected mid-lake using a helicopter. |
Yes |
Yes |
No |
|
Microtrophic* |
n/a |
Improving quality* |
n/a |
|
TLI modified |
1.1 |
|
1990s compared to 2004/05 |
December 2004–April 2006 |
|
|
Loch Katrine |
39364 |
2444400 |
5831800 |
Glacial |
28 |
Five samples per year during summer since December 2004. Surface samples are collected mid-lake using a helicopter. |
No |
Yes |
No |
|
Oligotrophic* |
n/a |
No change* |
n/a |
|
TLI modified |
2.2 |
|
1990s compared to 2004/05 |
December 2004–April 2006 |
|
|
Wainono Lagoon |
12469 |
2363775 |
5610166 |
Lagoon |
2 |
Monthly lake edge samples from Wainono Lagoon since June 2000. |
No |
Yes |
No |
No |
Eutrophic |
n/a |
n/a |
n/a |
Upstream land-use and lake level management are primary drivers for their current states. |
TLI modified |
|
|
|
|
|
|
Chatham Island |
Causeway Lake |
|
|
|
nd |
Shallow |
Quarterly monitoring of Chatham Island streams and lakes since April 2005. Single sample from the lake margin. |
No |
Yes |
No |
|
Supertrophic* |
n/a |
n/a |
n/a |
|
TLI modified |
5.4 |
|
|
|
|
Lake Huro |
|
|
|
nd |
Shallow |
Quarterly monitoring of Chatham Island streams and lakes since April 2005. Single sample from the lake margin. |
No |
Yes |
No |
|
Hypertrophic* |
n/a |
n/a |
n/a |
|
TLI modified |
6.45 |
|
|
|
|
|
Lake Kaingaraha |
|
|
|
nd |
Shallow |
Quarterly monitoring of Chatham Island streams and lakes since April 2005. Single sample from the lake margin. |
No |
Yes |
No |
|
Hypertrophic* |
n/a |
n/a |
n/a |
|
TLI modified |
7.4 |
|
|
|
|
|
Lake Koomutu |
|
|
|
nd |
Shallow |
Quarterly monitoring of Chatham Island streams and lakes since April 2005. Single sample from the lake margin. |
No |
Yes |
No |
|
Supertrophic* |
n/a |
n/a |
n/a |
|
TLI modified |
5.86 |
|
|
|
|
|
Chatham Island |
Lake Marakapia |
|
|
|
nd |
Shallow |
Quarterly monitoring of Chatham Island streams and lakes since April 2005. Single sample from the lake margin. |
No |
Yes |
No |
|
Supertrophic* |
n/a |
n/a |
n/a |
|
TLI modified |
5.03 |
|
|
|
|
Lake Rangitai |
|
|
|
nd |
Shallow |
Quarterly monitoring of Chatham Island streams and lakes since April 2005. Single sample from the lake margin. |
No |
Yes |
No |
|
Mesotrophic* |
n/a |
n/a |
n/a |
|
TLI modified |
3.74 |
|
|
|
|
|
Lake Te Roto |
|
|
|
nd |
Shallow |
Quarterly monitoring of Chatham Island streams and lakes since April 2005. Single sample from the lake margin. |
No |
Yes |
No |
|
Supertrophic* |
n/a |
n/a |
n/a |
|
TLI modified |
5.05 |
|
|
|
|
|
Lake Te Wapu |
|
|
|
nd |
Shallow |
Quarterly monitoring of Chatham Island streams and lakes since April 2005. Single sample from the lake margin. |
No |
Yes |
No |
|
Supertrophic* |
n/a |
n/a |
n/a |
|
TLI modified |
5.38 |
|
|
|
|
|
Lake Wharemanu |
|
|
|
nd |
Shallow |
Quarterly monitoring of Chatham Island streams and lakes since April 2005. Single sample from the lake margin. |
No |
Yes |
No |
|
Supertrophic* |
n/a |
n/a |
n/a |
|
TLI modified |
5.71 |
|
|
|
|
|
Tennants Lake |
|
|
|
nd |
Shallow |
Quarterly monitoring of Chatham Island streams and lakes since April 2005. Single sample from the lake margin. |
No |
Yes |
No |
|
Mesotrophic* |
n/a |
n/a |
n/a |
|
TLI modified |
3.63 |
|
|
|
|
|
Gisborne District |
Ratahi Lagoon |
43199 |
2975600 |
6336300 |
Lagoon |
Shallow |
Fortnightly grab sample from lake margin since 1980. |
No |
Yes |
No |
No |
n/a |
n/a |
n/a |
n/a |
Treated wastewater discharged to the Lagoon. |
WQ |
|
|
|
|
|
Greater Wellington |
Lake Wairarapa |
1708 |
2697846 |
5996443 |
Riverine |
2.5 |
Quaterly monitoring of four sites since 1994. Subsurface grab sample as per Smith et al 1989. |
No |
Yes |
No |
No |
Supertrophic |
n/a |
Improving quality |
n/a |
|
TLI |
5.77 |
|
|
Median 1994–2005 |
|
Hawkes Bay |
Lake Tutira |
36981 |
2846003 |
6212590 |
Landslide |
40 |
Not currently monitored. Partner of New Zealand lake monitoring network. |
Yes |
No |
No |
No |
Mesotrophic |
n/a |
n/a |
n/a |
|
n/a |
3.8 |
|
1992–1996 |
1992–1996 |
|
Manawatu-Wanganui |
Lake Dudding |
13447 |
2704337 |
6120367 |
Dune |
10.5 |
During the summer, monitoring is also undertaken to assess suitability for recreational bathing including enumeration of cyanobacteria. Lake SPI monitoring was undertaken by NIWA in about 2003. Was part of NZLMP. |
Yes |
No |
Yes |
Yes |
Eutrophic |
n/a |
n/a |
|
|
Macrophytes |
4.6 |
|
|
NZLMP 1992–1994 |
|
Lake Horowhenua |
4345 |
2700585 |
6063747 |
Dune |
2 |
Monthly water quality samples from Lake Horowhenua since 1998. Three sites in the lake are sampled and composited into a single sample for analysis. During the summer, monitoring is also undertaken to assess suitability for recreational bathing. |
No |
Yes |
Yes |
Yes |
Supertrophic* |
n/a |
n/a |
n/a |
|
TLI, macrophytes |
5.8 |
|
|
August 2002–February 2006 |
|
|
Lake Pauri |
18933 |
2689318 |
6134290 |
Dune |
13 |
During the summer, monitoring is also undertaken to assess suitability for recreational bathing including enumeration of cyanobacteria. |
No |
No |
Yes |
Yes |
n/a |
n/a |
n/a |
n/a |
|
Macrophytes |
n/a |
|
|
|
|
|
Lake Wiritoa |
18934 |
2688355 |
6134629 |
Dune |
19.5 |
During the summer, monitoring is also undertaken to assess suitability for recreational bathing including enumeration of cyanobacteria. Lake SPI monitoring was undertaken by NIWA in about 2003. |
No |
No |
Yes |
Yes |
n/a |
n/a |
n/a |
Declining condition |
|
Macrophytes |
n/a |
|
|
|
|
|
Pukepuke Lagoon |
5042 |
2702428 |
6093608 |
Dune |
1 |
Lake SPI monitoring was undertaken by NIWA in about 2003. |
No |
No |
No |
No |
n/a |
n/a |
n/a |
n/a |
|
Macrophytes |
n/a |
|
|
|
* State based on a modified version of the TLI, eg, no secchi depth or chlorophyll a measurement.
* Trends based on observations since the NZLMP (1992-1996).
Auckland Regional Council. 2005. Working Report, Environmental Research Lakes Water Quality Monitoring.
Barnes G. 2002. Water Quality Trends in Selected Shallow Lakes in the Waikato Region, 1995-2001. Prepared for Environment Waikato Environment Waikato, July. Technical Report 2002/11.
Barnes G, Burns N. 2006. Water Quality of Selected Lakes in the Auckland Region (1992-2005). Prepared for Auckland Regional Council. ARC Technical Publication 268 (TP268).
Burns N, Rutherford K. 1998. Results of Monitoring New Zealand Lakes 1992-1996. Volume 1: General Findings. Prepared for the Ministry for the Environment. NIWA Client Report: MFE80216. June.
Burns N, Rutherford K. 1998. Results of Monitoring New Zealand Lakes 1992-1996. Volume 2: Commentary on results. Prepared for the Ministry for the Environment. NIWA Client Report: MFE80216. June.
Burns N, Bryers G, Bowman E. 2000. Protocol for Monitoring Trophic Levels of New Zealand Lakes and Reservoirs. Prepared for Ministry of the Environment by Lakes Consulting, March.
Canterbury Regional Council. 1996. The Natural Resources of Lake Ellesmere (Te Waihora) and its Catchment. CRC Report No. 96/7.
Champion P, Clayton J, Rowe D. 2002. Lake Managers' Handbook: Alien Invaders. Prepared for the Ministry for the Environment.
Champion P, Wells R, Matheson F, de Winton M. 2005. Northland Lakes Assessment 2004/05. Prepared by NIWA for Northland Regional Council. NIWA Client Report HAM2005-113.
Clayton J, Edwards T, Froude V. 2002. LakeSPI: A method for monitoring ecological condition in New Zealand lakes. Technical Report Version 1. NIWA Client Report HAM2002-011.
Edwards T, Clayton J. 2002. Aquatic Vegetation in Lake Dudding, Wiritoa, Horowhenua and Pukepuke Lagoon. NIWA Client Report HMW02201. Prepared for Manawatu-Wanganui Regional Council. NIWA Client Report HAM2005-125.
Edwards T, Clayton J, de Winton M. 2005. The Condition of Lakes in the Waikato Region Using LakeSPI. Report prepared by NIWA for Environment Waikato. NIWA Client Report HAM2005-125.
Elliot S, Sorrell B. 2002. Lake Managers' Handbook: Land-Water Interactions. Prepared for the Ministry for the Environment.
Environment Southland. 2005. Annual Environmental Monitoring Report 2003/04. http://www.es.govt.nz/Departments/EI/Annual%20Environmental%20Monitoring/2005/lakewaterquality.aspx?id=a1_2#
Gibbs M, Boothroyd I, Champion P, Green J, Duggan I. 1999. ARC Lakes Monitoring Programme Review. NIWA Client Report ARC00256, November.
Gibbs M M. 2005. Lake Taupo Long-term Monitoring Programme 2003-2004: Including two additional sites. Environment Waikato Technical Report 2005/18.
Hawke's Bay Regional Council. 2006. Freshwater Quality Strategy - draft.
Hughes. 1976. Research into Aquatic Weeds in New Zealand Waterways: A review. Department of Scientific and Industrial Research information series 116, 34 p.
Kelly D. 2006. Update of Results for Lake Brunner Water Quality and Input/Output Tributary Monitoring for the 2005-06 Monitoring Year. Report for West Coast Regional Council by NIWA, Christchurch.
Livingston M E, Biggs B J, Gifford J S. 1986. Inventory of New Zealand lakes - Part 1: North Island. Water and Soil Miscellaneous Publication No. 80. Wellington.
Livingston M E, Biggs B J, Gifford J S. 1986. Inventory of New Zealand lakes - Part 2: South Island. Water and Soil Miscellaneous Publication No. 81. Wellington.
Mark A, Single M. 2002. Lake Managers' Handbook: Lake Level Management. Prepared for the Ministry for the Environment.
Meredith A. 2004a. Monitoring of the Water Quality of Canterbury High Country Lakes. Report No. U04/34.
Meredith A. 2004b. Canterbury High Country Lakes Water Quality Monitoring Programme. Results of first year's monitoring 2004/05. Report No. 05/42.
Meredith A. 2005. Baseline State of the Environment Survey of the Water Quality of Chatham Island, and Approaches to Establishing a Routine Monitoring Strategy. Draft report to Chatham Island Council.
Milne J. 2002. State of the Environment Surface Water Quality Monitoring: A review. Otago Regional Council.
Ministry for the Environment. 1997. The State of New Zealand's Environment.
Ministry for the Environment. 2003. New Zealand Microbiological Water Quality Guidelines for Marine and Freshwater Recreational Areas. Published in June 2002, updated in June 2003.
NIWA. 1998. Lake Rotoiti Monitoring. NIWA Client Report MFE80216, June.
Northland Regional Council. 2005a. Annual Monitoring Report 2004-2005.
Northland Regional Council. June 2005b. Lake Omapere Water Quality Report.
Otago Regional Council. 2005. Lake Waipori and Lake Waihola: Trophic Level Status. March.
Perrie A. 2005. Lake Wairarapa Water Quality Monitoring Technical Report. Greater Wellington Regional Council. http://www.gw.govt.nz/Home/Information & services/Environmental monitoring/Lake levels
Rowe D K, Graynoth E. 2002. Lake Managers' Handbook: Fish in New Zealand Lakes. Prepared for the Ministry for the Environment.
Scholes P, Bloxham M. 2005. Rotorua Lakes Water Quality 2005. Environment Bay of Plenty Environmental Publication 2005/24.
Spiegel R H, Viner A B. 1992. Lakes. In: Waters of New Zealand, edited by MP Mosley, New Zealand Hydrological Society, Wellington, 305-334.
Taranaki Regional Council. 2006. Annual Compliance Monitoring Report 2005/06.
Taranaki Regional Council. 2005a. Taranaki Generation Ltd - Lake Rotorangi Monitoring Programme. Water Quality and Biological Programmes Annual Report 2004-2005. Technical Report 2005-76.
Taranaki Regional Council 2005b. Freshwater Contact Recreational Water Quality at Selected Taranaki Sites: SoE monitoring report summer 2004-2005. Technical Report 2005-09.
Vant W N (editor). 1987. Lake Managers' Handbook: A guide to undertaking and understanding investigations into lake ecosystems, so as to assess management options for lakes. Water and Soil Miscellaneous Publications No. 103.
West Coast Regional Council. 2005. West Coast Surface Water Quality (SOE Report).
See more on...
Snapshot of lake water quality in New Zealand
November 2006
© Ministry for the Environment