1. Effects of climate change on the ocean around New Zealand

Section themes
The ocean surrounding Aotearoa New Zealand is deeply connected to the global climate system. As the climate warms, sea-surface temperatures are rising, storms and marine heatwaves are intensifying, and ocean acidification is increasing. These changes are already reshaping the marine environment around New Zealand – and they are happening faster here than in many other parts of the world.
Natural climate oscillations such as the El Niño Southern Oscillation and the Southern Annular Mode continue to influence ocean conditions, and their interactions with climate trends are amplifying impacts. Together, these forces are altering ocean circulation, productivity and species distributions, with cascading effects on ecosystems and fisheries.
This section explores the physical changes occurring in our oceans — warming, acidification, shifting currents and rising sea levels — and what they mean for marine ecosystems.
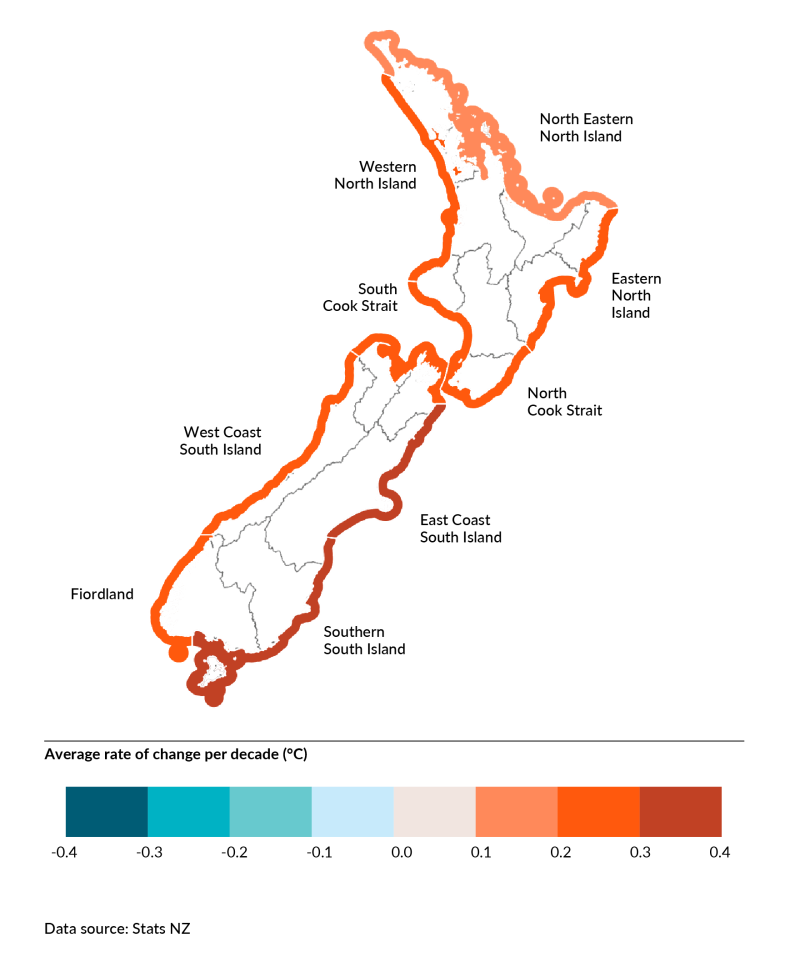
A map of New Zealand that shows the average rate of coastal sea-surface temperature change per decade in degrees Celsius, across nine coastal areas, between 1982 and 2023. The coastal areas around New Zealand are coloured to show the average rate of change. The scale ranges from a rate of change of -0.4 degrees Celsius (dark blue) to 0.4 degrees Celsius (red). Red represents positive rates of change meaning that the rate of sea-surface temperature is increasing, while at the other end of the scale dark blue represents negative rates of change meaning that the rate of sea-surface temperature is decreasing. More information is available from the Stats NZ indicator page Sea-surface temperature: Data to 2023.

A map of New Zealand that shows the average rate of coastal sea-surface temperature change per decade in degrees Celsius, across nine coastal areas, between 1982 and 2023. The coastal areas around New Zealand are coloured to show the average rate of change. The scale ranges from a rate of change of -0.4 degrees Celsius (dark blue) to 0.4 degrees Celsius (red). Red represents positive rates of change meaning that the rate of sea-surface temperature is increasing, while at the other end of the scale dark blue represents negative rates of change meaning that the rate of sea-surface temperature is decreasing. More information is available from the Stats NZ indicator page Sea-surface temperature: Data to 2023.

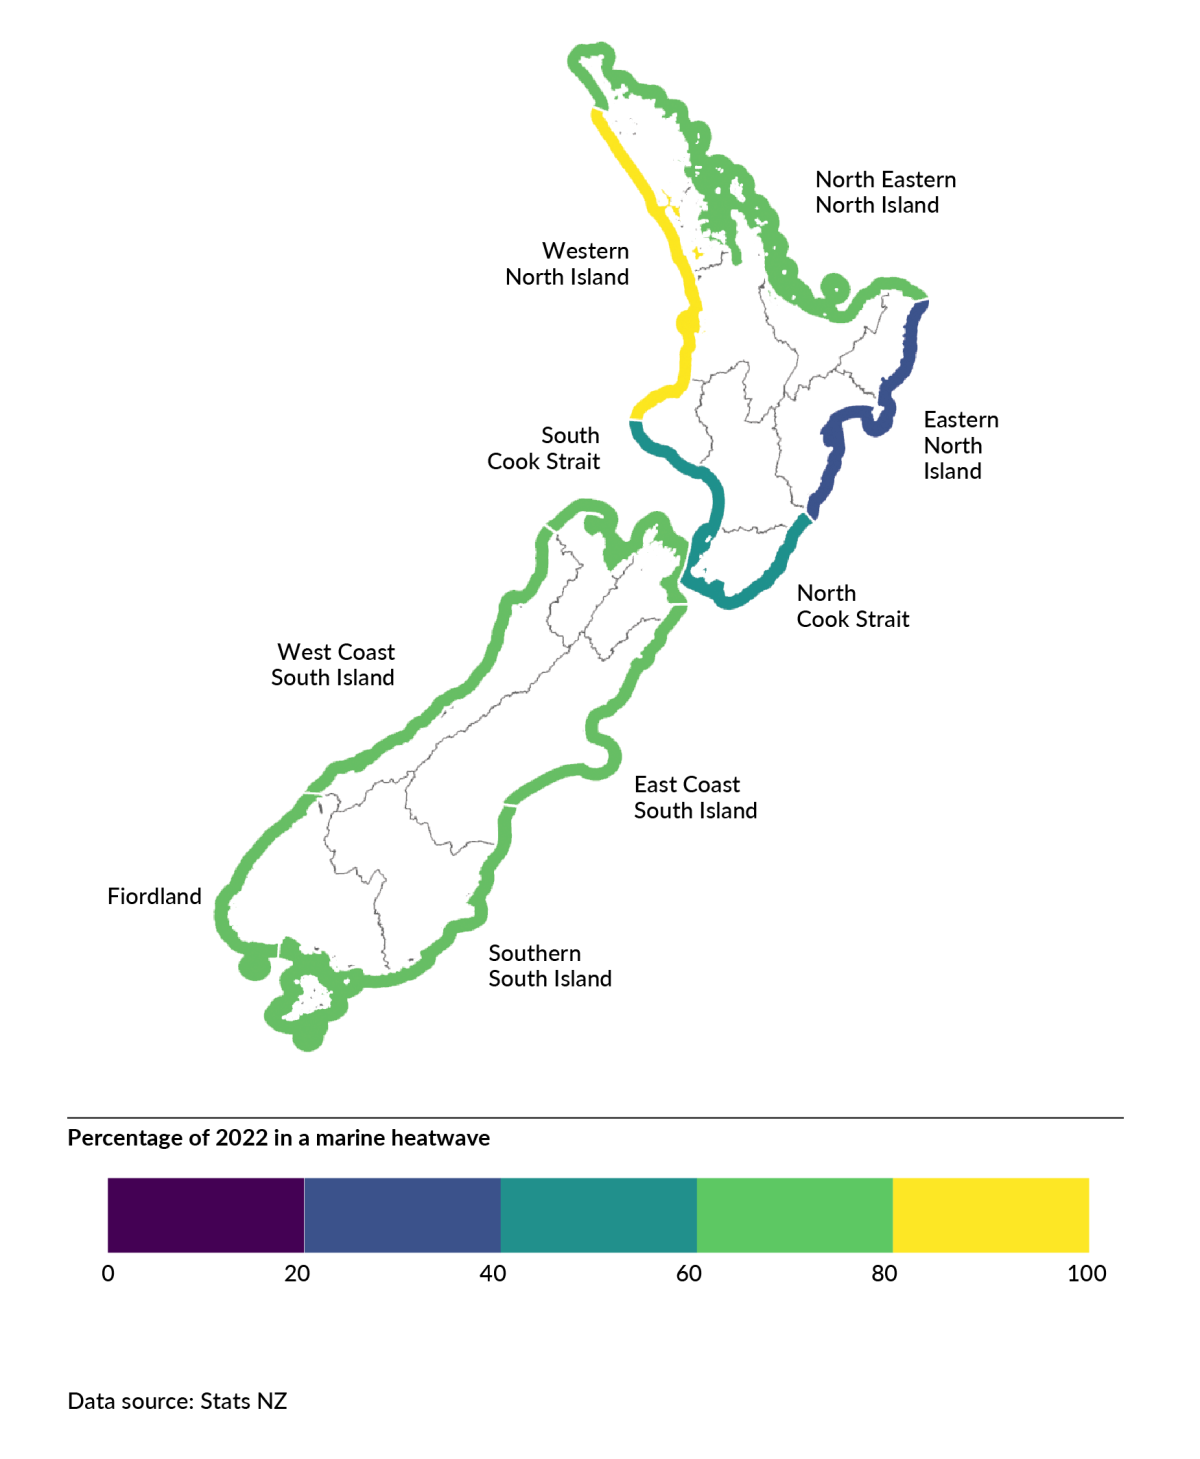
A map of New Zealand showing the percentage of the year spent in a marine heatwave, by coastal region, in 2022. The scale ranges from less than 20 percent to more than 80 percent. The colours on the map range from purple, which represents lower percentages of the year spent in marine heatwaves, through blue and green to yellow, which represents higher percentages of the year spent in marine heatwaves. More information is available from the Stats NZ indicator page Sea-surface temperature: Data to 2023.
A map of New Zealand showing the percentage of the year spent in a marine heatwave, by coastal region, in 2022. The scale ranges from less than 20 percent to more than 80 percent. The colours on the map range from purple, which represents lower percentages of the year spent in marine heatwaves, through blue and green to yellow, which represents higher percentages of the year spent in marine heatwaves. More information is available from the Stats NZ indicator page Sea-surface temperature: Data to 2023.

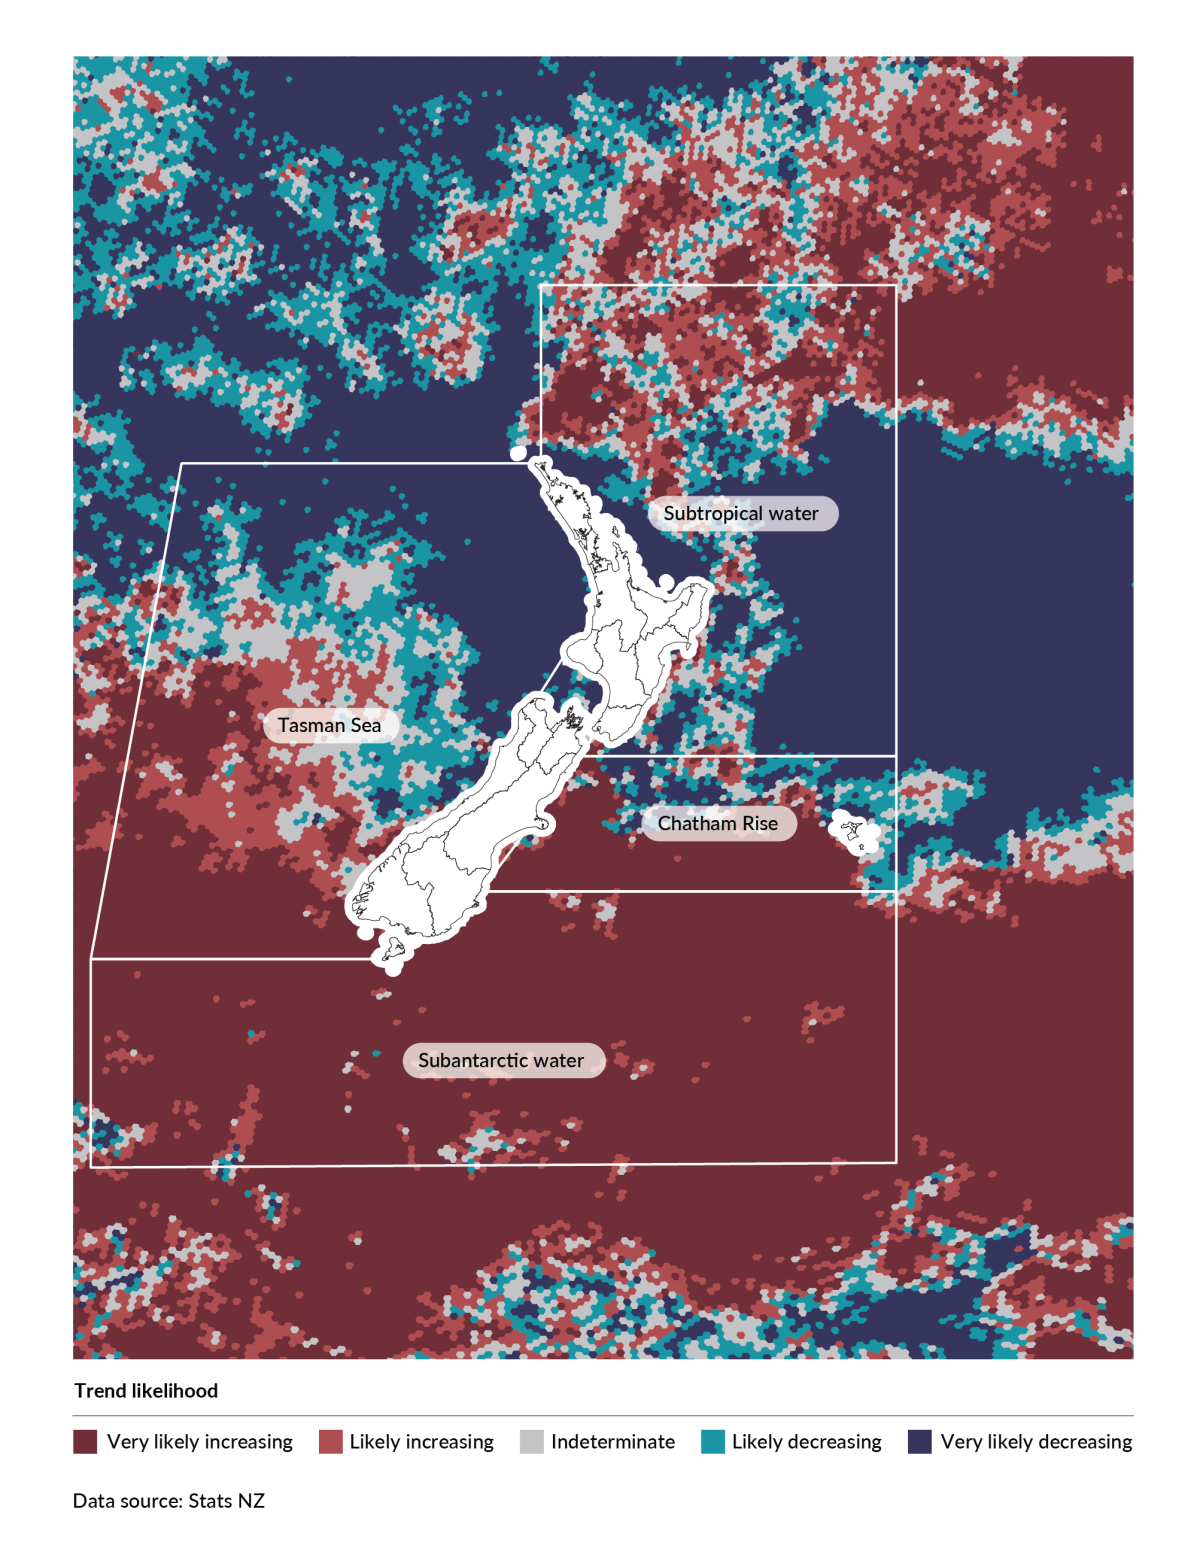
The map shows four oceanic regions of New Zealand. It is overlaid with boundaries for the four oceanic regions: Subtropical water, Tasman Sea, Chatham Rise, and Subantarctic water. The map is coloured to show the trend likelihood to indicate regions where the trend in oceanic chl-a concentrations is very likely increasing (dark red), likely increasing (light red), indeterminate (grey), likely decreasing (light blue), and very likely decreasing (dark blue). More information is available from the Stats NZ indicator page Marine primary productivity: Data to 2023.
The map shows four oceanic regions of New Zealand. It is overlaid with boundaries for the four oceanic regions: Subtropical water, Tasman Sea, Chatham Rise, and Subantarctic water. The map is coloured to show the trend likelihood to indicate regions where the trend in oceanic chl-a concentrations is very likely increasing (dark red), likely increasing (light red), indeterminate (grey), likely decreasing (light blue), and very likely decreasing (dark blue). More information is available from the Stats NZ indicator page Marine primary productivity: Data to 2023.
Note: See Our environment 2025: Technical annex for interpretation of Stats NZ trend likelihood.

1. Effects of climate change on the ocean around New Zealand
October 2025
© Ministry for the Environment