Our Atmosphere and Climate 2026 Tō Tātou Kōhauhau, Āhuarangi Hoki

Our Atmosphere and Climate 2026 assesses evidence about the state of our atmosphere and climate, the pressures affecting them, and the implications for Aotearoa New Zealand. The report is produced jointly by Stats NZ and the Ministry for Cities, Environment, Regions and Transport.
Our Atmosphere and Climate 2026 assesses evidence about the state of our atmosphere and climate, the pressures affecting them, and the implications for Aotearoa New Zealand. The report is produced jointly by Stats NZ and the Ministry for Cities, Environment, Regions and Transport.
Tēnā koutou katoa
For most of Aotearoa New Zealand’s history, the environmental conditions that underpin our society have changed only gradually. Increasingly, this is no longer the case.
Climate change is affecting many aspects of our natural and built environments. Some changes occur gradually over decades. Others emerge through changes in the frequency, intensity, or location of events and hazards. Together, they are altering the conditions within which communities, businesses, infrastructure and ecosystems operate.
As these conditions change, trustworthy information becomes increasingly important. Understanding what is changing, how quickly it is changing, and what those changes may mean is essential for informed discussion and decision-making.
This is the purpose of environmental reporting. Under the Environmental Reporting Act 2015, the Secretary for the Environment and the Government Statistician jointly produce reports that provide an independent, evidence-based assessment of New Zealand’s environment. By bringing together information on environmental pressures, state and impacts, environmental reporting helps build a shared understanding of the changes occurring around us.
Our Atmosphere and Climate 2026 is the first environmental report released by the Ministry for Cities, Environment, Regions and Transport alongside Stats NZ. It reflects the contributions of many organisations, experts and communities across New Zealand’s environmental information system. It also highlights the connections between climate change, communities, infrastructure, economic activity and the natural environment, demonstrating the value of understanding these issues as part of a wider system.
No single report can answer every question. However, bringing credible evidence together in one place provides a stronger foundation for informed decisions about the places and environments on which New Zealand’s future depends.
| Jeremy Lightfoot Secretary for the Environment |
Colin Lynch Government Statistician |
Aotearoa New Zealand is shaped by its climate. The weather patterns here have shaped the physical form of our land and influenced the development of species and ecosystems found nowhere else. When humans arrived, these environments along with temperatures and precipitation patterns were crucial to where we built settlements, grew crops and placed infrastructure. But now New Zealand’s climate, largely stable for the past ten millennia, is changing and we are increasingly seeing the impacts of these changes unfold.
Human activities are increasing the concentration of greenhouse gases in the atmosphere, trapping more heat. That additional heat is showing up in rising temperatures, warming oceans, rising seas, shifting rainfall patterns and more intense extremes. The impacts of our past choices are already playing out. The effects extend through ecosystems, and people’s health and wellbeing to livelihoods, property and infrastructure. The extent of further change and future impacts depends strongly on future global greenhouse gas emissions.
Our Atmosphere and Climate 2026 is the latest in a series of environmental reports produced by the Ministry for Cities, Environment, Regions and Transport and Stats NZ under the Environmental Reporting Act 2015 (the Act). It is the fourth report in the series dedicated to New Zealand’s atmosphere and climate, following reports in 2017, 2020 and 2023, and the first report released following the transfer of the statutory functions of the Ministry for the Environment. This report brings together the latest data and evidence to explain how New Zealand’s climate is changing, what those changes mean for our environment and lives, and the pressures contributing to them.
This report is structured around four key questions:
The Act requires us to report on environmental pressures, state and impacts, as well as on specific topics set out in the Act. We do this through a set of environmental indicators. Where indicators are not available or do not fully describe an issue, we use a broader body of evidence to ensure the report provides a comprehensive and authoritative picture of the state of New Zealand’s atmosphere and climate.
The indicator data in this report draw on many sources, including public research organisations and central government. The body of evidence brings together peer‑reviewed scientific literature, government reports and other grey literature, mātauranga Māori (Māori knowledge), and observational information on ecosystem changes.
All data and evidence used in this report were corroborated and checked for consistency with their original sources, and a panel of independent scientists reviewed the report. This approach brings together multiple lines of evidence, helping to ensure the report provides a comprehensive and reliable picture of New Zealand’s atmosphere and climate, including in areas where indicators alone do not fully describe the issue. Indicator definitions and update dates are available on the Stats NZ indicators web pages. Evaluating specific policies and providing advice on responses is out of scope for reports prepared under the Act. Reports under the Act are produced independently of ministers.
This report contains outlooks assessments which are a description of how the environment may change in the future. They are assessed based on current data and trends and likely future impacts on the environment and the things we value.
The future will always be uncertain. For this reason, the assessments in this report should not be read as statements of fact but as assessments of what may occur based on what we know now about the range of possible futures. To support this, we have used expressions of likelihood and confidence to help in interpretation. This ensures we can make assessments about current and emerging issues even when our confidence in them may be low due to the limitations of the evidence base.
Expressions of likelihood are italicised in the text. Expressions of confidence, which give an indication of the reliability and level of corroboration of evidence used in an assessment, are presented in brackets and italicised at the end of each assessment. The approach used in this report closely follows guidance from the Intergovernmental Panel on Climate Change around uncertainty assessments. These assessments reflect the amount, quality and consistency of the evidence available, together with the level of agreement among experts.
Higher confidence indicates stronger supporting evidence and greater agreement among lines of evidence. Lower confidence indicates that greater uncertainty remains. This report synthesises evidence on projected future changes (outlooks) from a range of published studies and reports. Where appropriate, it aligns with the climate scenario framework used by the Climate Change Commission (He Pou a Rangi Climate Change Commission, 2026b: appendix 1).
The underlying studies use a range of approaches, including different climate scenarios and sea-level rise assumptions, to assess how New Zealand’s climate and environment may change under plausible future conditions.
Of the 18 indicators included in this report, 13 are atmosphere and climate indicators that have been updated since Our atmosphere and climate 2023 (see Stats NZ environment indicators). Overall, the continued global pressures placed on our atmosphere and climate mean the updates show a continuation of the broad trends reported previously.
The highest recorded atmospheric concentrations of carbon dioxide, methane and nitrous oxide in New Zealand were recorded in 2025, with 7 of the 10 warmest years on record occurring in the last decade since 2016. This follows a similar pattern to global trends, with global temperatures passing 1.5 degrees Celsius above pre-industrial levels for the first time in 2024.
Since Our atmosphere and climate 2023, the strongest advances in the evidence have been in understanding impacts and risk. Research has strengthened evidence that climate change is affecting ecosystems and species across land, freshwater and marine environments, increasing risks to human health and wellbeing. Climate change is also creating growing challenges for sectors such as agriculture, fisheries, tourism and insurance, but evidence is increasingly showing that our choices could create new opportunities. The evidence base has also expanded considerably for Māori cultural values, knowledge systems and connections to the environment.
New national-scale assessments now provide a more comprehensive picture of climate risk across New Zealand, including the exposure of homes, infrastructure, businesses and communities to flooding, landslides and coastal hazards. These studies, together with a growing body of research on adaptation and resilience, provide a clearer understanding of where risks are emerging, who is most exposed, and where the opportunities exist to reduce future impacts.
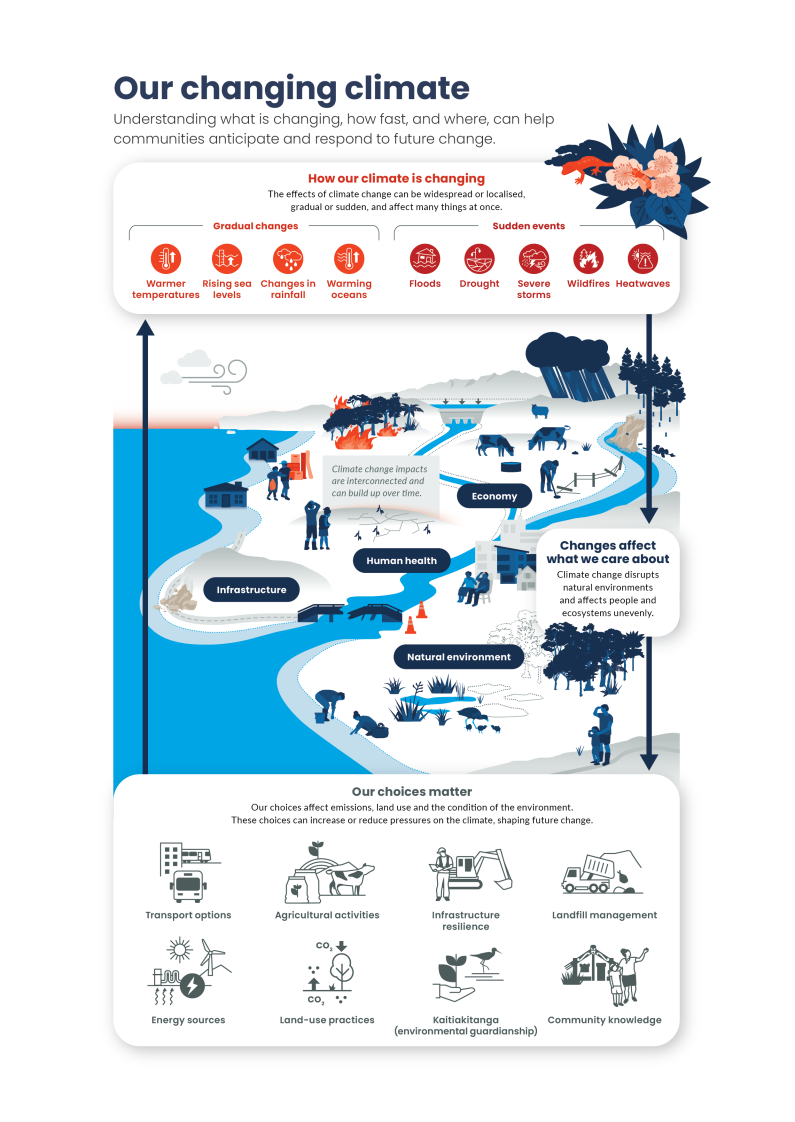
A full-page infographic. It shows that the climate is changing, that gradual changes and sudden events can affect the things we value, and that our choices influence future pressures and climate outcomes.
Our changing climate. Understanding what is changing, how fast, and where, can help communities anticipate and respond to future change.
How our climate is changing: The effects of climate change can be widespread or localised, gradual or sudden, and affect many things at once.
Gradual changes include: warmer temperatures, rising sea levels, changes in rainfall, warming oceans.
Sudden events include: floods, drought, severe storms, wildfires, heatwaves.
Changes affect what we care about. Climate change disrupts natural environments and affects people and ecosystems unevenly. Climate change impacts are interconnected and can build up over time, affecting things like the economy, human health, infrastructure and the natural environment.
Our choices matter: Our choices affect emissions, land use and the condition of the environment. These choices can increase or reduce pressures on the climate, shaping future change. Choices include transport options, agricultural activities, infrastructure resilience, landfill management, energy sources, land-use practices, kaitiakitanga (environmental guardianship) and community knowledge.
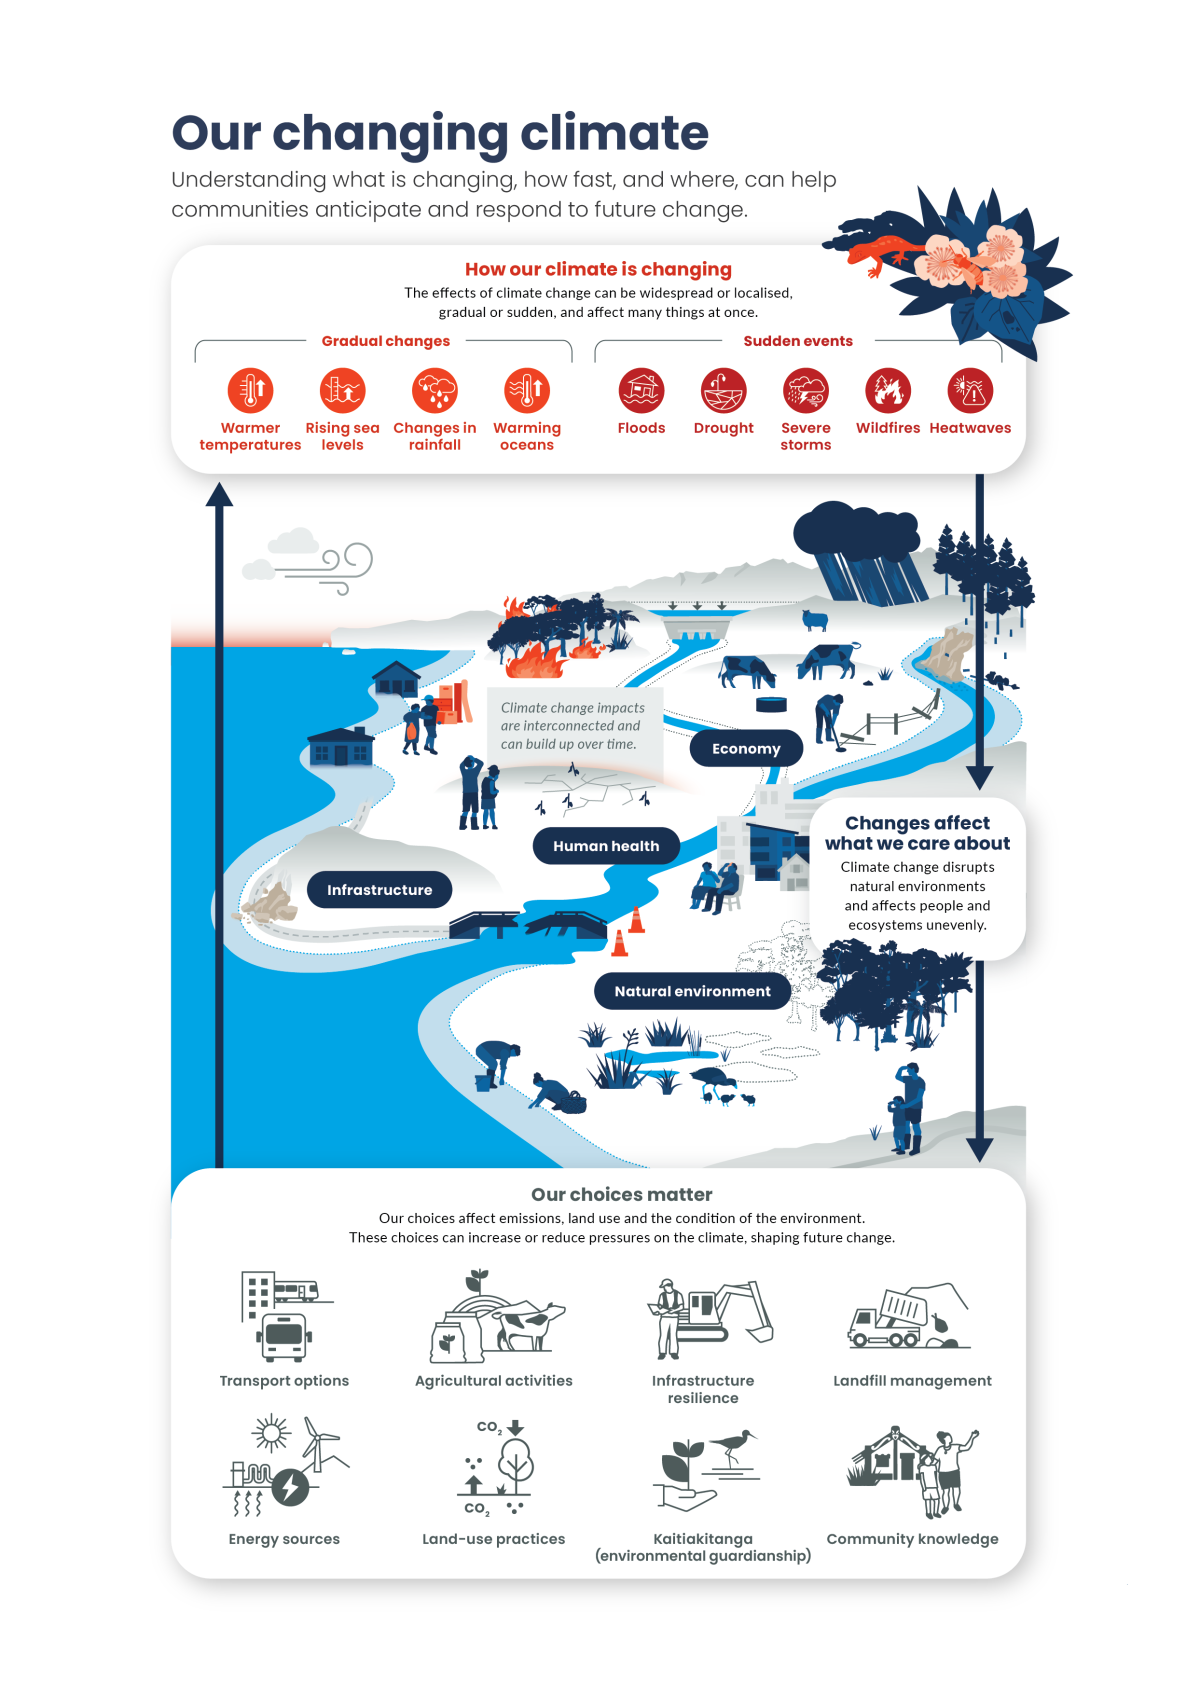
A full-page infographic. It shows that the climate is changing, that gradual changes and sudden events can affect the things we value, and that our choices influence future pressures and climate outcomes.
Our changing climate. Understanding what is changing, how fast, and where, can help communities anticipate and respond to future change.
How our climate is changing: The effects of climate change can be widespread or localised, gradual or sudden, and affect many things at once.
Gradual changes include: warmer temperatures, rising sea levels, changes in rainfall, warming oceans.
Sudden events include: floods, drought, severe storms, wildfires, heatwaves.
Changes affect what we care about. Climate change disrupts natural environments and affects people and ecosystems unevenly. Climate change impacts are interconnected and can build up over time, affecting things like the economy, human health, infrastructure and the natural environment.
Our choices matter: Our choices affect emissions, land use and the condition of the environment. These choices can increase or reduce pressures on the climate, shaping future change. Choices include transport options, agricultural activities, infrastructure resilience, landfill management, energy sources, land-use practices, kaitiakitanga (environmental guardianship) and community knowledge.
The climate we have known is becoming increasingly unreliable. Human activities are continuing to increase the concentration of greenhouse gases in the atmosphere. As these gases build up, they trap more heat and drive changes that affect temperatures, rainfall, sea levels and extreme weather. Carbon dioxide levels in the atmosphere are the highest they have been in around 4.1 to 4.5 million years (Lindsey, 2025), and global temperatures exceeded 1.5 degrees Celsius above pre-industrial (1850 to 1900) levels in 2024, with a 75 percent chance of mean global temperatures remaining above 1.5 degrees Celsius over the threshold between 2026 to 2030 (UN, n.d.; WMO, 2026).
These global changes are affecting Aotearoa New Zealand’s climate. They are being experienced through both gradual shifts, such as steadily rising temperatures and sea levels, and changes in the frequency and intensity of some extreme events. These changes vary across regions and seasons and interact with natural climate variability. As temperatures continue to rise, climate-related risks and impacts are expected to increase further. This section examines how New Zealand’s climate is changing, how those changes vary across the country, and what current evidence indicates about future change.
While the climate has been like this before, it is the ability of ecosystems and our society to adapt to the speed of this change that matters. It is crucial to understand what is changing, how fast, and where. This can help people and communities anticipate and respond to future change in our environment, society and economy.
Human activities, including emissions and land-use change, are continuing to increase concentrations of carbon dioxide and other heat-trapping greenhouse gases in the atmosphere. These changes are driving increases in temperatures across New Zealand.
Increased temperatures change weather patterns and rainfall. Some areas are expected to experience more rainfall and others less. Warming also interacts with global weather patterns such as the El Niño Southern Oscillation.
1 Note that the Paris Agreement target of limiting warming to 1.5 degrees Celsius is relative to pre-industrial conditions, rather than the 1995–2014 baseline used for New Zealand projections discussed here
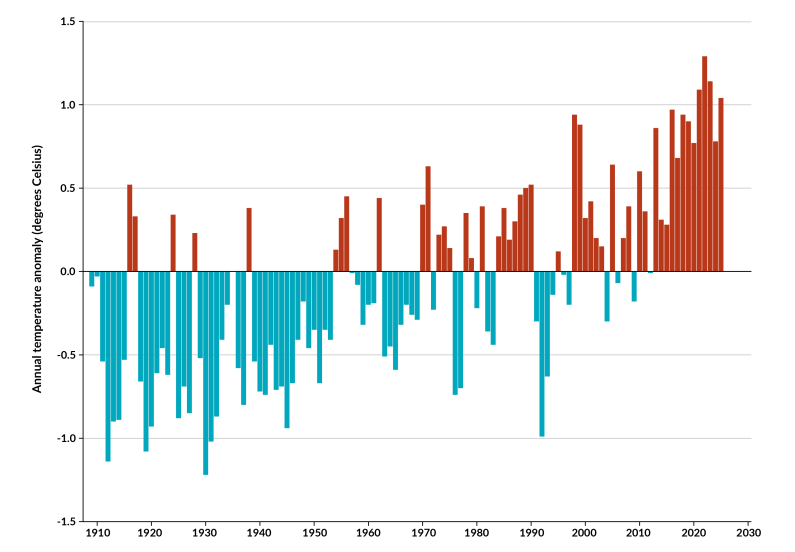
Image: Data source: Stats NZ, using data from Earth Sciences New Zealand
A bar chart showing New Zealand’s annual average temperature anomaly from 1909 to 2025. It shows annual temperature anomaly in degrees Celsius.
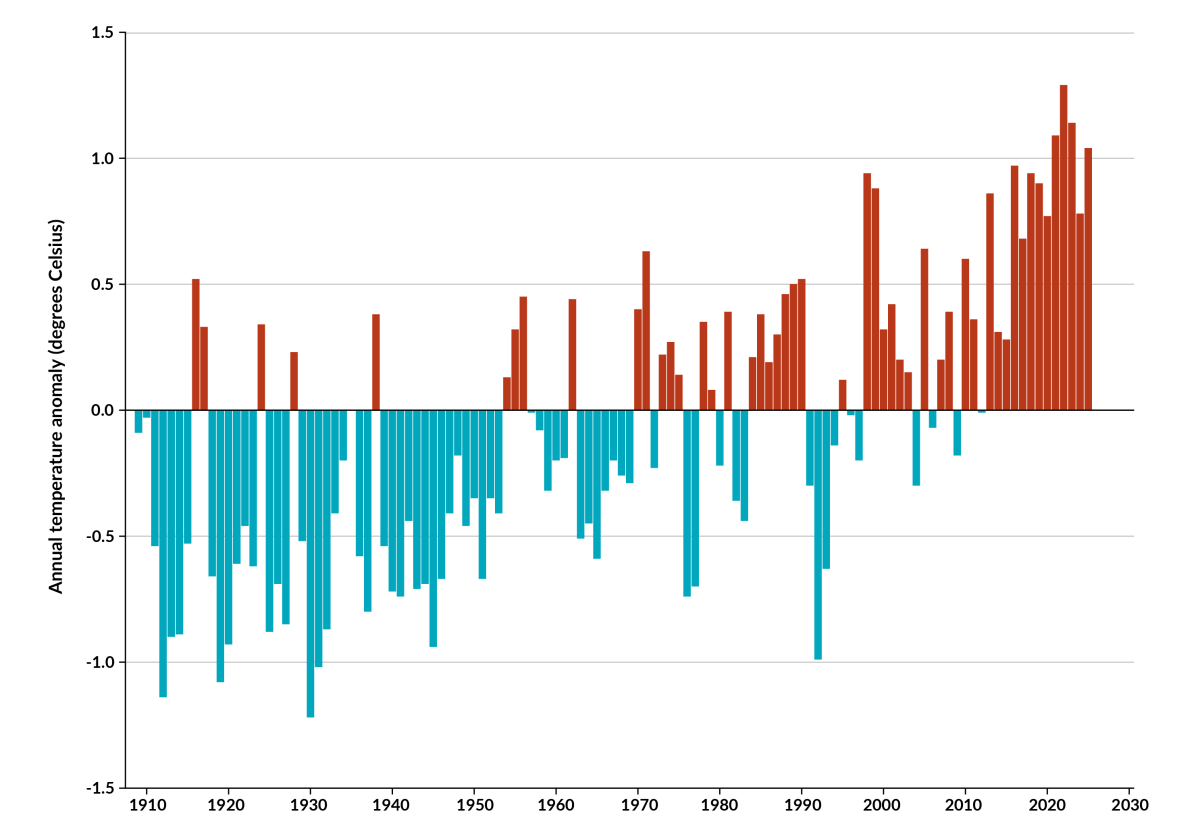
Image: Data source: Stats NZ, using data from Earth Sciences New Zealand
A bar chart showing New Zealand’s annual average temperature anomaly from 1909 to 2025. It shows annual temperature anomaly in degrees Celsius.
Note: The baseline for temperature anomalies is the average annual temperature for the 30 years from 1991 to 2020.
2 The ‘Roaring Forties’ is a belt of strong westerly winds in the Southern Hemisphere which generally occur between the latitudes of 40 and 49 degrees. As these winds are forced upwards by the Southern Alps and North Island ranges, heavy rainfall is dropped on the western coast of New Zealand, leaving the east coast typically drier (see indicator: Rainfall: Data to 2025).
The extra heat in the atmosphere is driving an increase in the likelihood of extreme weather events. Extreme rainfall, drought and wildfires have affected many parts of New Zealand in recent years. Future changes in extreme weather will vary between regions, with some areas projected to see more extreme events.
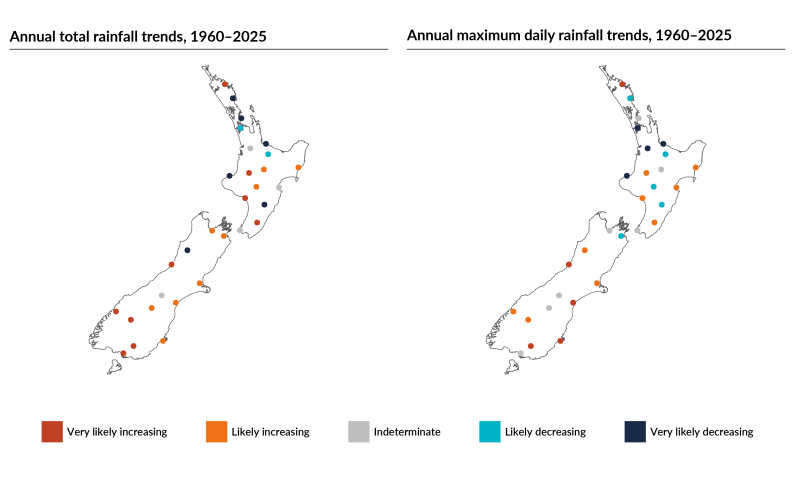
Image: Data source: Stats NZ, using data from Earth Sciences New Zealand
Two maps of New Zealand. The one on the left shows annual total rainfall trends from 1960 to 2025. The map on the right shows annual maximum daily rainfall trends for the same period.
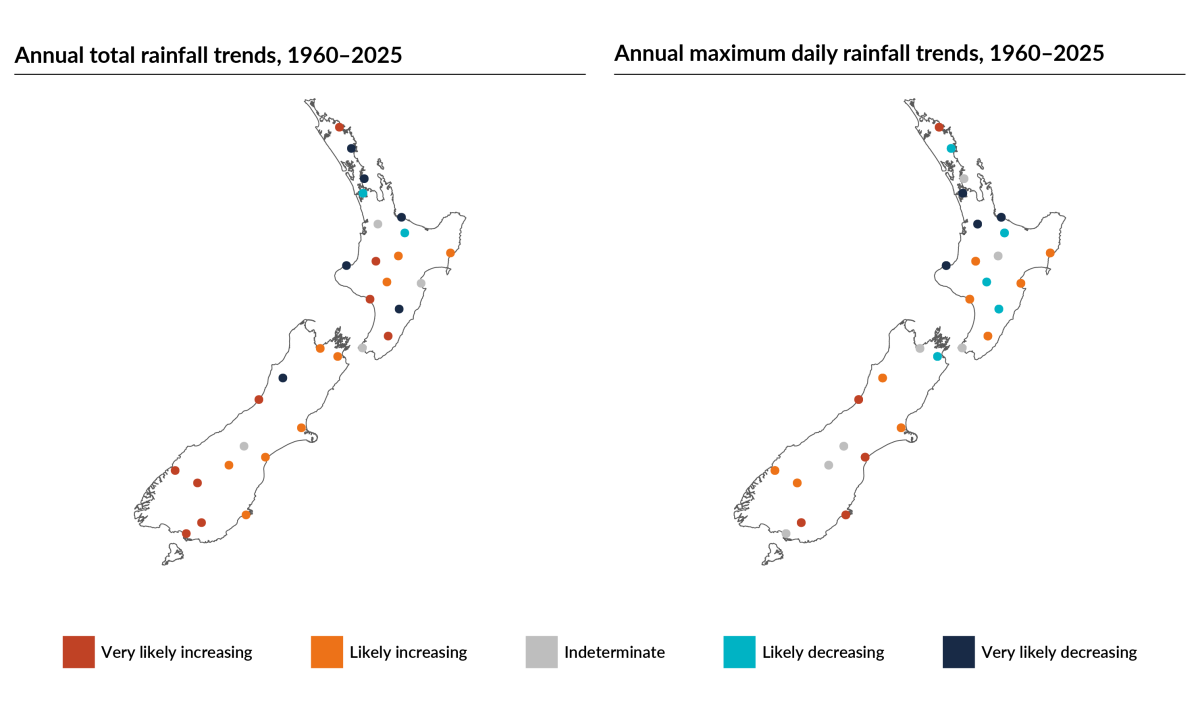
Image: Data source: Stats NZ, using data from Earth Sciences New Zealand
Two maps of New Zealand. The one on the left shows annual total rainfall trends from 1960 to 2025. The map on the right shows annual maximum daily rainfall trends for the same period.
Note: Annual total rainfall trends refer to information from the indicator: Rainfall: Data to 2025. Annual maximum daily rainfall trends refer to information from the indicator: Extreme rainfall: Data to 2025.
3 Agricultural drought is a medium-term event (6 months) that may impact crop production or livestock due to lack of soil moisture (NOAA, n.d.).
4 Uncertainty exists in modelling for future drought, since climate models cannot confidently determine whether New Zealand’s warm season will be wetter, which could offset drying, or drier, which could extend and intensify drought events (Gibson et al., 2024; Lewis et al., 2025b).
5 Around the country, 17 of 30 sites had sufficient data between 1980 and 2025 to allow maximum wind gust trends to be determined (see indicator: Extreme wind: Data to 2025).
6 Wildfire risk is reported as the average number of very high or extreme fire danger class days per year, using the New Zealand Fire Danger Rating System (see indicator: Wildfire risk: Data to 2023).
7 Atmospheric rivers are long, narrow regions in the atmosphere that transport significant quantities of water vapour, which often leads to substantial rainfall when they interact with the land (Waliser & Guan, 2017).
The changes to Aotearoa New Zealand’s climate described in section 1 are already affecting the natural environment and people’s health and wellbeing. The impacts are far-reaching and increasing, affecting communities in diverse ways. Some impacts emerge gradually as temperatures rise, rainfall patterns shift and sea levels increase. Others occur more abruptly through extreme events such as floods, droughts, wildfires and marine heatwaves. Together, these changes can alter ecosystems, affect species and increase risks to communities.
New Zealand’s unique ecosystems and native species are particularly vulnerable to changing climatic conditions and are facing increasing disruption. Climate change is already altering habitats and ecosystems across land, freshwater and marine environments, while extreme events can cause immediate damage and intensify existing pressures. This is projected to increase if global greenhouse gas emissions and temperatures continue to rise. Because the natural environment also supports much of our economy and wellbeing, these impacts can extend well beyond the ecosystems and species directly affected.
Degradation and loss of ecosystems and species are felt widely in our communities as we lose the benefits they provide us. New Zealanders have a close affinity with the environment and outdoor recreation, and climate change is affecting our ability to connect with nature. For many Māori, the transmission of mātauranga (Māori knowledge) and maintenance of reo (language), tikanga (customs and protocols) and identity are closely linked to te taiao (the environment), and these processes are being put at risk by environmental change.
Climate change affects human health both directly and indirectly. Higher temperatures can increase heat-related illness and mortality, while floods and other extreme events can increase risks of disease, psychological distress and disruption to the places and services that support wellbeing. These impacts are not distributed evenly, and people’s exposure and vulnerability vary across communities and locations.
This section looks at how climate change is impacting the natural environment, people’s connections with nature, and human health and wellbeing. Section 3 then discusses the related impacts to our economy, infrastructure, homes and livelihoods.
New Zealand has a large variety of native species that are found nowhere else, and the ecosystems they inhabit are vulnerable to disruption. Climate change is increasing risks to ecosystems, species and ecological processes across New Zealand, with impacts already being observed for some ecosystems and species. Environmental change is also reflected in changing ecological signals recognised through mātauranga Māori.
Warming temperatures affect where species can live and can make it easier for invasive species to thrive. Changes to weather patterns and the timing of seasons alter the life cycles of plants and animals, while more frequent extreme events such as storms and wildfires pose more immediate threats. The rate of climate change is also important, with some species and ecosystems less able than others to adapt to accelerating changes.
Climate change is driving changes to ecosystems that could increasingly affect our connections with the natural environment. For many Māori, the transmission of mātauranga and maintenance of reo, tikanga and identity are closely linked to te taiao. The loss of species and reduced access to places can disrupt cultural practices and wider systems of knowledge, relationships and culture. More broadly, the changes to natural spaces and loss of outdoor recreation opportunities result in a reduction of the benefits these places provide.
8 Hui held on marae where people who support the Kīngitanga (Māori King movement) demonstrate their loyalty, contribute to funds and discuss movement affairs.
Climate change has both direct and indirect impacts on people’s health. Rising temperatures result in more heat-related illnesses and can affect wellbeing through heat stress and overheating. Extreme weather events increase the incidence of infectious diseases and respiratory issues and have been linked with mental health impacts. Health impacts are not distributed evenly. Children are particularly vulnerable to heat stress. Māori communities can have higher baseline vulnerabilities and face a higher burden, particularly in rural and coastal areas.
The climate changes described in section 1, and their effects on natural systems and people, as described in section 2, are also affecting Aotearoa New Zealand’s economy, infrastructure, property and livelihoods. Some impacts develop gradually as temperatures rise, rainfall patterns shift, seas warm and sea levels increase. Others arise through sudden events such as floods, droughts, storms and landslides. These impacts can compound over time and spread across connected economic and infrastructure systems.
Major sectors of New Zealand’s economy, including agriculture, fisheries and tourism, depend on relatively stable environmental and climatic conditions. Rising temperatures, and changes to water availability, growing conditions and marine environments are already affecting some activities and are expected to create further risks. Not all changes will have the same effect in every place or sector, and some may create opportunities. However, working with changing and extreme conditions can involve uncertainty, disruption and costs.
Homes, businesses and essential infrastructure are also increasingly exposed to climate-related hazards. Damage to transport routes, electricity networks, water services and community facilities can have consequences beyond the assets directly affected. It can interrupt access to essential services, disrupt supply chains and livelihoods, and make it harder for communities to respond to and recover from ongoing extreme events. These effects are interconnected and can persist long after an event has passed.
The costs of climate impacts are not limited to disaster response and recovery. As risks increase, insurers are expected to respond through higher premiums and, in some cases, reduced availability of cover in high-risk locations. Evidence is increasingly showing that investing in risk reduction and adaptation before disasters occur is often less costly than repeated recovery afterwards.
This section will examine the impacts of climate change on our major economic sectors before considering the growing costs of climate-related hazards and the exposure of property, infrastructure and essential services.
Much of New Zealand’s economy is dependent on the environment. As the environment changes with a changing climate, many sectors face increasing risks. The agricultural sector could feel increased impacts from more droughts and storms. Temperature changes will affect where certain crops can be grown, and could expand the range of pests. Commercial fisheries are also being impacted, with projected increases for some fish stocks and declines for many others. Changes to ecosystems and damage to infrastructure is affecting the tourism industry, while insurance and financial services are under increasing pressure from repeated extreme events.
Much of our infrastructure was not designed for the level of natural hazard impacts we are already experiencing due to climate change. These impacts are projected to increase. Increasing numbers of homes and properties are exposed to flooding and landslides, putting people more at risk. The critical infrastructure – such as transport routes and marae – needed to respond to more frequent extreme events are also more vulnerable. Water supplies are often under pressure from drought, flooding and salt-water intrusion, and changes to agricultural production – both in New Zealand and globally – put our food security at risk.
9 The moderate climate scenario used here is defined in Horspool et al., 2026. It equates to SSP2-4.5.
10 Current exposure estimates for inland flooding and rainfall-induced landslides are based on 1 degree Celsius of warming above pre-industrial (1850 to 1900) levels, which current warming has already surpassed (He Pou a Rangi Climate Change Commission, 2026c).
11 Current exposure estimates for coastal flooding are based the 2005 midpoint of New Zealand sea-level rise relative to land for 1995 to 2024 (He Pou a Rangi Climate Change Commission, 2026c).
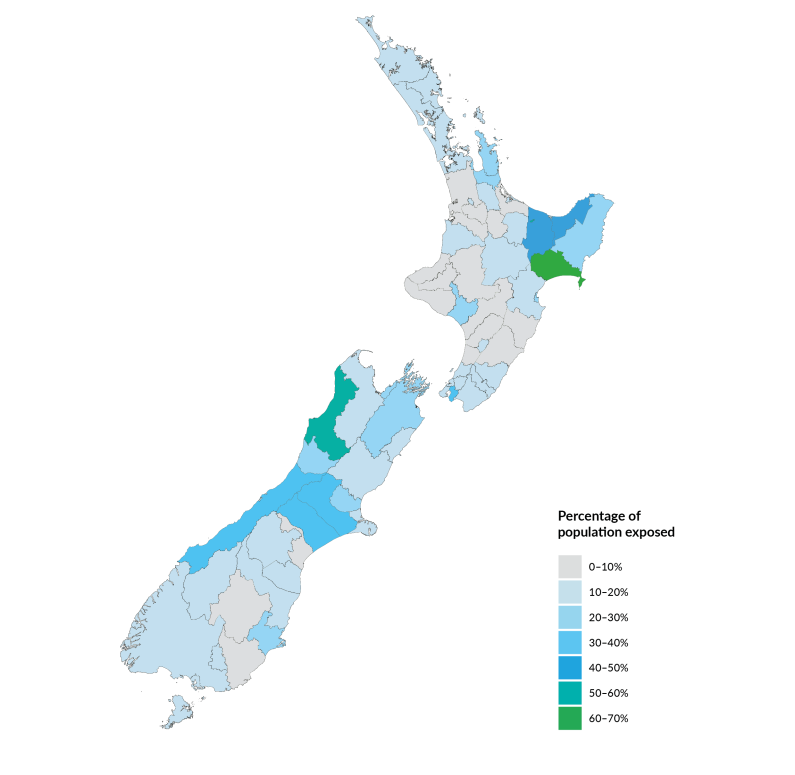
Image: Data source: He Pou a Rangi Climate Change Commission
A map of New Zealand, with each region shaded according to the percentage of people whose homes are currently exposed to a 1 percent annual likelihood inland flood event. The most exposed regions are Wairoa on the East Coast and Buller on the West Coast, followed by the eastern Bay of Plenty and the central South Island.
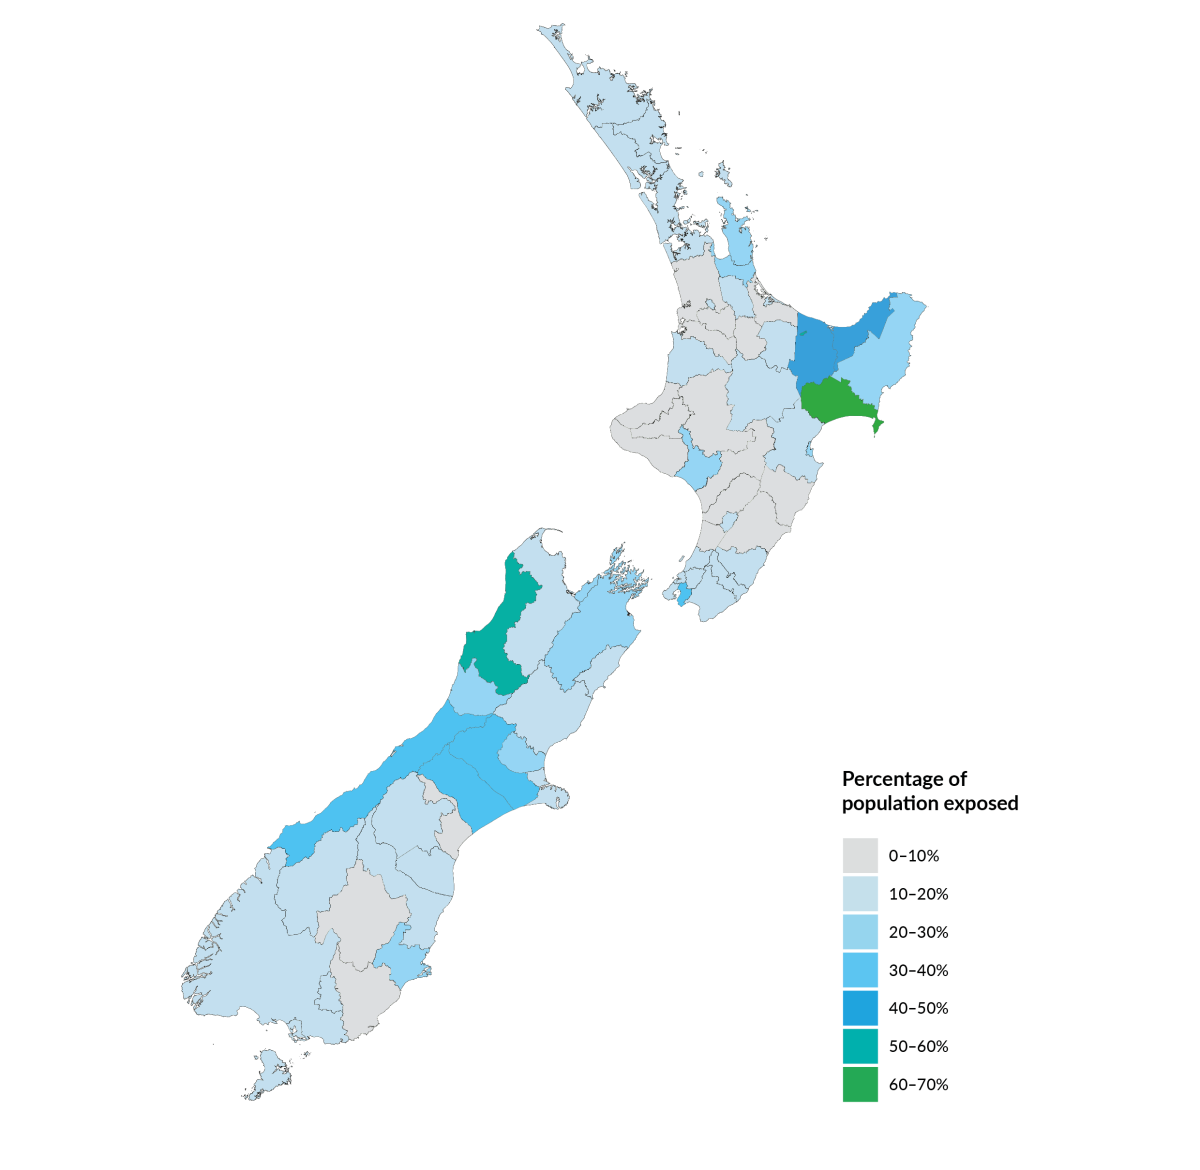
Image: Data source: He Pou a Rangi Climate Change Commission
A map of New Zealand, with each region shaded according to the percentage of people whose homes are currently exposed to a 1 percent annual likelihood inland flood event. The most exposed regions are Wairoa on the East Coast and Buller on the West Coast, followed by the eastern Bay of Plenty and the central South Island.
12 Current exposure estimates for inland flooding and rainfall-induced landslides are based on 1 degree Celsius warming above pre-industrial (1850 to 1900) levels, which current warming has already surpassed (He Pou a Rangi Climate Change Commission, 2026c).
13 The moderate climate scenario used here and in the remainder of this section is defined in Paulik et al., 2026. It equates to SSP2-4.5.
14 Current exposure estimates for shallow coastal groundwater are based the 2005 midpoint of New Zealand sea-level rise relative to land for 1995 to 2024 (He Pou a Rangi Climate Change Commission, 2026c).
15 Current exposure estimates for coastal flooding are based the 2005 midpoint of New Zealand sea-level rise relative to land for 1995 to 2024 (He Pou a Rangi Climate Change Commission, 2026c).
16 The projected 20 centimetres of relative coastal sea-level rise is above 2020 levels. This is projected to occur by 2045 (high climate scenario) to 2050 (low climate scenario), in places where it is not slowed by uplift or accelerated by subsidence (MfE, 2024b).
17 Current exposure estimates for essential services are based on a benchmark of 0 metres sea-level rise, which may not be directly comparable to the sea-level rise benchmark used for homes, water and transport infrastructure.
18 Current exposure estimates for inland flooding and rainfall-induced landslides are based on 1 degree Celsius warming above pre-industrial (1850 to 1900) levels, which current warming has already surpassed (He Pou a Rangi Climate Change Commission, 2026c).
19 Current coastal flooding exposure estimates for marae are based on a benchmark of 0 metres sea-level rise, which may not be directly comparable to the sea-level rise benchmark used for homes, power, water and transport infrastructure.
20 The benchmark used for current rainfall-induced landslide exposure estimates for marae may not be directly comparable to the benchmark used for homes, power, water and transport infrastructure.
As discussed in section 1, climate change is driven by the accumulation of greenhouse gases in the atmosphere. Section 2 and section 3 described how a changing climate is affecting Aotearoa New Zealand’s environment, communities and economy, and how future impacts are influenced by decisions we make about how and where we live, build and invest. This section focuses on another part of that story: New Zealand’s contribution to climate change through our greenhouse gas emissions, and the factors that influence the balance between emissions and removals.
While New Zealand’s contribution to global greenhouse gas emissions is small, our emissions per person are high. Greenhouse gas emissions arise from activities such as food production, energy generation, transport, housing and land management. At the same time, forests, wetlands and other ecosystems remove and store carbon from the atmosphere. Our emissions are reducing in some areas, but are stable or increasing in others.
The balance between greenhouse gas emissions and removals is shaped by the way New Zealand generates energy, produces food, develops settlements and manages land. These same decisions can also influence environmental conditions and future exposure to climate-related hazards. Changes in land use, for example, can affect carbon storage, ecosystem condition and the vulnerability of people, infrastructure and natural systems to a changing climate. This balance between emissions and removals is changing across different sectors of the economy.
Within te ao Māori (the Māori worldview), people and the environment are often understood as existing in relationship with one another across places and generations. This perspective recognises that the environmental pressures created today can affect the choices, opportunities and wellbeing of future generations. It highlights the importance of considering the long-term balance between human activities and the capacity of natural systems to sustain environmental and human wellbeing over time (Awatere et al., 2021a; 2026).
Greenhouse gas emissions generated in one country contribute to atmospheric concentrations, regardless of where they occur. Although New Zealand’s contribution to global emissions is small, our emissions per person are high, and reducing the impacts of climate change requires collective effort to reduce emissions. There is therefore opportunity for us to contribute to global efforts to reduce emissions. Understanding New Zealand’s contribution requires considering both our emissions and their place within the cumulative global emissions that are driving climate change.
New Zealand’s greenhouse gas emissions are changing across different sectors of the economy. Emissions have reduced in some areas as energy sources, livestock numbers, landfill management and forestry patterns have changed. In other areas, emissions remain stable or are increasing – particularly where transport demand, agricultural production, land-use change, and how and where people live continue to shape emissions and environmental conditions. Agriculture and energy (including transport) have dominated New Zealand’s gross emissions over the long term, producing more than 90 percent of our gross emissions in 2024 (MfE, 2026; see figure 4). This reflects the significant role that both sectors hold in New Zealand’s economy through export, employment and connectivity, and how the choices we make within these sectors can shape our emissions future.
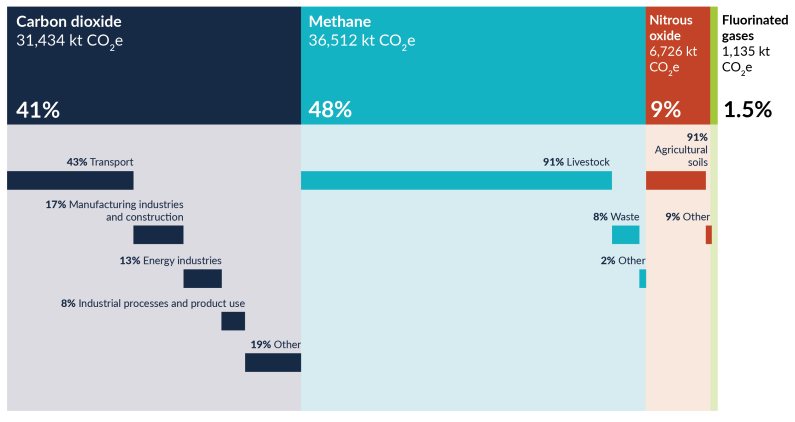
A percentage ribbon graph showing New Zealand’s gross greenhouse gas emissions by gas and sector of the economy in 2024. It shows both the percentage of total emissions and absolute amount of emissions in kilotonnes of carbon dioxide equivalent.
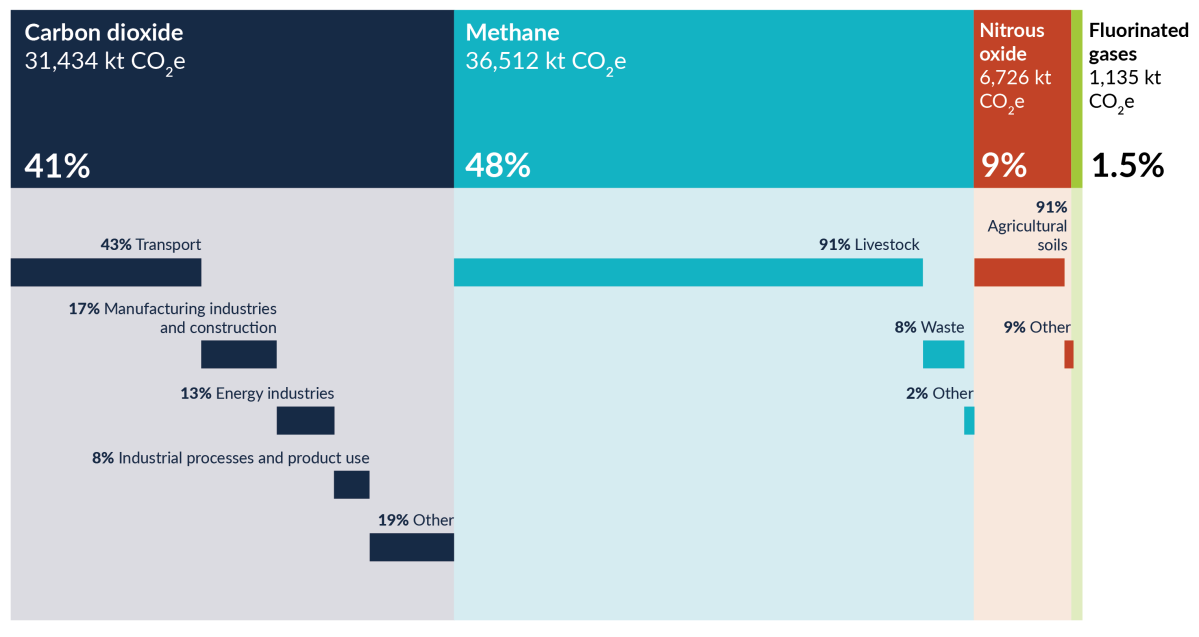
A percentage ribbon graph showing New Zealand’s gross greenhouse gas emissions by gas and sector of the economy in 2024. It shows both the percentage of total emissions and absolute amount of emissions in kilotonnes of carbon dioxide equivalent.
Note: Emissions presented here exclude emissions from Tokelau.
21 Annex I Parties include the industrialised countries that were members of the Organisation for Economic Co-operation and Development in 1992, plus countries with economies in transition, including the Russian Federation, the Baltic States, and several Central and Eastern European States (UNFCCC, n.d.).
Although agriculture, transport, energy, industry and waste are the main sources of greenhouse gas emissions, land use also influences the amount of greenhouse gases removed from the atmosphere. Together, emissions and removals determine New Zealand’s greenhouse gas balance. Many of these same land-use decisions can also influence exposure and vulnerability to climate-related hazards.
Land uses, such as forests, cropland, grassland, wetlands and settlements, either emit greenhouse gases into the atmosphere or remove it by acting as carbon sinks. When calculating greenhouse gas emissions this is referred to as the ‘land use, land-use change and forestry’ (LULUCF) sector. Land-use management and the impacts of human activities influence the potential of different land uses to be either a carbon sink or carbon source. Forest growth can offset emissions, but these benefits can be reduced depending on harvest rates and management practices. Wetlands are effective carbon stores, and this carbon is released to the atmosphere when they are drained (usually as carbon dioxide or methane).
Global scale pressures on the atmosphere and climate are driving the changes in Aotearoa New Zealand’s climate. This report described the current changes being observed and their impacts on people, communities, ecosystems and places. As the climate continues to change, understanding how these impacts may unfold over coming decades becomes increasingly important for adaptation planning and investment.
A better understanding of changing climate patterns, their consequences, and the ways people and natural systems may be affected can inform decision-making across a range of sectors. This section highlights where additional knowledge, data and evidence could improve our understanding of future climate risks and their implications for New Zealand. Three important areas of focus are strengthening our knowledge of future impacts, enhancing understanding of complex interactions across natural and social systems, and improving the quality and availability of decision-ready information about current and future changes.
While our understanding of climate change continues to improve, part of planning for future climate change includes making decisions despite inherent uncertainty. The following six knowledge gaps highlight important areas to improve our understanding of future impacts to New Zealand’s environment, communities and economy.
Climate impacts do not occur in isolation. The risks experienced by people and places are often shaped by interactions between environmental, cultural, social and economic systems. More research is needed on the connections and interactions between different areas of knowledge.
Improving our understanding of climate change depends not only on new research, but also on access to trusted, relevant and decision-ready information. Many of the questions identified in this section cannot be answered by a single dataset, model or research project.
Improving understanding of future climate change requires more than filling individual knowledge gaps. It also requires an environmental information system capable of connecting evidence across disciplines, scales and sectors, so that climate risks can be understood within the broader environmental, social and economic systems in which they occur. This will allow relationships between climate hazards, ecosystem condition, infrastructure, communities and places to be understood together.
A recent report by the Parliamentary Commissioner for the Environment highlights challenges associated with New Zealand's fragmented environmental information landscape (PCE, 2026). Information is often collected by different organisations, for different purposes, using different approaches. This can make it difficult to access, combine and apply evidence consistently when assessing future risks and opportunities.
As climate change continues, decision-makers will increasingly need access to information that is:
Climate projections, hazard maps, environmental monitoring, impact assessments and mātauranga Māori all contribute to understanding future climate risks. However, their value depends not only on their quality, but also on the ability to bring them together in ways that support interpretation and action.
Listed below are the environmental indicators incorporated in this report, including 13 updated indicators in bold:
The table below presents a summary of site data available from atmosphere and climate indicators supporting this release.
| Indicator | Site data |
| Atmospheric ozone: Data to 2025 | The annual average thickness of the ozone layer above Lauder in 2025 was 316 Dobson units – thicker than the average across the full measurement series from 1979–2025, which was 308 Dobson units. Upper-atmospheric ozone absorbs ultraviolet (UV) radiation from the sun, influencing the amount that reaches the Earth’s surface (see indicator: Atmospheric ozone: Data to 2025). |
| Drought and wet periods: Data to 2025 |
Of 30 sites, 20 had extreme dryness from 2016 to 2025, and 16 sites spent at least 25 percent of the time in medium-term drought.
|
| Extreme rainfall: Data to 2025 |
Extreme rainfall measures the highest amount of rainfall recorded in a single day each year and the percentage of annual rainfall from very wet days (days where daily rainfall exceeds a 95th percentile threshold).
|
| Extreme wind: Data to 2025 | For the 17 sites where trends could be assessed between 1980 and 2025, both the annual average of the daily maximum wind gust and annual maximum wind gust decreased at 13 sites, increased at 3 sites (Gisborne, New Plymouth and Queenstown), and were indeterminate at 1 site (see indicator: Extreme wind: Data to 2025). |
| Frost and growing degree days: Data to 2025 |
Trends in the number of growing degree days22 increased at 29 of 30 sites, and decreased at one site (Lake Tekapo) between 1972 and 2025.
|
| Rainfall: Data to 2025 | Average annual rainfall at 30 sites increased at 18 sites and decreased at 8 between 1960 and 2025. Four sites had indeterminate trends (see indicator: Rainfall: Data to 2025). |
| Sunshine hours: Data to 2025 | Between 2016 and 2025, Richmond (Tasman) received an average of 2,682 hours of bright sunshine each year – the highest among the 30 sites with sufficient data. Balclutha (Otago) received the lowest, with 1,686 hours each year on average. 22 of 30 sites received more than 2,000 average annual hours of bright sunshine (see indicator: Sunshine hours: Data to 2025). |
| UV intensity: Data to 2023 | Between 2004 and 2023, the average number of days each year with peak UV intensity at very high or extreme levels at the 5 sites being monitored were 137 in Leigh, 112 in Paraparaumu, 104 in Lauder, 94 in Christchurch, and 71 in Invercargill (see indicator: UV intensity: Data to 2023). |
22 Growing degree days estimate the length of the growing season for agriculture and horticulture. The measure counts the total number of degrees Celsius that the average temperature is above a base temperature (commonly 10 degrees Celsius) each day (see indicator: Frost and growing degree days: Data to 2025).
23 A frost day is when the minimum air temperature recorded is below 0 degrees Celsius. It refers to a temperature measured in an instrument screen 1.2 metres above the ground rather than a ‘ground frost’ (see indicator: Frost and growing degree days: Data to 2025).
This report was compiled by the Ministry for Cities, Environment, Regions and Transport and Stats NZ’s Environmental Reporting team.
We would like to thank the following for providing data and advice in the development of indicators used in this report:
We would like to thank the following people and organisations for providing advice and helping to shape this report:
We would like to thank the following people and organisations for providing advice and critical review of this report:
The infographic on page 9 was created by Dumpark Information Design.
Allen, S., Bell, R., & Forkink, A. (2023). Coastal realignment: Another coastal challenge. Policy Quarterly, 19(1), 50–57. https://doi.org/10.26686/pq.v19i1.8105
Allen, W., McCarthy, J., Jolly, B., Planzer, S., Sprague, R., Richardson, S., Baker, C., Graham, E., Mahlum, S., Hickford, M., Smith, B., Crawford, R., McArthur, N., & Beattie, A. (2024). Ecological impacts of Cyclone Gabrielle. Prepared for the Ministry of Business, Innovation and Employment by Manaaki Whenua – Landcare Research. https://www.landcareresearch.co.nz/assets/researchpubs/Cyclone_Gabrielle_Integrated_ecological_assessment_Full_report.pdf
Anderson, M. J., Conrow, L., Hobbs, M., Paulik, R., Blackett, P., & Logan, T. (2025a). Distributional justice and climate risk assessment: An analysis of disparities within direct and indirect risk. Risk Analysis, 45(11), 3354–3374. https://doi.org/10.1111/risa.17664
Anderson, M. J., Brunner, L., & Logan, T. (2025b). Functional isolation: The compounding burden on community capacity from cascading infrastructure failures and access disruption. International Journal of Disaster Risk Reduction, 118, 105190. https://doi.org/10.1016/J.IJDRR.2025.105190
Armstrong McKay, D. I., Staal, A., Abrams, J. F., Winkelmann, R., Sakschewski, B., Loriani, S., Fetzer, I., Cornell, S. E., Rockström, J., & Lenton, T. M. (2022). Exceeding 1.5°C global warming could trigger multiple climate tipping points. Science, 377(6611), eabn7950. https://doi.org/10.1126/science.abn7950
Auckland Transport. (2025). Climate Adaptation Framework and Action Plan 2025. Auckland Transport. https://at.govt.nz/media/iqebfs0r/at-climate-adaption-framework-and-action-plan.pdf
Ausseil, A.-G. E., Jamali, H., Clarkson, B.R., & Golubiewski, N.E. (2015). Soil carbon stocks in wetlands of New Zealand and impact of land conversion since European settlement. Wetlands Ecology and Management, 23, 947–961. https://doi.org/10.1007/s11273-015-9432-4
Awatere, S., King, D. N., Reid, J., Williams, L., Masters-Awatere, B., Harris, P., Tassell-Matamua, N., Jones, R., Eastwood, K., Pirker, J., & Jackson, A.-M. (2021a). He huringa āhuarangi, he huringa ao: A changing climate, a changing world. Te Arotahi, 7. Ngā Pae o te Māramatanga. https://www.maramatanga.ac.nz/te-arotahi-07
Awatere, S., Reid, J., Masters-Awatere, B., Tassell-Matamua, N., Eastwood, K., Jackson, A.-M., King, D. N., Williams, L., Harris, P., Jones, R., & Pirker, J. (2021b). He huringa āhuarangi, he huringa ao: a changing climate, a changing world. Manaaki Whenua – Landcare Research. https://www.landcareresearch.co.nz/assets/researchpubs/He-huringa-ahuarangi-he-huringa-ao-a-changing-climate-a-changing-world.pdf
Awatere, S., Harcourt, N., Kainamu, A., Forster, M., & Masters-Awatere, B. (2026). Ngā mea hirahira o te ao Māori: Climate change risks to the Māori domain, National Climate Change Risk Assessment (NCCRA) 2026. (Original work published 2025). Prepared for He Pou a Rangi Climate Change Commission by the New Zealand Institute for Bioeconomy Science Ltd. https://www.climatecommission.govt.nz/assets/Uploads/NCCRA/finals/2026-NCCRA-Climate-change-risks-to-Maori.pdf
Azizan, A., Venter, L., Jansen van Rensburg, P. J., Ericson, J. A., Ragg, N. L. C., & Alfaro, A. C. (2023). Metabolite changes of Perna canaliculus following a laboratory marine heatwave exposure: Insights from metabolomic analyses. Metabolites, 13(7), 815. https://doi.org/10.3390/metabo13070815
Bailey-Winiata, A. P., Gallop, S. L., Wotherspoon, L., Paulik, R., Winder-Murray, H., Billing, A., Conroy, E., Bennett, R., White, I., Ellis, J., & Fa‘aui, T. (2025). Increased exposure of marae to coastal flooding with sea level rise and adaptation learnings of Ngāi Tamawhariua and Maketū Iwi Collective. In C. A. Hendtlass, T. Fitzgerald, & A. Serrano (Eds.), Shoreline strategies: Embracing coastal transformation in Aotearoa New Zealand (pp. 29–36). New Zealand Coastal Society. https://www.coastalsociety.org.nz/assets/Uploads/files/SP6-reading-version.pdf
Bas, M., Ouled-Cheikh, J., Julià, L., Fuster-Alonso, A., March, D., Ramírez, F., Cardona, L., & Coll, M. (2024). Fish and tips: Historical and projected changes in commercial fish species’ habitat suitability in the Southern Hemisphere. Science of the Total Environment, 948, 174752. https://doi.org/10.1016/j.scitotenv.2024.174752
Behrens, E., Dunn, M. R., Holmes, S. J., & Cummings, V. J. (2025). Marine heatwaves and fisheries in Aotearoa New Zealand: Observed and projected temperature anomalies and potential impacts by fisheries management area. New Zealand Aquatic Environment and Biodiversity Report No. 351. Fisheries New Zealand. https://fs.fish.govt.nz/Doc/25860/AEBR-351-2025-Marine-heatwaves-and-fisheries-in-Aotearoa-New-Zealand.pdf.ashx
Bell, J. J., Micaroni, V., Strano, F., Ryan, K. G., Mitchell, K., Mitchell, P., Wilkinson, S., Thomas, T., Bachtiar, R., & Smith, R. O. (2024). Marine heatwave-driven mass mortality and microbial community reorganisation in an ecologically important temperate sponge. Global Change Biology, 30, e17417. https://doi.org/10.1111/gcb.17417
Berghan, J. (2021). Kaupapakāinga: The potential for Māori cohousing. Prepared for Building Better Homes, Towns and Cities: Affordable Housing for Generations. Building Better Homes. https://www.buildingbetter.nz/wp-content/uploads/2023/08/Berghan_2021_kaupapakainga_potential_for_maori_cohousing.pdf
Bird, L. J., Bodeker, G. E., & Clem, K. R. (2023). Sensitivity of extreme precipitation to climate change inferred using artificial intelligence shows high spatial variability. Communications Earth & Environment, 4(1), 469. https://doi.org/10.1038/s43247-023-01142-4
Bodeker, G., Cullen, N., Katurji, M., McDonald, A., Morgenstern, O., Noone, D., Renwick, J., Revell, L. & Tait, A. (2022). Aotearoa New Zealand climate change projections guidance: Interpreting the latest IPCC WG1 report findings. Report number CR 501. Prepared for the Ministry for the Environment. https://environment.govt.nz/assets/publications/Climate-Change-Projections-Guidance-FINAL.pdf
Boffa Miskell. (2020, May 5). The Big Dry: what drought means for our indigenous biodiversity. Boffa Miskell. https://www.boffamiskell.co.nz/news-insights/the-big-dry-what-drought-means-for-our-indigenous-biodiversity
Booker, D. J., & Whitehead, A. L. (2022). River water temperatures are higher during lower flows after accounting for meteorological variability. River Research and Applications, 38(1), 3–22. https://doi.org/10.1002/RRA.3870
Bose, D., & Becken, S. (2024). Tourism-related economic loss and damage from the North Island weather events on New Zealand conservation land and waters. Journal of Outdoor Recreation and Tourism, 46, 100767. https://doi.org/10.1016/j.jort.2024.100767
Bosserelle, A. L., & Hughes, M. W. (2024). Practitioner perspectives on sea-level rise impacts on shallow groundwater: Implications for infrastructure asset management and climate adaptation. Urban Climate, 58, 102195. https://doi.org/10.1016/J.UCLIM.2024.102195
Broadbent, A. M., Gibson, P. B., Sood, A., Rampal, N., & Stuart, S. J. (2024). How do New Zealand’s downscaled CMIP6 climate projections compare with CMIP5? Weather and Climate, 44(1), 2–24. https://doi.org/10.2307/27384325
Brook, M. S., & Nicoll, C. (2024). Brief report of fatal rainfall-triggered landslides from record-breaking 2023 storms in Auckland, New Zealand. Landslides, 21(7), 1581–1589. https://doi.org/10.1007/s10346-024-02258-0
Brumby, A., Marshall, J., Murray, T., O’Donnell, C., & Richards, R. (2025). Trait-based climate change vulnerability assessments of terrestrial taxa in Aotearoa New Zealand. Science for Conservation 343. Department of Conservation. https://www.doc.govt.nz/globalassets/documents/science-and-technical/science-for-conservation/343-climate-change-taxa/sfc343.pdf
Buck, M. (2025). Living on the edge: How do perceptions of coastal erosion risk affect residential mobility decisions? Local Environment, 30(10), 1279–1293. https://doi.org/10.1080/13549839.2025.2467868
Bukvic, A., Whittemore, A., Gonzales, J., & Wilhelmi, O. (2022). Understanding relocation in flood-prone coastal communities through the lens of place attachment. Applied Geography, 146, 102758. https://doi.org/10.1016/J.APGEOG.2022.102758
Cameron, N. A., & Peer, R. A. M. (2025). Quantifying water use in New Zealand’s dairy food system: A baseline for future sustainability. Agricultural Systems, 225, 104272. https://doi.org/10.1016/j.agsy.2025.104272
Campbell, R., Beresford, R., Turner, R., Carey-Smith, T., & FitzHerbert, S. (2025). Potential climate change impacts on myrtle rust risk in Aotearoa/New Zealand. Plant Pathology, 74(5), 1426–1441. https://doi.org/10.1111/ppa.14104
Canning, A. D., Zammit, C., & Death, R. G. (2025). The implications of climate change for New Zealand’s freshwater fish. Canadian Journal of Fisheries and Aquatic Sciences, 82, 1–15. https://doi.org/10.1139/cjfas-2024-0127
Carrivick, J. L., Sutherland, J. L., Huss, M., Purdie, H., Stringer, C. D., Grimes, M., James, W. H. M., & Lorrey, A. M. (2022). Coincident evolution of glaciers and ice-marginal proglacial lakes across the Southern Alps, New Zealand: Past, present and future. Global and Planetary Change, 211, 103792. https://doi.org/10.1016/j.gloplacha.2022.103792
Case, B., Hall, D., Day, N., Hermans, S., & Buckley, H. (2023). What is the role of biodiversity in mediating the effects of climate change on New Zealand’s future agroecosystems? New Zealand Economic Papers, 57(2), 139–143. https://doi.org/10.1080/00779954.2023.2191613
Charlson, F., Ali, S., Benmarhnia, T., Pearl, M., Massazza, A., Augustinavicius, J., & Scott, J. G. (2021). Climate change and mental health: A scoping review. International Journal of Environmental Research and Public Health, 18(9), 4486. https://www.mdpi.com/1660-4601/18/9/4486
Chen, Z., O’Sullivan, K. C., Pierse, N., Ericson, E., & Stephenson, K. (2025). Exploring health and wellbeing impacts of summer indoor overheating on public housing tenants: A mixed-methods study in Wellington, New Zealand. Energy and Buildings, 347, Part B, 116296. https://doi.org/10.1016/j.enbuild.2025.116296
Ciais, P., Sabine, C., Bala, G., Bopp, L., Brovkin, V., Canadell, J., Chhabra, A., DeFries, R., Galloway, J., Heimann, M., Jones, C., Le Quéré, C., Myneni, R., Piao, S., & Thornton, P. (2013). Carbon and other biogeochemical cycles. In T. F. Stocker, D. Qin, G.-K. Plattner, M. Tignor, S. K. Allen, J. Boschung, A. Nauels, Y. Xia, V. Bex, & P. M. Midgley (Eds.), Climate Change 2013: The Physical Science Basis. Contribution of Working Group I to the Fifth Assessment Report of the Intergovernmental Panel on Climate Change. Cambridge University Press. https://www.ipcc.ch/site/assets/uploads/2018/02/WG1AR5_Chapter06_FINAL.pdf
Collins, D. B. G. (2020). New Zealand river hydrology under late 21st century climate change. Water, 12(8), 2175. https://doi.org/10.3390/W12082175
Collins, D. B. G. (2021). Hydrological sentinels and the relative emergence of climate change signals in New Zealand river flows. Hydrological Sciences Journal, 66(15), 2146–2154. https://doi.org/10.1080/02626667.2021.1987439
Cook, K. M., Dunn, M. R., Behrens, E., Pinkerton, M. H., Law, C. S., & Cummings, V. J. (2025). The impacts of marine heatwaves on ecosystems and fisheries in Aotearoa New Zealand. New Zealand Journal of Marine and Freshwater Research, 59(5), 1530–1560. https://doi.org/10.1080/00288330.2024.2436661
Cornwall, C. E., Nelson, W. A., Aguirre, J. D., Blain, C. O., Coyle, L., D’Archino, R., Desmond, M. J., Hepburn, C. D., Liggins, L., Shears, N. T., & Thomsen, M. S. (2025). Predicting the impacts of climate change on New Zealand’s seaweed-based ecosystems. New Zealand Journal of Botany, 63(1), 1–27. https://doi.org/10.1080/0028825X.2023.2245786
Cram, F. (2021). Mahi aroha: Māori work in times of trouble and disaster as an expression of a love for the people. Kōtuitui: New Zealand Journal of Social Sciences Online, 16(2), 356–370. https://doi.org/10.1080/1177083X.2021.1879181
Crockett D.E., & Kearns, M.P. (1975). Northern little blue penguin mortality in Northland. Notornis, 22(1), 69–72. https://doi.org/10.63172/415892ygifvc
Cummings, V. J., Lundquist, C. J., Dunn, M. R., Francis, M., Horn, P., Law, C., Pinkerton, M. H., Sutton, P., Tracey, D., Hansen, L., & Mielbrecht, E. (2021). Assessment of potential effects of climate-related changes in coastal and offshore waters on New Zealand’s seafood sector. New Zealand Aquatic Environment and Biodiversity Report No. 261. Fisheries New Zealand. https://fs.fish.govt.nz/Doc/24891/AEBR-261-Assessment-Of-Potential-Effects-Of-Climate-Change-On-Seafood-Sector-3389.pdf.ashx
Datta, S., Beran, H., & Rogers, A. (2024). The impacts of warming on shallow and deep-water fisheries in New Zealand. Earth’s Future, 12(12), e2024EF004857. https://doi.org/10.1029/2024ef004857
Davis-Jones, C. (2025). Climate change effects on marine habitats: Literature review and guidance document. SLR Project No.: 810.031203.00001. Prepared for the Bay of Plenty Regional Council by SLR Consulting New Zealand. https://atlas.boprc.govt.nz/api/v1/edms/document/BOPRC-1864443702-56484/content
Debsharma, N., Gibson, P. B., Harrington, L. J., & Lewis, H. (2026). Quantifying the influence of soil moisture on recently observed heat extremes in a maritime climate: A New Zealand case study. Climate Dynamics, 64, 241. https://doi.org/10.1007/s00382-026-08175-3
DOC (Department of Conservation). (2021). New Zealanders and the environment. Domestic customer segmentation research: New Zealanders engaging with the environment, biodiversity and conservation. Department of Conservation. https://www.doc.govt.nz/globalassets/documents/about-doc/role/visitor-research/nzers-and-the-environment.pdf
DOC (Department of Conservation). (2025a). Climate change adaptation action plan 2025–28. Department of Conservation. https://www.doc.govt.nz/globalassets/documents/our-work/climate-change/climate-change-adaptation-action-plan-2025-28.pdf
DOC (Department of Conservation). (2025b). DOC visitor insights: Summer 2024/2025. A look at visitor activity and experiences outdoors over peak summer 2024/2025. Department of Conservation. https://www.doc.govt.nz/globalassets/documents/about-doc/role/visitor-research/understanding-2024-2025-summer-activity.pdf
Douglas, E. J., Bulmer, R. H., MacDonald, I. T., & Lohrer, A. M. (2022). Estuaries as coastal reactors: Importance of shallow seafloor habitats for primary productivity and nutrient transformation, and impacts of sea level rise. New Zealand Journal of Marine and Freshwater Research, 56(3), 553–569. https://doi.org/10.1080/00288330.2022.2107027
Dymond, J. R., Sabetizade, M., Newsome, P. F., Harmsworth, G. R., & Ausseil, A. -G. (2021). Revised extent of wetlands in New Zealand. New Zealand Journal of Ecology, 45(2), 3444. https://doi.org/10.20417/nzjecol.45.32
Earth Sciences New Zealand. (n.d.). The impact of El Niño and La Niña on New Zealand’s climate. Retrieved August 26, 2026, from https://niwa.co.nz/climate-and-weather/el-nino-and-la-nina/impact-el-nino-and-la-nina-new-zealands-climate
Earth Sciences New Zealand. (2026a, January 8). Annual climate summary: 2025: New Zealand’s 4th-warmest year on record. Earth Sciences New Zealand. https://niwa.co.nz/climate-and-weather/annual/annual-climate-summary-2025
Earth Sciences New Zealand. (2026b, July 2). El Niño declared, expected to intensify into one of the strongest on record. https://niwa.co.nz/news/el-nino-declared-expected-intensify-one-strongest-record
EDGAR (The Emissions Database for Global Atmospheric Research). (2026). EDGAR GHG emissions [Dataset] available from GHG emissions of all world countries. https://edgar.jrc.ec.europa.eu/report_2026
EHINZ (Environmental Health Intelligence New Zealand). (2025). Leptospirosis notifications. [Surveillance Report]. Environmental Health Intelligence NZ, Massey University. https://ehinz.ac.nz/assets/Surveillance-reports/Released_2025/Lepto_2025final.pdf
EHINZ (Environmental Health Intelligence New Zealand). (n.d.). Urban–rural profile. Retrieved September 16, 2026, from https://www.ehinz.ac.nz/indicators/population-vulnerability/urbanrural-profile/
Ericson, J. A., Venter, L., Copedo, J. S., Nguyen, V. T., Alfaro, A. C., & Ragg, N. L. C. (2023). Chronic heat stress as a predisposing factor in summer mortality of mussels, Perna canaliculus. Aquaculture, 564, 738986. https://doi.org/10.1016/j.aquaculture.2022.738986
FENZ (Fire and Emergency New Zealand). (n.d.). Wildfire readiness and prevention: Spot the signs, stop wildfire. Retrieved September 16, 2026, from https://www.fireandemergency.nz/fire-safety-campaign-resources/wildfire-readiness-and-prevention/
Gibson, P. B., Broadbent, A. M., Stuart, S. J., Lewis, H., Campbell, I., Rampal, N., Harrington, L. J., & Williams, J. (2025a). Downscaled CMIP6 future climate projections for New Zealand: Climatology and extremes. Weather and Climate Extremes, 49, 100784. https://doi.org/10.1016/j.wace.2025.100784
Gibson, P. B., Lewis, H., Campbell, I., Rampal, N., Fauchereau, N., & Harrington, L. J. (2025b). Downscaled climate projections of tropical and ex-tropical cyclones over the southwest Pacific. Journal of Geophysical Research: Atmospheres, 130(14), e2025JD043833. https://doi.org/10.1029/2025jd043833
Gibson, P. B., Rampal, N., Dean, S. M., & Morgenstern, O. (2024). Storylines for future projections of precipitation over New Zealand in CMIP6 models. Journal of Geophysical Research: Atmospheres, 129(5), e2023JD039664. https://doi.org/10.1029/2023JD039664
Gibson, P. B., Rampal, N., Goddard, F. W., Guan, B., DeFlorio, M. J., & Prince, H. D. (2026). Emerging trends in landfalling atmospheric rivers over the South Pacific. npj Climate and Atmospheric Science, 9, 63. https://doi.org/10.1038/s41612-026-01338-3
Gibson, P. B., Stone, D., Thatcher, M., Broadbent, A., Dean, S., Rosier, S. M., Stuart, S., & Sood, A. (2023). High-resolution CCAM simulations over New Zealand and the South Pacific for the detection and attribution of weather extremes. Journal of Geophysical Research: Atmospheres, 128(14), e2023JD038530. https://doi.org/10.1029/2023jd038530
The GlaMBIE Team. (2025). Community estimate of global glacier mass changes from 2000 to 2023. Nature, 639, 382–388. https://doi.org/10.1038/s41586-024-08545-z
Goddard, F. W., Gibson, P. B., & Rampal, N. (2025). High-resolution climate change projections of atmospheric rivers over the South Pacific. Journal of Geophysical Research: Atmospheres, 130(6), e2024JD041572. https://doi.org/10.1029/2024jd041572
Goodman, J.M. (2018). Conservation, ecology and management of migratory galaxiids and the whitebait fishery: A summary of current knowledge and information gaps. Department of Conservation. https://www.doc.govt.nz/globalassets/documents/conservation/land-and-freshwater/freshwater/conservation-ecology-and-management-of-migratory-galaxiids.pdf
Goodrich, J. P., Pronger, J., Campbell, D. I., Glover-Clark, G. L., Price, R., Mudge, P., Wyatt, J., Robertson, H., Wall, A. M., Wheatley-Wilson, A., & Schipper, L. A. (2025). Large greenhouse gas emissions from drained peatlands in New Zealand, and the climate mitigation potential of rewetting. Mires and Peat, 32, 29. https://doi.org/10.19189/001c.147886
Greenhough, H., Vignier, J., Smith, K. F., Brown, C. M., Kenny, N. J., & Rolton, A. (2025). Multi-stressor dynamics: Effects of marine heatwave stress and harmful algal blooms on juvenile mussel (Perna canaliculus) survival and physiology. Science of the Total Environment, 964, 178590. https://doi.org/10.1016/j.scitotenv.2025.178590
Griffiths, G. (2011). Drivers of extreme daily rainfalls in New Zealand. Weather and Climate, 31, 24–49. https://doi.org/10.2307/26169716
Grout, L., Hales, S., Thornley, L., & Wilson, N. (2022). An exploration of the human health impacts associated with seven decades of severe weather events in Aotearoa New Zealand: The need for better data. University of Otago Wellington. https://www.otago.ac.nz/__data/assets/pdf_file/0027/332865/an-exploration-of-the-human-health-impacts-associated-with-seven-decades-of-severe-weather-events-in-aotearoa-new-zealand-the-need-for-better-data-report-841638.pdf
Hall, M., Bargh, M., Tēmara, T., Ross, M., Skerrett, M., Shedlock, K., McRae, H., Thomson, R., Potangaroa, R., Mulligan, R., & North, L. (2024). He Pā Mataora – learning to live with the Living Pā: final report. Report to the National Science Challenge Deep South. Te Herenga Waka | Victoria University of Wellington. https://deepsouthchallenge.co.nz/wp-content/uploads/2024/09/He-Pa-Mataora-Learning-to-live-with-the-Living-Pa-Final-Report.pdf
Hamilton, A., Fountain, J., Stewart, E., & Espiner, S. (2025). Māori-led tourism and climate change impacts and adaptation: Perspectives from Westland Tai Poutini National Park, New Zealand. Australian Journal of Emergency Management, 40(2), 30–38. https://doi.org/10.47389/40.2.39
Harrington, L. J., Rosier, S. M., Marsh, T. I., & Frame, D. J. (2024). Robust changes to the wettest and driest days of the year are hidden within annual rainfall projections: A New Zealand case study. Environmental Research Letters, 19(7), 074057. https://doi.org/10.1088/1748-9326/ad585a
He Pou a Rangi Climate Change Commission. (n.d.). FAQs: The context for Aotearoa New Zealand. Retrieved September 16, 2026, from https://www.climatecommission.govt.nz/exploring-the-issues/aotearoa-context/
He Pou a Rangi Climate Change Commission. (2026a). Exposure to climate-related hazards workbook [Worksheet]. Earth Sciences New Zealand: National Climate Hazard Exposure Census. https://www.climatecommission.govt.nz/assets/Monitoring-and-reporting/NAPPA-2026/Exposure-to-climate-related-hazards-workbook.xlsx
He Pou a Rangi Climate Change Commission. (2026b). Full assessment: 2026 national climate change risk assessment for Aotearoa New Zealand. He Pou a Rangi Climate Change Commission. https://www.climatecommission.govt.nz/assets/Uploads/NCCRA/finals/2026-NCCRA-Full-assessment.pdf
He Pou a Rangi Climate Change Commission. (2026c). National insights relevant for adaptation planning: Metrics on exposure and vulnerability to climate-related hazards. He Pou a Rangi Climate Change Commission. https://www.climatecommission.govt.nz/assets/Monitoring-and-reporting/NAPPA-2026/National-insights-relevant-for-adaptation-planning.pdf
He Pou a Rangi Climate Change Commission. (2026d). Progress report: national adaptation plan. Assessing progress on the implementation and effectiveness of the Government’s first national adaptation plan. Second Progress Report. He Pou a Rangi Climate Change Commission. https://www.climatecommission.govt.nz/assets/Uploads/CCC-6270-NAPPA-2026_FA_WEB-2807.pdf
Hill, A., North, C., Cosgriff, M., Irwin, D., Boyes, M., & Watson, S. (2020). Education outside the classroom in Aotearoa New Zealand. A comprehensive national study: Final report. Ara Institute of Canterbury Ltd. https://eonzpublic.blob.core.windows.net/online/EOTC_in_Aotearoa_New_Zealand_Final_Report-2020.pdf
Horspool, N.A., Paulik, R., & Griffiths, N. (2026). Estimating national-scale losses to infrastructure from natural hazards: Phase 2 – future climate scenarios, regional disaggregation and flooding impacts on buildings. GNS Science Consultancy Report 2026/07. Prepared for the New Zealand Infrastructure Commission Te Waihanga by Earth Sciences New Zealand. https://media.umbraco.io/te-waihanga-30-year-strategy/0bweckkr/cr2026-07-national-scale-loss-estimates-to-infrastructure-phase-2-final.pdf
Huang, W., Yang, Z., Zhang, Y., Vogt, T., Armstrong, B., Yu, W., Xu, R., Yu, P., Liu, Y., Gasparrini, A., Hundessa, S., Lavigne, E., Molina, T., Geiger, T., Guo, Y. L., Otto, C., Hales, S., Pourzand, F., Pan, S. -C., … Collaborators, M. C. C. (2024a). Tropical cyclone-specific mortality risks and the periods of concern: A multicountry time-series study. PLoS Medicine, 21(1), e1004341. https://doi.org/10.1371/journal.pmed.1004341
Huang, W., Vogt, T., Park, J., Yang, Z., Ritchie, E. A., Xu, R., Zhang, Y., Hales, S., Yu, W., Hundessa, S., Otto, C., Yu, P., Liu, Y., Ju, K., Lavigne, E., Ye, T., Wen, B., Wu, Y., Kliengchuay, W., … Guo, Y. (2024b). Risks of infectious disease hospitalisations in the aftermath of tropical cyclones: A multi-country time-series study. The Lancet Planetary Health, 8(9), e629–e639. https://doi.org/10.1016/s2542-5196(24)00158-x
Hudson, M. (2022, July 7). Māori hold a third of NZ’s fishing interests, but as the ocean warms and fish migrate, these rights don’t move with them. The Conversation. https://theconversation.com/maori-hold-a-third-of-nzs-fishing-interests-but-as-the-ocean-warms-and-fish-migrate-these-rights-dont-move-with-them-186284
ICNZ (Insurance Council of New Zealand). (n.d.). Cost of natural disasters. Retrieved 16 September, 2026, from https://www.icnz.org.nz/industry/cost-of-natural-disasters/
IEA (International Energy Agency). (2025). Renewables 2025: Analysis and forecasts to 2030. International Energy Agency. https://iea.blob.core.windows.net/assets/76ad6eac-2aa6-4c55-9a55-b8dc0dba9f9e/Renewables2025.pdf
IPCC (Intergovernmental Panel on Climate Change). (2022). Chapter 11: Australasia. Climate change 2022: Impacts, adaptation and vulnerability. Working Group II contribution to the sixth assessment report of the Intergovernmental Panel on Climate Change. Intergovernmental Panel on Climate Change. https://www.ipcc.ch/report/ar6/wg2/chapter/chapter-11/
Jayawardena, I. (2024). Indigenous, ethnic, and racial diversity and climate justice: New Zealand’s climate adaptation policies and policy approaches. Environmental Research: Climate, 3, 035004. https://doi.org/10.1088/2752-5295/ad50fd
Johnson, D., Fisher, K., & Parsons, M. (2024). Resistance, resurgence, and wellbeing: Climate change loss and damages from the perspective of Māori women. Environment and Planning E: Nature and Space, 7(3), 1318–1364. https://doi.org/10.1177/25148486231217891
Johnson, D., Harrison, S., Cattoën, C., Luttrell, J., & Blackett, P. (2025). ‘That still haunts me a little bit’: Decision-makers and information providers’ experiences of recurring flood events. International Journal of Disaster Risk Reduction, 118, 105216. https://doi.org/10.1016/j.ijdrr.2025.105216
Johnson, D., Parsons, M., & Fisher, K. (2023a). Adaptation at whose expense? Explicating the maladaptive potential of water storage and climate-resilient growth for Māori women in northern Aotearoa. Global Environmental Change, 82, 102733. https://doi.org/10.1016/j.gloenvcha.2023.102733
Johnson, D., Blackett, P., Allison, A. E. F., & Broadbent, A. M. (2023b). Measuring social vulnerability to climate change at the coast: Embracing complexity and context for more accurate and equitable analysis. Water, 15(19), 3408. https://doi.org/10.3390/w15193408
Jones, R. G., Bennett, H., Keating, G., & Blaiklock, A. (2014). Climate change and the right to health for Māori in Aotearoa/New Zealand. Health and Human Rights Journal, 16(1), 54–68. https://researchspace.auckland.ac.nz/server/api/core/bitstreams/b3e09a9e-4b88-48c1-8594-d04a8ff58703/content
Jones, B. D., Collings, B., Dickson, M. E., Ford, M., Hikuroa, D., Bickler, S. H., & Ryan, E. (2024a). Regional implementation of coastal erosion hazard zones for archaeological applications. Journal of Cultural Heritage, 67, 430–442. https://doi.org/10.1016/j.culher.2024.04.007
Jones, B. D., Dickson, M. E., Ford, M., Hikuroa, D., & Ryan, E. J. (2024b). Aotearoa New Zealand’s coastal archaeological heritage: A geostatistical overview of threatened sites. Journal of Island & Coastal Archaeology, 19(4), 657–677. https://doi.org/10.1080/15564894.2023.2207493
Jones, R., Macmillan, A., & Woodward, A. (2023). Superheated storms: Climate drivers, health effects and responses. New Zealand Medical Journal, 136(1573), 8–11. https://doi.org/10.26635/6965.e1573
Kamal, S., & Noy, I. (2023). Impact of droughts on farms’ financing choices: Empirical evidence from New Zealand. Weather, Climate, and Society, 15(1), 121–132. https://doi.org/10.1175/wcas-d-21-0193.1
Keegan, L. J., White, R. S. A., & Macinnis-Ng, C. (2022). Current knowledge and potential impacts of climate change on New Zealand’s biological heritage. New Zealand Journal of Ecology, 46(1), 3467. https://doi.org/10.20417/nzjecol.46.10
Kerr, J., Thomson, G., & Wilson, N. (2023). Cyclone Gabrielle joins list of Aotearoa NZ’s ‘sudden mass fatality events’. PHCC (Public Health Communication Centre Aotearoa). https://www.phcc.org.nz/briefing/cyclone-gabrielle-joins-list-aotearoa-nzs-sudden-mass-fatality-events
King, D. N. T., Goff, J., & Skipper, A. (2007). Māori environmental knowledge and natural hazards in Aotearoa‐New Zealand. Journal of the Royal Society of New Zealand, 37(2), 59–73. https://doi.org/10.1080/03014220709510536
King, D., Penny, G., & Severne, C. (2010). The climate change matrix facing Māori society. In R.A.C. Nottage, D. S. Wratt, J. F. Bornman, & K. Jones (Eds.), Climate Change Adaptation in New Zealand: Future Scenarios and Some Sectoral Pers
Kitzberger, T., Perry, G. L. W., Paritsis, J., Gowda, J. H., Tepley, A. J., Holz, A., & Veblen, T. T. (2016). Fire–vegetation feedbacks and alternative states: Common mechanisms of temperate forest vulnerability to fire in southern South America and New Zealand. New Zealand Journal of Botany, 54(2), 247–272. https://doi.org/10.1080/0028825X.2016.1151903
Kozal, L. C., Hofmann, G. E., Hawes, N. A., & Ragg, N. L. C. (2024). Paternal heat exposure affects progeny larval development in green-lipped mussels Perna canaliculus. Aquaculture Environment Interactions, 16, 43–57. https://doi.org/10.3354/AEI00472
Krishna, N., Kingston, D. G., & Mager, S. M. (2024). Climatology and trends of atmospheric water vapour transport in New Zealand. Theoretical and Applied Climatology, 155, 7757–7772. https://doi.org/10.1007/s00704-024-05072-9
Kropač, E., Mölg, T., & Cullen, N. J. (2025). From sea to summit: Investigating the explicit role of SST increase for regional and high-altitude climates in New Zealand. Journal of Geophysical Research: Atmospheres, 130(15), e2025JD043572. https://doi.org/10.1029/2025jd043572
Lacheheb, M., Noy, I., & Kahui, V. (2024). Marine heatwaves and commercial fishing in New Zealand. Science of the Total Environment, 954, 176558. https://doi.org/10.1016/j.scitotenv.2024.176558
Lai, H., Lee, J. E., Harrington, L. J., Ahuriri-Driscoll, A., Newport, C., Bolton, A., Salter, C., Morton, S., Woodward, A., & Hales, S. (2024). Daily temperatures and child hospital admissions in Aotearoa New Zealand: Case time series analysis. International Journal of Environmental Research and Public Health, 21(9), 1236. https://doi.org/10.3390/ijerph21091236
Lan, C., Wild, A., Paulik, R., Wotherspoon, L., & Zorn, C. (2023). Assessing indirect impacts of extreme sea level flooding on critical infrastructure. Journal of Marine Science and Engineering, 11(7), 1420. https://doi.org/10.3390/jmse11071420
Lee, F., Kusabs, I. A. K., Perry, G. L. W., & MacNeil, C. (2025). Identifying refugia from the synergistic threats of climate change and invasive species. Web Ecology, 25(2), 221–239. https://doi.org/10.5194/we-25-221-2025
Lettink, M., & Monks, J. M. (2019). Ecology of scree skinks (Oligosoma waimatense) in O Tu Wharekai Wetland, mid-Canterbury high country, New Zealand. New Zealand Journal of Ecology, 43(1), 3354. https://doi.org/10.20417/nzjecol.43.6
Lewis, H., Harrington, L. J., Gibson, P. B., & Rampal, N. (2025a). Faster-than-expected intensification of heat extremes in a maritime climate: A New Zealand case study. Environmental Research Letters, 20(10), 104017. https://doi.org/10.1088/1748-9326/adfe80
Lewis, H., Harrington, L. J., Gibson, P. B., & Rampal, N. (2025b). Storylines of future drought in the face of uncertain rainfall projections: A New Zealand case study. Earth System Dynamics, 16(5), 1557–1568. https://doi.org/10.5194/esd-16-1557-2025
Lilburne, L., Ausseil, A. -G., Sood, A., Guo, J., Teixeira, E., Vetharaniam, I., van der Weerden, T., Smith, H., Neverman, A., Cichota, R., Phillips, C., Johnson, P., Thomas, S., & Dynes, R. (2025). Modelling to identify direct risks for New Zealand agriculture due to climate change. Journal of the Royal Society of New Zealand, 55(6), 1683–1700. https://doi.org/10.1080/03036758.2024.2393295
Lindsey, R. (2025, May 21). Climate change: Atmospheric carbon dioxide. NOAA Climate.gov. https://www.climate.gov/news-features/understanding-climate/climate-change-atmospheric-carbon-dioxide
Lu, S., Noy, I., & Stone, D. (2026). Heat exposure and mortality in Aotearoa New Zealand: A time-stratified case-crossover study [Working paper]. Munich Society for the Promotion of Economic Research – CESifo GmbH. https://doi.org/10.65864/3hbxvskrk8
Lyver, P. O’B., Carpenter, J. K., Wardle, D. A., Richardson, S. J., Tahi, B., Carson, D. B., & Timoti, P. (2025). Māori practitioner knowledge indicates a shift in forest fruit biomass and phenology over 75 years. New Zealand Journal of Ecology, 49(1), 3622. https://doi.org/10.20417/nzjecol.49.3622
Madera, F., Olcese, M., Cardinali, P., & Migliorini, L. (2025). Nature connectedness in adolescents and young adults: A systematic review. Journal of Environmental Psychology, 107, 102761. https://doi.org/10.1016/j.jenvp.2025.102761
Macinnis-Ng, C., & Schwendenmann, L. (2015). Litterfall, carbon and nitrogen cycling in a southern hemisphere conifer forest dominated by kauri (Agathis australis) during drought. Plant Ecology, 216, 247–262. http://dx.doi.org/10.1007/s11258-014-0432-x
Mahuta, R., & van Schravendijk-Goodman, C. (Eds.). (2024). Eating with my tuupuna: Practices, kai and haakari of Poukai, Waikato. Deep South National Science Challenge. Swamp Frog Environmental and Tree Consultants Ltd. https://deepsouthchallenge.co.nz/wp-content/uploads/2024/11/Eating-with-my-Tuupuna_Full-Handbook.pdf
Mahuta, R., van Schravendijk-Goodman, C., Holland, P., Harrison, S., Rolleston-Gabel, T., Johnson, D., Yang, W., Blackett, P., Connolly, J., Kerridge, D., Manukau, T., Rika-Heke, M., Te Ao, B., Te Ao, P., Flavell, K., & Fear, A. (2025). Measuring climate change impacts on Indigenous sociocultural wellbeing: Case study of Te Puuaha o Waikato. In C. A. Hendtlass, T. Fitzgerald, & A. Serrano (Eds.), Shoreline strategies: Embracing coastal transformation in Aotearoa New Zealand (pp. 21–27). New Zealand Coastal Society. https://www.coastalsociety.org.nz/assets/Uploads/files/SP6-reading-version.pdf
Masters-Awatere, B., Young, P., & Graham, R. (2022). State agencies and researchers engaging with Indigenous communities on climate change adaptation planning: A systematic review. MAI Journal, 11(1), 3–17. https://www.journal.mai.ac.nz/system/files/Masters-Awatere_0_0.pdf
MBIE (Ministry of Business, Innovation & Employment) (2025). Domestic visitor survey (DVS): October 2025 wave topline report. Ministry of Business, Innovation & Employment. https://www.mbie.govt.nz/dmsdocument/31751-domestic-visitor-survey-october-2025-wave-report
McClutchie, J., Thorpe, H., Raroa, D., Maxwell, H., Barbara, H., Laking, G., & Caddie, M. (2026). Indigenous-led community research in a changing climate: Impacts of Cyclone Gabrielle on the health and wellbeing of Māori in Te Tairāwhiti, Aotearoa New Zealand. Alternative-an International Journal of Indigenous Peoples, 22(1), 76–89. https://doi.org/10.1177/11771801251404025
McGlone, M., & Walker, S. (2011). Potential effects of climate change on New Zealand’s terrestrial biodiversity and policy recommendations for mitigation, adaptation and research. Science for Conservation 312. Department of Conservation. https://www.doc.govt.nz/documents/science-and-technical/sfc312entire.pdf
Mediodia, H. J., Noy, I., & Kahui, V. (2024). The impact of ocean warming on selected commercial fisheries in New Zealand. Australian Journal of Agricultural and Resource Economics, 68(3), 587–607. https://doi.org/10.1111/1467-8489.12564
Melia, N., Dean, S., Pearce, H. G., Harrington, L., Frame, D. J., & Strand, T. (2022). Aotearoa New Zealand’s 21st-Century Wildfire Climate. Earth’s Future, 10(6), e2022EF002853. https://doi.org/10.1029/2022EF002853
MfE (Ministry for the Environment). (n.d.). New Zealand’s interactive emissions tracker. Ministry for the Environment. Retrieved September 16, 2026, from https://emissionstracker.environment.govt.nz/#NrAMBoEYF12TwCIByBTALo2wBM4eg4As2AzPoSXAJxJbRA
MfE (Ministry for the Environment). (2018). Climate change projections for New Zealand: Atmospheric projections based on simulations undertaken from the IPCC 5th Assessment, 2nd Edition. Ministry for the Environment. https://environment.govt.nz/assets/Publications/Files/Climate-change-projections-2nd-edition-final.pdf?v=ee05f63ea287d390662906cfbf39ed7061b30df6
MfE (Ministry for the Environment). (2021). Methane and other major greenhouse gases. Ministry for the Environment. https://environment.govt.nz/guides/methane-and-other-major-greenhouse-gases/
MfE (Ministry for the Environment). (2024a). Climate projections insights. Ministry for the Environment. https://environment.govt.nz/facts-and-science/climate-change/climate-change-projections/climate-projections-insights-and-publications/
MfE (Ministry for the Environment). (2024b). Coastal hazards and climate change guidance. Ministry for the Environment. https://environment.govt.nz/publications/coastal-hazards-and-climate-change-guidance/
MfE (Ministry for the Environment). (2026). New Zealand’s Greenhouse Gas Inventory 1990–2024. Ministry for the Environment. https://environment.govt.nz/publications/new-zealands-greenhouse-gas-inventory-19902024
Middleton, I., Francis, M., Aguirre, J. D., Struthers, C., Trnski, T., Duffy, C., Anderson, J., Carney, M., Cox, N., Hemstalk, S., Herbert, B., Johnston, C., Middleton, C., Oldfield, T., Robinson, R., Sheath, C., Skipworth, I., Stancich, J., Whittington, H., & Liggins, L. (2023). Occurrences of tropical, subtropical and rare marine fishes in Aotearoa New Zealand indicate biodiversity change. Journal of Biogeography, 50(9), 1490–1504. https://doi.org/10.1111/jbi.14677
Ministerial Inquiry into Land Uses in Tairawhiti and Wairoa. (2023). Outrage to optimism: Report of the ministerial inquiry into land uses associated with the mobilisation of woody debris (including forestry slash) and sediment in Tairawhiti/Gisborne District and Wairoa District. Ministry for the Environment. https://environment.govt.nz/assets/Outrage-to-Optimism-CORRECTED-17.05.pdf?v=f5ae78144282d25d9eb270c146e7721f99f8f203
MOH (Ministry of Health). (2024). Health national adaptation plan 2024–2027. Ministry of Health. https://www.health.govt.nz/system/files/2024-10/Health%20National%20Adaptation%20Plan%202024-2027_0.pdf
Montie, S., & Thomsen, M. S. (2023). Long-term community shifts driven by local extinction of an iconic foundation species following an extreme marine heatwave. Ecology and Evolution, 13(6), e10235. https://doi.org/10.1002/ece3.10235
Mouton, T. L., Leprieur, F., Floury, M., Stephenson, F., Verburg, P., & Tonkin, J. D. (2022). Climate and land-use driven reorganisation of structure and function in river macroinvertebrate communities. Ecography, 2022(3), e06148. https://doi.org/10.1111/ECOG.06148
Muznebin, F., Alfaro, A. C., Venter, L., & Young, T. (2022). Acute thermal stress and endotoxin exposure modulate metabolism and immunity in marine mussels (Perna canaliculus). Journal of Thermal Biology, 110, 103327. https://doi.org/10.1016/J.JTHERBIO.2022.103327
NEMA (National Emergency Management Agency). (n.d.). Declared states of emergency. National Emergency Management Agency. Retrieved September 16, 2026, from https://www.civildefence.govt.nz/emergency-events/previous-emergencies/declared-states-of-emergency
Neverman, A. J., Donovan, M., Smith, H. G., Ausseil, A. -G., & Zammit, C. (2023). Climate change impacts on erosion and suspended sediment loads in New Zealand. Geomorphology, 427, 108607. https://doi.org/10.1016/j.geomorph.2023.108607
New Zealand Gazette. (2026, March 18). Government Inquiry into the Fatal Landslides in Tauranga. Retrieved September 23, 2026, from https://gazette.govt.nz/notice/id/2026-go1496
New Zealand Infrastructure Commission. (n.d.). Land transport. Retrieved September 16, 2026, from https://tewaihanga.govt.nz/national-infrastructure-plan-online/sector-summaries/land-transport
New Zealand Infrastructure Commission. (2026). When waters rise: Climate change, regional risk and infrastructure investment. New Zealand Infrastructure Commission | Te Waihanga. https://media.umbraco.io/te-waihanga-30-year-strategy/1gpbqo4v/te-waihanga-research-insights-series-flood-protection-cover-report.pdf
NIWA (National Institute of Water & Atmospheric Research). (2024, January 10). Annual New Zealand Climate Summary: 2023. National Institute of Water & Atmospheric Research. https://niwa.co.nz/climate-and-weather/annual/annual-climate-summary-2023
NIWA (National Institute of Water & Atmospheric Research). (2025, January 2025). Annual climate summary: 2024. National Institute of Water & Atmospheric Research. https://niwa.co.nz/climate-and-weather/annual/annual-climate-summary-2024
NOAA (National Oceanic and Atmospheric Administration). (n.d.). Definition of drought. National Centers for Environmental Information. Retrieved September 16, 2026, from https://www.ncei.noaa.gov/access/monitoring/dyk/drought-definition
NZ SeaRise. (n.d.). Vertical land movement. NZ SeaRise | Our Changing Coast. Retrieved July 15, 2026, from https://searise.nz/resources/digging-deeper/vertical-land-movement/
Nyce, C., Dumm, R., Sirmans, G. S., & Smersh, G. (2015). The capitalization of insurance premiums in house prices. The Journal of Risk and Insurance, 82(4), 891–919. https://doi.org/10.1111/jori.12041
Orsman, B. (2020, July 7). Auckland’s drought crisis costed at $224m for extra water. NZ Herald. https://www.nzherald.co.nz/nz/aucklands-drought-crisis-costed-at-224m-for-extra-water/O3VQYRJFECGOGSVIZXNEY6ITOQ/
Paul-Burke K., Ngarimu-Cameron R., Burke J., Bulmer R., Cameron K., O’Brien T., Bluett C., Ranapia M. (2022). Taura kuku: Prioritising Māori knowledge and resources to create biodegradable mussel spat settlement lines for shellfish restoration in Ōhiwa Harbour. New Zealand Journal of Marine and Freshwater Research, 56(3): 570–584. https://doi.org/10.1080/00288330.2022.2111447
Paulik, R., Wild, A., Stephens, S., Welsh, R., & Wadhwa, S. (2023). National assessment of extreme sea-level driven inundation under rising sea levels. Frontiers in Environmental Science, 10, 1045743. https://doi.org/10.3389/fenvs.2022.1045743
Paulik, R., Powell, J., Sturman, J., Broadbent, A., Scheele, F., Horspool, N., Dickson, M., Beale, T., Walbran, G., & Stephens, S. (2026). National climate hazard exposure census. Prepared for He Pou a Rangi Climate Change Commission by New Zealand Institute for Earth Science Limited. https://haveyoursay.climatecommission.govt.nz/comms-and-engagement/cc2f075f/user_uploads/national-climate-hazard-exposure-census---16032026---final.pdf
PCE (Parliamentary Commissioner for the Environment). (2026). Unlocking New Zealand’s environmental information. Parliamentary Commissioner for the Environment. https://pce.parliament.nz/media/cwingehl/unlocking-new-zealand-s-environmental-information_july-2026_digital.pdf
Perry, G. L. W., Wilmshurst, J. M., & McGlone, M. S. (2014). Ecology and long-term history of fire in New Zealand. New Zealand Journal of Ecology, 38(2), 157–176. https://newzealandecology.org/nzje/3198
Phillips, C., & Murphy, C. (2021). Solastalgia, place attachment and disruption: Insights from a coastal community on the front line. Regional Environmental Change, 21, 46. https://doi.org/10.1007/s10113-021-01778-y
Phillips, C., Murphy, C., & Bresnihan, P. (2022). The impacts of and responses to place loss in a coastal community in Ireland. Local Environment, 27(7), 879–896. https://doi.org/10.1080/13549839.2022.2078294
Pinkerton, M. H., Gall, M., Thoral, F., Sutton, P., & Wood, S. (2024). Monitoring ocean health: Satellite indicators for surface temperature, productivity and suspended solids. Prepared for Ministry for the Environment by National Institute of Water & Atmospheric Research. https://doi.org/10.13140/RG.2.2.29646.27208
Pourzand, F. (2023). Regional differences in the effects of drought events on farm profitability in New Zealand. Environmental Hazards, 22(3), 285–308. https://doi.org/10.1080/17477891.2022.2141180
Powlesland, R. (1998). Gull and tern survey. OSNZ News, 88, 3–9. https://www.birdsnz.org.nz/wp-content/uploads/2021/12/OSNZnews88_Sep1998.pdf
PwC (PricewaterhouseCoopers). (n.d.). The Aotearoa Circle tourism sector climate change scenarios. PwC. Retrieved September 16, 2026, from https://www.pwc.co.nz/insights-and-publications/2023-publications/aotearoa-circle-tourism-sector-climate-change-scenarios.html
Queen, L. E., Dean, S., Stone, D., Henderson, R., & Renwick, J. (2023). Spatiotemporal trends in near-natural New Zealand river flow. Journal of Hydrometeorology, 24(2), 241–255. https://doi.org/10.1175/jhm-d-22-0037.1
Rajan, P., Natraj, P., Kim, M., Lee, M., Jang, Y. J., Lee, Y. J., & Kim, S. C. (2024). Climate change impacts on and response strategies for kiwifruit production: A comprehensive review. Plants 13(17), 2354. https://doi.org/10.3390/plants13172354
RBNZ (Reserve Bank of New Zealand). (2024). Financial stability report May 2024. Reserve Bank of New Zealand. https://www.rbnz.govt.nz/-/media/project/sites/rbnz/files/publications/financial-stability-reports/2024/may-2024/fsr-may-24.pdf
Renwick, J. (2026, April 20). An ‘ordinary’ storm with extraordinary impacts: What made Wellington’s deluge so intense?. The Conversation. https://theconversation.com/an-ordinary-storm-with-extraordinary-impacts-what-made-wellingtons-deluge-so-intense-281016
Renwick, J., Anderson, B., Greenaway, A., Ngaru King, D., Mikaloff-Fletcher, S., Reisinger, A., & Rouse, H. (2016). Climate change implications for New Zealand. The Royal Society of New Zealand. https://www.royalsociety.org.nz/assets/documents/Climate-change-implications-for-NZ-2016-report-web3.pdf
Resilience to Nature’s Challenges. (2024). Food Systems Security and Disaster Recovery [Policy brief]. Resilience to Nature’s Challenges National Science Challenge. https://resiliencechallenge.nz/wp-content/uploads/Food-Security-and-Disaster-Recovery-Policy-Brief-FINAL.pdf
Richardson, S. J., King, S., Rose, A. B., McGlone, M. S., & Holdaway, R. J. (2018). Post-fire recovery of a dryland forest remnant in the Wither Hills, Marlborough. New Zealand Journal of Ecology, 42(2), 222–228. https://doi.org/10.20417/nzjecol.42.16
Roach, C. J., Jeffs, A. G., van der Reis, A. L., de Souza, J.M.A.C., & Behrens, E. (2025). Deep-sea lobster shifts in distribution and population connectivity under future climate change. New Zealand Journal of Marine and Freshwater Research, 59(5), 1659–1677. https://doi.org/10.1080/00288330.2025.2510307
Rosier, S. M., Bodeker, G. E., Carey-Smith, T. K., Frame, D. J., Gibson, P. B., Harrington, L. J., & Stone, D. A. (2024). Changing rainfall extremes with climate change in New Zealand: Guidance for decision-makers. The Deep South National Science Challenge. https://deepsouthchallenge.co.nz/wp-content/uploads/2024/08/Changing-rainfall-extremes-wiht-climate-change-in-NZ_Guidance-for-Decision-makers.pdf
Rosier, S., Shah, S., Bodeker, G., Carey-Smith, T., Frame, D., & Stone, D. A. (2025). Statistical modelling of extreme daily rainfall over Aotearoa New Zealand. Weather and Climate Extremes, 49, 100799. https://doi.org/10.1016/j.wace.2025.100799
Ross, F., Clark, D. E., Albot, O., Berthelsen, A., Bulmer, R., Crawshaw, J., & Macreadie, P. I. (2024). A preliminary estimate of the contribution of coastal blue carbon to climate change mitigation in New Zealand. New Zealand Journal of Marine and Freshwater Research, 58(3), 530–540. https://doi.org/10.1080/00288330.2023.2245770
Rounce, D. R., Hock, R., Maussion, F., Hugonnet, R., Kochtitzky, W., Huss, M., Berthier, E., Brinkerhoff, D., Compagno, L., Copland, L., Farinotti, D., Menounos, B., & McNabb, R. W. (2023). Global glacier change in the 21st century: Every increase in temperature matters. Science, 379(6627), 78–83. https://doi.org/DOI:10.1126/science.abo1324
Roy, A., & Noy, I. (2023). Impact of extratropical cyclones, floods, and wildfires on firms’ financial performance in New Zealand. Environmental Economics and Policy Studies, 25, 493–574. https://doi.org/10.1007/s10018-023-00369-x
Rullens, V., Mangan, S., Stephenson, F., Clark, D. E., Bulmer, R. H., Berthelsen, A., Crawshaw, J., Gladstone-Gallagher, R. V., Thomas, S., Ellis, J. I., & Pilditch, C. A. (2022). Understanding the consequences of sea level rise: The ecological implications of losing intertidal habitat. New Zealand Journal of Marine and Freshwater Research, 56(3), 353–370. https://doi.org/10.1080/00288330.2022.2086587
Schulze, H., Hunt, S., McIndoe, C., & Dixon, H. (2025). Māori in horticulture. Prepared for Horticulture New Zealand (HortNZ) by Business and Economic Research Limited (BERL). https://www.hortnz.co.nz/assets/About-Us/Aotearoa-Horticulture-Action-Plan/Maori-in-horticulture-report-2025-final.pdf
Short L., Craig D., & McCowan, T. (2023). Upholding the value of pāua quota: Summary report. Sustainable Seas National Science Challenge. https://backend.sustainableseaschallenge.co.nz/assets/dms/Reports/Upholding-the-value-of-paua-quota/Report-Upholding-the-value-of-paua-quota.pdf
Sigid, M. F., Harrington, L. J., & Carey-Smith, T. (2025). Understanding past record-shattering rainfall events in New Zealand. Environmental Research: Climate, 4(4), 045014. https://doi.org/10.1088/2752-5295/ae1860
Sigid, M. F., Harrington, L. J., & Lewis, H. (2026). On the future of extreme rainfall in New Zealand. Earth’s Future, 14(4), e2025EF007427. https://doi.org/10.1029/2025ef007427
Smith, H. G., Neverman, A. J., Betts, H., & Spiekermann, R. (2023). The influence of spatial patterns in rainfall on shallow landslides. Geomorphology, 437, 108795. https://doi.org/10.1016/j.geomorph.2023.108795
Soliman, T., & Greenhalgh, S. (2020). Rethinking New Zealand’s food security in times of disruption [Policy brief]. Manaaki Whenua – Landcare Research. https://www.landcareresearch.co.nz/assets/Publications/Policy-Briefing-Guidance-Papers/Policy-brief-27_Rethinking-NZs-food-security.pdf
Stewart, M., Coe, I., Taylor, L., Watchorn, C., & Simmons, W. (2023). Quick pass dune vulnerability assessment. Prepared for Christchurch City Council and Environment Canterbury by the University of Canterbury. https://www.canterbury.ac.nz/content/dam/uoc-main-site/documents/pdfs/see-2023-geography-engagement-/Quick%20Pass%20Dune%20Vulnerability%20Assessment.pdf
Stone, D. A., Noble, C. J., Bodeker, G. E., Dean, S. M., Harrington, L. J., Rosier, S. M., Rye, G. D., & Tradowsky, J. S. (2024). Cyclone Gabrielle as a design storm for northeastern Aotearoa New Zealand under anthropogenic warming. Earth’s Future, 12(9), e2024EF004772. https://doi.org/10.1029/2024ef004772
Storey, B., Owen, S., Zammit, C., & Noy, I. (2024). Insurance retreat in residential properties from future sea level rise in Aotearoa New Zealand. Climatic Change, 177, 44. https://doi.org/10.1007/s10584-024-03699-1
Strom, J., Te Ao, B., Rush, E., & Mackay, S. (2025). How has the cost of feeding New Zealand children well changed from 2018 to 2023? Monthly price changes of a modelled lower-cost healthy diet. Journal of the Royal Society of New Zealand, 55(6), 2319–2333. https://doi.org/10.1080/03036758.2024.2370882
Tait, A. (2019). Risk-exposure assessment of Department of Conservation (DOC) coastal locations to flooding from the sea. Science for Conservation Report 332. Department of Conservation. https://www.doc.govt.nz/globalassets/documents/science-and-technical/sfc332entire.pdf
Tāmaki Makaurau Recovery Office. (2026). Auckland together: Recovering from the 2023 storms. Auckland Council. https://knowledgeauckland.org.nz/media/44al4rf5/auckland-together-recovering-from-2023-storms-t%C4%81maki-makaurau-auckland-recovery-office-june-2026-updated-aug-2026.pdf
Te Uru Kahika. (2023). Before the deluge 2.0: Updated case for co-investment in flood management infrastructure following Cyclones Hale and Gabrielle. Te Uru Kahika | Regional and Unitary Councils Aotearoa. https://teurukahika.govt.nz/media/mera2wa4/before-the-deluge-20.pdf
Teen, R. (2024). Water-borne illnesses in Aotearoa New Zealand – past, present, future [Intern report]. Office of the Prime Minister’s Chief Science Advisor. https://www.dpmc.govt.nz/sites/default/files/2024-07/PMCSA-24-06-04-V1-OPMCSA-Internship-report-Water-borne-illnesses-in-Aotearoa-R-Teen-20-Jun-2024-V1-wcs.pdf
Tepley, A. J., Thomann, E., Veblen, T. T., Perry, G. L. W., Holz, A., Paritsis, J., Kitzberger, T., & Anderson-Teixeira, K. J. (2018). Influences of fire–vegetation feedbacks and post-fire recovery rates on forest landscape vulnerability to altered fire regimes. Journal of Ecology, 106(5), 1925–1940. https://doi.org/10.1111/1365-2745.12950
Thomas, A., McDonald, A., Renwick, J., Rosier, S., Tradowsky, J. S., & Bodeker, G. E. (2024). Anthropogenic influence on precipitation in Aotearoa New Zealand with differing circulation types. Weather and Climate Extremes, 46, 100727. https://doi.org/10.1016/j.wace.2024.100727
Thorpe, H., Langridge, F., Egli, V., McClutchie, J., Bell, J., Horgan-Heke, E., Caddie, M., McCool, J., & Laking, G. (2025). ‘It affected everybody, but affected people differently’: The health and wellbeing impacts of Cyclone Gabrielle on East Coast communities of Aotearoa New Zealand. Kōtuitui: New Zealand Journal of Social Sciences Online, 20(4), 1271–1291. https://doi.org/10.1080/1177083x.2025.2523344
Trenberth, K. E., Cheng, L., Pan, Y., Fasullo, J., & Mayer, M. (2025). Distinctive pattern of global warming in ocean heat content. Journal of Climate, 38(9), 2155–2168. https://doi.org/10.1175/JCLI-D-24-0609.1
UN (United Nations). (n.d.). 1.5°C: what it means and why it matters. United Nations | Climate Action. Retrieved September 16, 2026, from https://www.un.org/en/climatechange/science/climate-issues/degrees-matter
UNFCCC (United Nations Framework Convention on Climate Change). (n.d.). Parties & Observers. Retrieved September 21, 2026, from https://unfccc.int/parties-observers
United Nations Environment Programme. (2026). Limiting overshoot: Navigating exceedance of 1.5°C and pathways towards return. United Nations Environment Programme. https://doi.org/10.59117/20.500.11822/49857
Urban Intelligence. (2024). National infrastructure exposure & property isolation assessment: Contributing to the national adaptation metrics. Prepared for He Pou a Rangi Climate Change Commission by Urban Intelligence. https://haveyoursay.climatecommission.govt.nz/comms-and-engagement/cc2f075f/user_uploads/2.a-urban-intelligence_national-infrastructure-exposure---property-isolation-report--2-.pdf
Urban Intelligence. (2025). Social vulnerability assessment. Prepared for He Pou a Rangi Climate Change Commission by Urban Intelligence. https://www.climatecommission.govt.nz/assets/Uploads/NCCRA/finals/Climate-Change-Commission-Social-Vulnerability-Assessment-Coastal-Flooding-Updated.pdf
Urban Intelligence. (2026). Business isolation report. Prepared for He Pou a Rangi Climate Change Commission by Urban Intelligence. https://www.climatecommission.govt.nz/assets/Monitoring-and-reporting/NAPPA-2026/CCC-Business-Isolation-Report-April-2026.pdf
Vatsa, P., & Renwick, A. (2025). Food prices in New Zealand: Implications for feeding people better. Journal of the Royal Society of New Zealand, 55(6), 2305–2318. https://doi.org/10.1080/03036758.2024.2368788
Vetharaniam, I., Stanley, C. J., Cummins, M., van den Dijssel, C., & Müller, K. (2024). Modelling climate change impacts on location suitability for cultivating avocado and blueberry in New Zealand. Land, 13(11), 1753. https://doi.org/10.3390/land13111753
Wada, M., Sagarasaeranee, O., Cogger, N., Marshall, J., Cuttance, E., Macara, G., Sood, A., & Vallee, E. (2026). Machine learning for predicting climate change impacts on Pseudopithomyces chartarum spore counts: A risk indicator of facial eczema. New Zealand Veterinary Journal, 74(2), 98–114. https://doi.org/10.1080/00480169.2025.2579134
Waliser, D., & Guan, B. (2017). Extreme winds and precipitation during landfall of atmospheric rivers. Nature Geoscience, 10, 179–183. https://doi.org/10.1038/ngeo2894
Weinhäupl, C., & Devenish-Nelson, E. S. (2024). Potential impacts of climate change on terrestrial Aotearoa New Zealand’s birds reveal high risk for endemic species. Biological Conservation, 296, 110668. https://doi.org/10.1016/j.biocon.2024.110668
Whitehead, E., Adams, N., Baird, K., Bell, B., Borrelle, S., Dunphy, B., Gaskin, C., Landers, T., Rayner, M., & Russell, J. (2019). Threats to seabirds of northern Aotearoa New Zealand. Northern New Zealand Seabird Charitable Trust. https://www.nzseabirdtrust.com/_files/ugd/de29ab_de931d3693e64d0dbaeebfa453c569dc.pdf
Wilby, R. L., Lu, X., Watkiss, P., & Rodgers, C. A. (2021). Towards pragmatism in climate risk analysis and adaptation. Water Policy, 23(S1), 10–30. https://doi.org/10.2166/wp.2021.232
Williams, S., Meihana, P., Bosserelle, C., Hebberd, C., Battersby, J., Welsh, R., Hepi, J., & Mckenzie Sheat, R. (2025). Climate-induced sea level rise: Implications for archaeological taonga at Te Pokohiwi o Kupe | Wairau Bar, Aotearoa New Zealand. MAI Journal, 14(1), 5–15. https://doi.org/10.20507/MAIJournal.2025.14.1.1
Wilson, N., Broadbent, A., & Kerr, J. (2023). Cyclone Gabrielle by the numbers: A review at six months. Public Health Communication Centre. https://knowledgeauckland.org.nz/media/2pchutky/cyclone-gabrielle-by-the-numbers-review-at-six-months-phcc-nick-wilson-et-al-14-aug-2023.pdf
WMO (World Meteorological Organization). (2025). WMO greenhouse gas bulletin. No 21: 16 October 2025. World Meteorological Organization. https://wmo.int/sites/default/files/2025-10/GHG-21_en.pdf
WMO (World Meteorological Organization). (2026). WMO global annual to decadal climate update. World Meteorological Organization. https://library.wmo.int/idurl/4/69882
Woodward, S. J. R., Beukes, P. C., Edwards, J. P., Verhoek, K. J., Jago, J. G., & Zammit, C. (2025). Regional heat stress maps for grazing dairy cows in New Zealand under climate change. Animal Production Science, 65(4), AN24231. https://doi.org/10.1071/an24231
Wreford, A., Guenther, M., & Saunders, J. T. (2026). Evaluating the economic impacts of climate change on Aotearoa–New Zealand’s dairy sector. The Australian Journal of Agricultural and Resource Economics, 70(1), 71–86. https://doi.org/10.1111/1467-8489.70062
Wyse, S. V., Macinnis-Ng, C. M. O., Burns, B. R., Clearwater, M. J., & Schwendenmann, L. (2013). Species assemblage patterns around a dominant emergent tree are associated with drought resistance. Tree Physiology, 33(12), 1269–1283. https://doi.org/10.1093/treephys/tpt095
Yang, Z., Huang, W., McKenzie, J. E., Xu, R., Yu, P., Chen, G., Yu, W., Wu, Y., Liu, Y., Wen, B., Hales, S., Lavigne, E., Ye, T., Zhang, Y., Coelho, M. d S. Z. S., Matus, P., Tantrakarnapa, K., Kliengchuay, W., Saldiva, P. H. N., … Li, S. (2026). Risk, burden, and trend of infectious disease hospitalisations associated with floods: A multicountry, time-series study. Lancet Planetary Health, 10(1), 101411. https://doi.org/10.1016/j.lanplh.2025.101411
Yang, Z., Huang, W., McKenzie, J. E., Xu, R., Yu, P., Wu, Y., Liu, Y., Wen, B., Zhang, Y., Yu, W., Ye, T., Zhang, Y., Ju, K., Hales, S., Coelho, M. d S. Z. S., Matus, P., Tantrakarnapa, K., Guo, Y. L., Kliengchuay, W., … Li, S. (2025). Hospitalization risks associated with floods in a multi-country study. Nature Water, 3, 561–570. https://doi.org/10.1038/s44221-025-00425-8
Yang, Z., Huang, W., McKenzie, J. E., Xu, R., Yu, P., Ye, T., Wen, B., Gasparrini, A., Armstrong, B., Tong, S., Lavigne, E., Madureira, J., Kyselý, J., Guo, Y., & Li, S. (2023). Mortality risks associated with floods in 761 communities worldwide: Time series study. BMJ, 383, e075081. https://doi.org/10.1136/bmj-2023-075081
Yletyinen, J., Tylianakis, J. M., Stone, C., & Lyver, P. O’B. (2022). Potential for cascading impacts of environmental change and policy on indigenous culture. Ambio, 51, 1110–1122. https://doi.org/10.1007/s13280-021-01670-3
Yukich Clendon, O. M. M., Carpenter, J. K., Kelly, D., Timoti, P., Burns, B. R., Boswijk, G., & Monks, A. (2023). Global change explains reduced seeding in a widespread New Zealand tree: Indigenous Tūhoe knowledge informs mechanistic analysis. Frontiers in Forests and Global Change, 6, 1172326. https://doi.org/10.3389/ffgc.2023.1172326
Zekollari, H., Huss, M., Schuster, L., Maussion, F., Rounce, D. R., Aguayo, R., Champollion, N., Compagno, L., Hugonnet, R., Marzeion, B., Mojtabavi, S., & Farinotti, D. (2024). Twenty-first century global glacier evolution under CMIP6 scenarios and the role of glacier-specific observations. The Cryosphere, 18(11), 5045–5066. https://doi.org/10.5194/tc-18-5045-2024
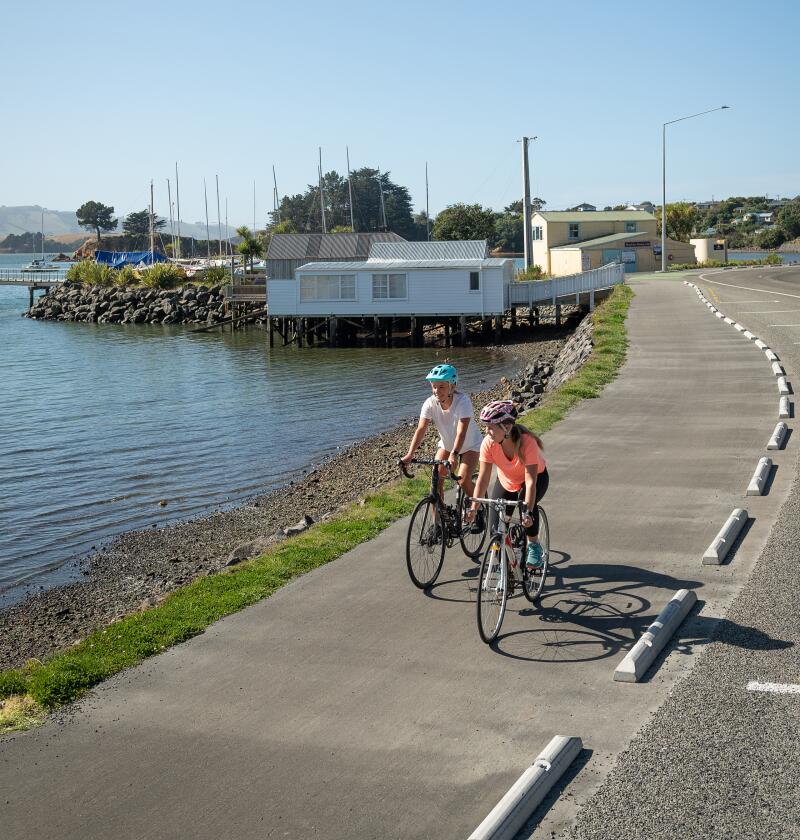
Our Atmosphere and Climate 2026 Tō Tātou Kōhauhau, Āhuarangi Hoki
October 2026
© Ministry for the Environment