Climate Strategy Rautaki Āhuarangi

This section outlines how New Zealand’s Climate Strategy guides the second emissions reduction plan and how we are tracking towards our emissions budgets and ultimately the 2050 target. It also outlines an 'adaptive management' approach to implement and monitor the plan.
The Government is committed to meeting New Zealand’s climate change targets. The Climate Change Response Act 2002 sets out the Zero Carbon Framework, which guides how we meet our 2050 net zero target.
Our 2050 target takes a split-gases2 approach:
New Zealand uses a system of emissions budgets and emissions reduction plans to navigate towards net zero. Emissions budgets place limits on emissions in five-yearly budget periods and serve as stepping stones towards the 2050 target. Each emissions budget has a corresponding emissions reduction plan, which sets out the policies and strategies that enable New Zealand to meet the target for that budget period. This plan covers the second emissions budget period (2026–30).
Our 2050 target is net based. This means it can be achieved by both reducing gross emissions and increasing emissions removals. Net emissions are the difference between gross emissions and carbon removals (figure 1.1).
2 New Zealand has a ‘split-gas’ target for domestic emissions, which considers biogenic methane separately from all other greenhouse gases. This reflects the different warming impact that methane has compared with other greenhouse gases, such as carbon dioxide.


The Government wants to reduce net emissions in cost-effective ways. This means the Government, businesses and households will take actions that have the greatest impact on net emissions for a given investment in reductions or removals.
Cost-effective emissions reduction policies minimise the cost-of-living impacts of climate change policies and increase the likelihood of successful delivery of targets and budgets.
The New Zealand Emissions Trading Scheme (NZ ETS) raises the cost of emissions and reduces the cost of removals. It encourages businesses to find cost-effective ways to reduce emissions and increase removals across the economy. Chapter 4 provides more information on the NZ ETS and how the Government intends to support a credible carbon market through the second emissions reduction plan (ERP2).
Complementary policies work alongside the NZ ETS and make it cheaper or easier for businesses and households to reduce net emissions. They do this by:
Chapters 7–13 set out the package of complementary sector-based policies for ERP2.
The private sector plays an important role in reducing New Zealand's emissions, and their feedback on the ERP2 discussion document has provided additional insights into their work and areas for additional focus from the Government.
One of the most significant changes to the modelling for ERP2 since the discussion document is the inclusion of the plan by Genesis Energy to transition the Huntly power station from coal to biomass, which represents a reduction of 1.1 Mt CO2-e over the second emissions budget period.
The Government will continue to reduce emissions and ensure the regulatory and economic environment can support the efforts of others to reduce emissions alongside and in addition to government action.
Taking a cost-effective approach to emissions reduction has the potential for some unwanted outcomes.
For example, forestry is an affordable and scalable form of abatement. The NZ ETS could encourage more farm conversions to plantation forestry than rural communities would find acceptable. The Government will use legislation or regulation to manage unintended consequences and maintain focus on cost-effectiveness within those constraints. A recent example of this ‘constrained optimisation’ approach is the proposed limits on whole-farm conversions to exotic forestry on high-quality productive land (more information on this policy is in chapter 11).
With this plan, New Zealand is projected to reduce net emissions to 2030 and to meet the first and second emissions budgets (EB1 and EB2).
The first emissions reduction plan has been kept up to date and aligned with the Government’s Climate Strategy.
New Zealand is making good progress and is on track to meet EB1. Emissions are projected to be 284.1 Mt CO2-e for 2022–25, which is below the limit of 290 Mt CO2-e set by EB1 (table 2.1). We will know whether we have managed to stay within that emissions budget in 2027, when official data for the period becomes available.
| EB | Projection (central estimate*) |
Uncertainty range |
|---|---|---|
| EB1 290 Mt CO2-e |
284.1 | ± 2.5 % |
| EB2 305 Mt CO2-e |
303.1 | ± 5.5 % |
* The further out we look, the more uncertain the projection becomes. We express this as an ‘uncertainty range’. This shows a spectrum of emissions scenarios, from the lowest expected result to the highest. In the middle is the ‘central estimate’, which we think is the scenario most likely to hold true.
Figure 2.1 shows the impact of the second emissions reduction plan (ERP2) on projected emissions to the end of the EB2 period by sector. Emissions reductions in energy, forestry and agriculture make the largest contribution to meeting EB2.
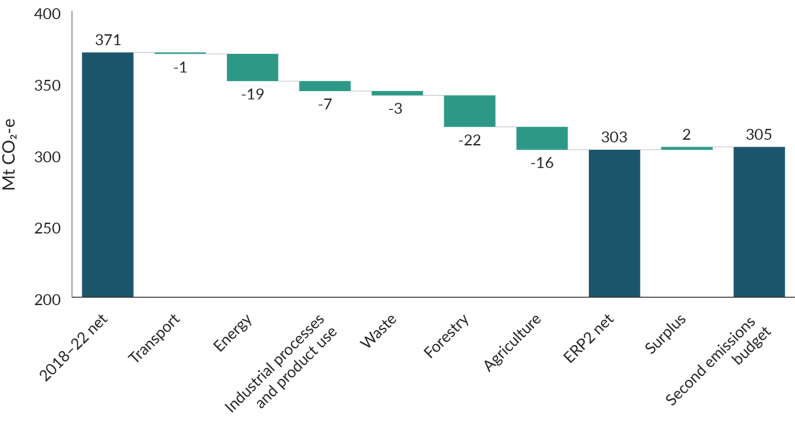
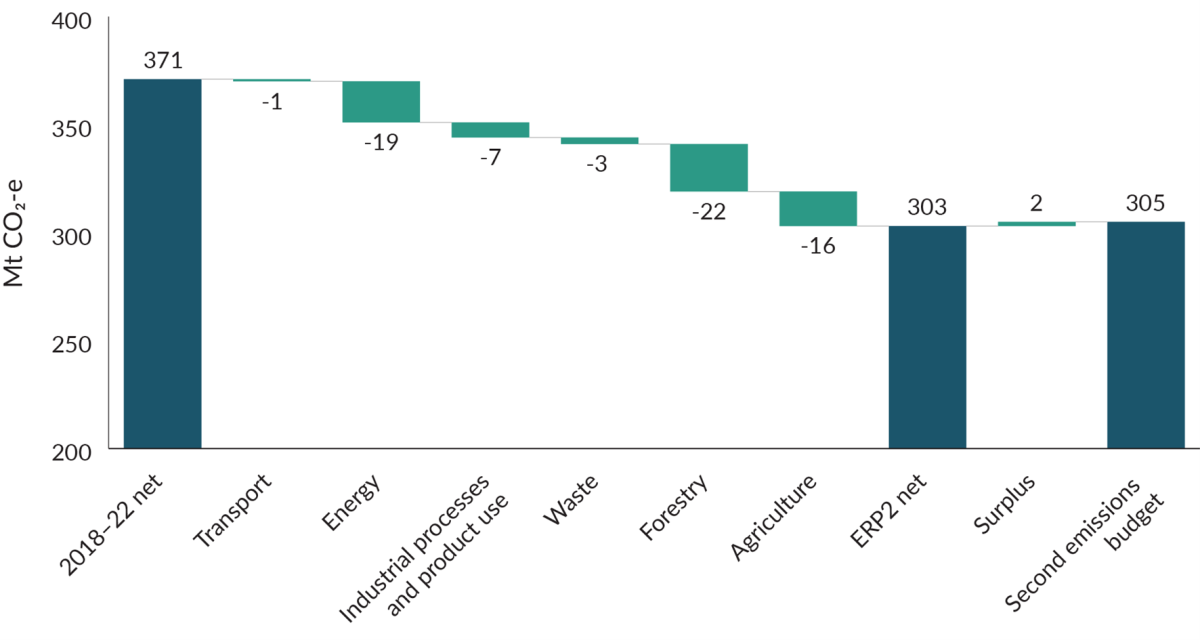
Eight key ERP2 policies have the greatest potential to lower emissions in the EB2 and third emissions budget (EB3) periods (table 2.2).
| ERP2 policy | Projected impact | |
|---|---|---|
| EB2 (2026–30) | EB3 (2031–35) | |
| Electrify NZ | –0.1 | –1.6 |
| Enable carbon capture, utilisation and storage | –1.0 | –0.9 |
| Target 10,000 public electric vehicle charging points by 2030 | –0.01 | –0.2 |
| Implement an agricultural emissions pricing system and mitigation technologies | –0.2 | –10.6 |
| Invest in resource recovery through the Waste Minimisation Fund | –1.0 | –1.0 |
| Improve organic waste management and landfill gas capture | –0.8 | –1.1 |
| Introduce a regulated product stewardship scheme for refrigerants | –0.4 | –0.7 |
| Afforestation on Crown-owned land | 0.4*** | –1.8 |
| Impacts of updated NZ ETS settings not captured elsewhere* | –0.2 | –1.0 |
| Total – summed above | –3.3 | –18.9 |
| Total – integrated analysis** | –3.2 | –17.1 |
* At the time the 2024 New Zealand Emissions Trading Scheme (NZ ETS) settings were decided, the total impact of tightening NZ ETS unit and price control settings was estimated at 0.7 Mt CO2-e in the EB2 period and 3.1 Mt CO2-e in the EB3 period. The numbers in this row of the table refer to the impacts of tighter NZ ETS settings that have not been captured in the baseline and elsewhere. See the technical annex for further details.
** The integrated analysis involves modelling the impact of ERP2 policies within the Emissions in New Zealand model to ensure any interactions between policies are modelled, rather than just summing the emissions reduction for individual measures. This allows for the dynamic effects of individual policies to be taken into account. More information on the modelling approaches for ERP2 can be found in the technical annex.
*** Initially emissions rise because there are net emissions from land clearance and soil loss due to conversion to forest.
The New Zealand Emissions Trading Scheme (NZ ETS) sets an overall limit on emissions units available to emitters in accordance with emissions budgets. The scheme’s supply of units declines over time, consistent with meeting the tightening budgets.
The Government has already aligned supply in the NZ ETS with EB2. We have updated unit and price control settings to reduce the number of units available between 2025 and 2029 from 45 million to 21 million. This decision was estimated to lead to additional emissions reductions of 0.7 Mt CO2-e in the EB2 period and 3.1 Mt CO2-e in the EB3 period. The observed market price rose immediately after this decision was announced.
The updated settings will help manage a critical risk to meeting EB2: the large stockpile of units. If more banked units are surrendered than expected, emissions from NZ ETS sectors will exceed our current projections. Chapter 4 has more information on the role of the NZ ETS in ERP2, and the impact of the updated settings.
New Zealand is on track to meet our long-term targets.
Figure 2.2 shows that net emissions are now projected to be zero in 2050.
Projections show New Zealand is also on track to achieve the methane target in 2050. Biogenic methane emissions are expected to have reduced by 24.9 per cent in 2050, which is within the legislated target band of a 24 to 47 per cent reduction, and in 2030 biogenic methane emissions are expected to have reduced by 10 per cent, consistent with the target for that year.
Progress has also been made toward EB3 since consultation in July. Current modelling projects net emissions of 249.2 Mt CO2-e during the EB3 period (2031–35), 9.2 Mt CO2-e above the 240 Mt CO2-e EB3 limit. This is a significant improvement on the interim projections of 17.4 Mt CO2-e above EB3 in the ERP2 discussion document. This improvement is mostly driven by greater than expected abatement from some new ERP2 policies, updated NZ ETS settings and lower than expected emissions from the energy and industrial processes and product use (IPPU) sectors.
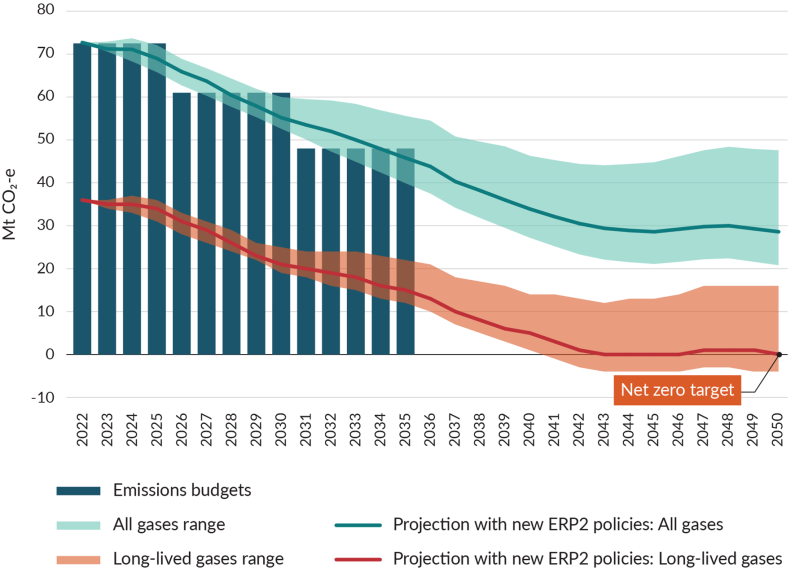
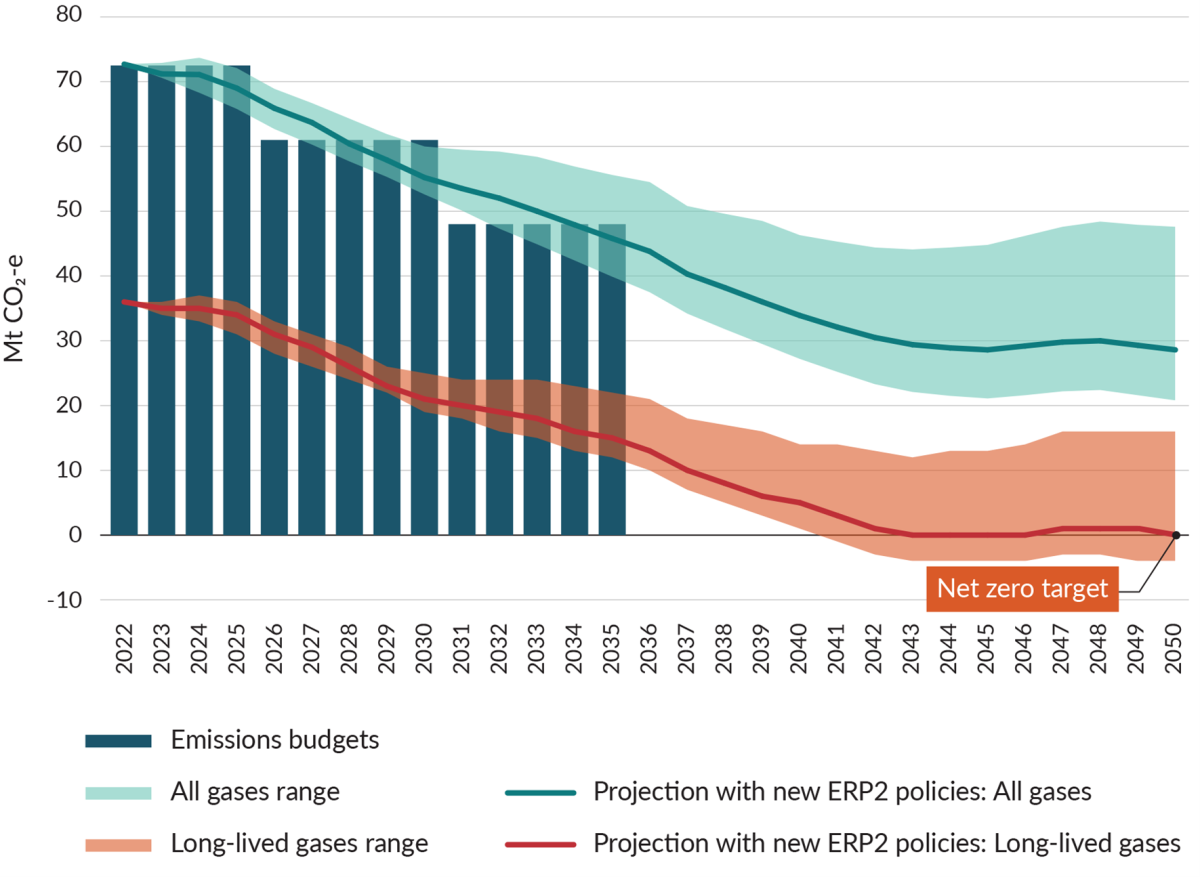
Key policies introduced through ERP2 will contribute to meeting the first Nationally Determined Contribution (NDC). Net emissions are now projected to be 84 Mt CO2-e above the target.
ERP2 significantly increases the contribution of domestic emissions reductions to future NDCs. The second NDC will be set in 2025 for the period 2031–35, overlapping with EB3. Key ERP2 policies are projected to contribute 17.1 Mt CO2-e of abatement towards the second NDC.
Under the Climate Change Response Act 2002, the Government is responsible for meeting emissions budgets and climate change targets. New Zealand’s reputation is affected by whether we deliver on our commitments.
The Government is confident we can deliver the actions in this second emissions reduction plan (ERP2). However, progress toward emissions budgets and targets is affected by a range of factors. Many of those factors that influence the timing and quantity of net emissions are beyond the Government’s control. For example, long periods of dry weather could reduce renewable electricity supply, leading to more gas or coal use to generate electricity.
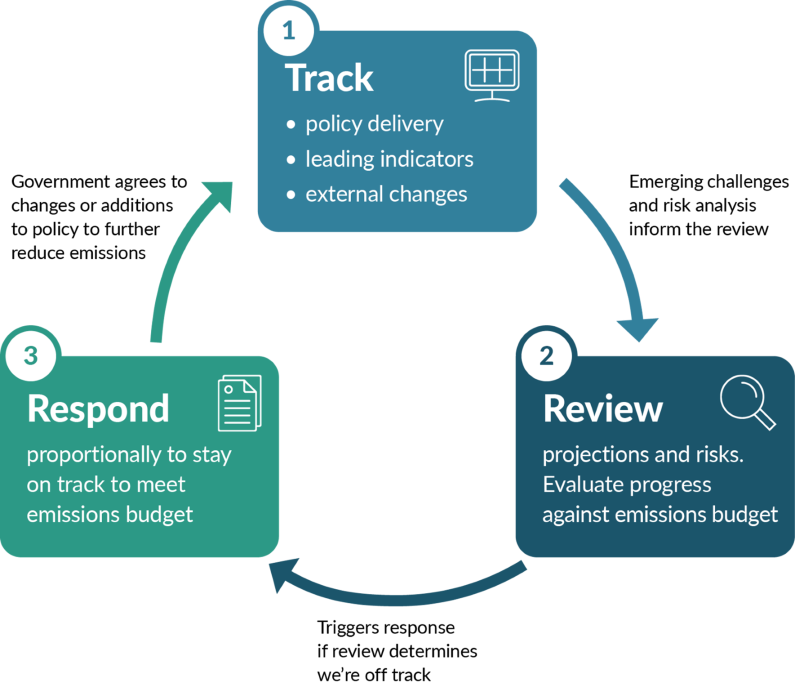
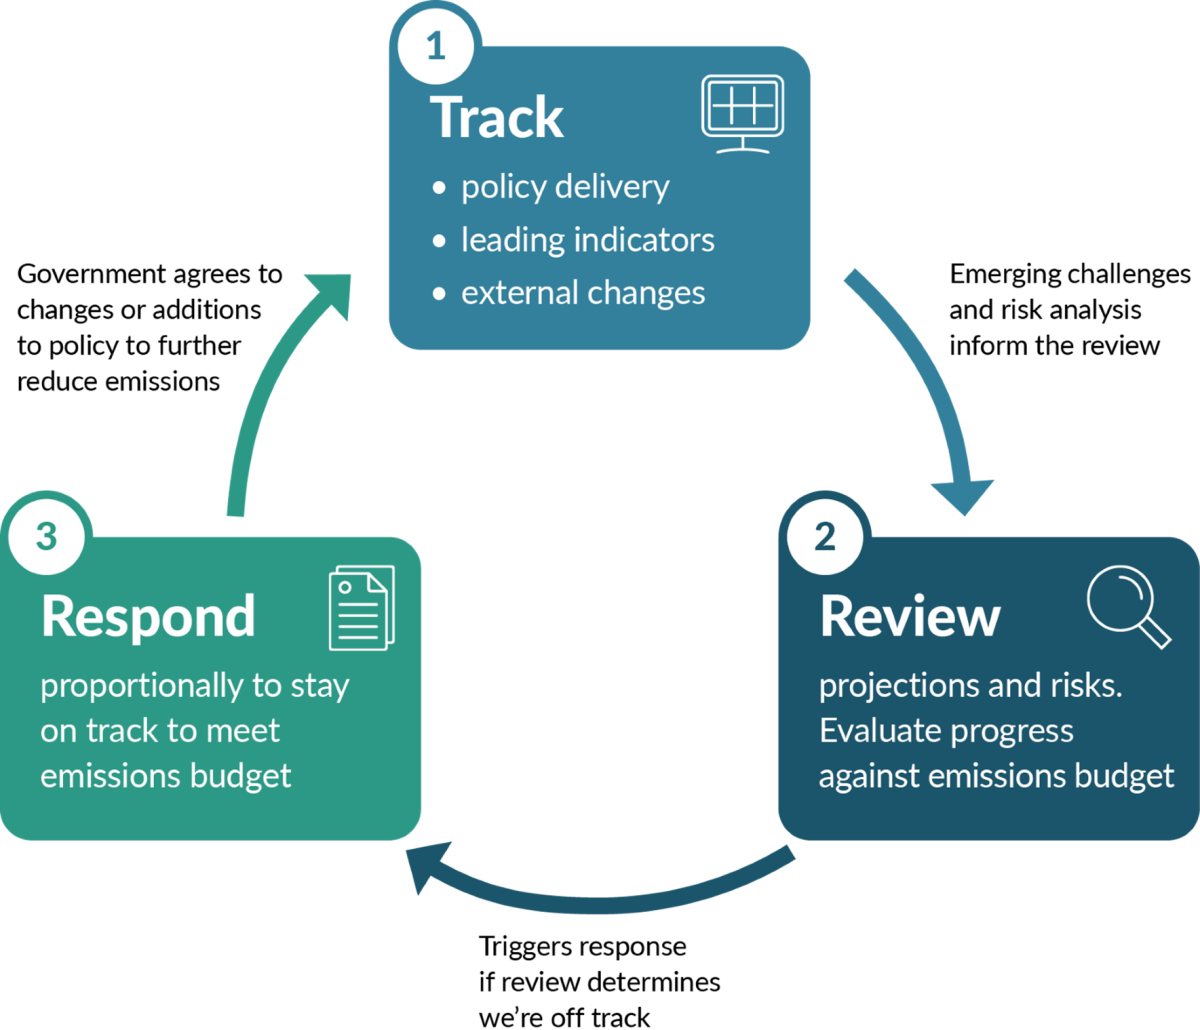
This is why we need to monitor and respond to meet the second emissions budget (EB2) and support meeting future budgets. This chapter outlines the Government’s adaptive management approach to ERP2 to ensure we meet EB2.
Adaptive management means actively monitoring and responding to policy delivery and changing circumstances that affect how New Zealand is tracking towards EB2.
Every year, the Government will progress through three stages (figure 3.1):
The Prime Minister’s public sector targets require quarterly tracking and reporting. To reinforce the importance of meeting climate targets, we have included the first emissions budget (EB1) and EB2 in Government Target 9.
The Climate Change Chief Executives Board reports on progress towards Target 9 to the Prime Minister and Cabinet. The reports are released to the public, so New Zealanders can see how we are tracking.
What is the target?
On track to meet New Zealand’s 2050 net zero climate change targets, with total net emissions of no more than 290 Mt CO2-e from 2022 to 2025 and 305 Mt CO2-e from 2026 to 2030.
We will track and report on a comprehensive set of indicators through the Target 9 process. These will allow a faster approach to adaptive management, to complement the official, annual updates to the Greenhouse Gas Inventory. The types of indicators we plan to have in place by 2026 are listed in table 3.1.
| Type | Explanation | Indicators |
|---|---|---|
| External factors | Metrics with an important link to emissions levels where the Government has no influence or control, eg, natural phenomena/events, international factors. | Global oil prices, global commodity prices, hydro-electric dam lake levels |
| Progress indicators | Metrics that indicate progress in areas where the Government has some influence, but where the influence is indirect or limited. They have an important link to emissions levels and pathways. | Fuel imports, tree planting rates, New Zealand Emissions Trading Scheme stockpile |
| Action delivery | Metrics showing whether planned Government policies are delivering as expected. Includes actions set under ERP1 policies that will continue to contribute to abatement during the EB2 period. | Number of new electric vehicle charging points |
| Mitigation availability | Monitoring emissions reduction technologies and practices, including current costs, availability and progress towards commercialisation. | Availability and cost of agricultural greenhouse gas mitigation technologies |
The Climate Change Commission | He Pou a Rangi will play an important role in independently reviewing progress towards EB2 through its monitoring and review function for emissions budgets and the 2050 target.
Cabinet will meet annually to evaluate whether New Zealand is on track to meet EB2. This evaluation will be informed by:
If a risk to meeting EB2 emerges, Cabinet can decide on a proportionate response. This may include:
The Climate Change Response Act 2002 also allows the banking of some emissions across budget periods, to account for the uncertainty of designing emissions reduction plans. If emissions come down by more than is required to meet EB1, the excess could be carried forward and contribute to EB2. Current projections show New Zealand over-achieving EB1 by 6 Mt CO2-e. Final emissions for EB1 will be known when the New Zealand Greenhouse Gas Inventory is released in 2027.

Climate Strategy Rautaki Āhuarangi
December 2024
© Ministry for the Environment