In recent decades, global attention has focused on two environmental issues in relation to the atmosphere: climate change and depletion of atmospheric ozone. In response, the international community has acted to quantify and reduce emissions of greenhouse gases and ozone-depleting substances.
Climate change
Greenhouse gas concentrations over New Zealand
Atmospheric concentrations of carbon dioxide over New Zealand increased from 324 parts per million (ppm) in 1970 to 379 ppm in 2006. Atmospheric nitrous oxide concentrations showed an average increase of 0.9 parts per billion (ppb) each year over the last decade. Methane concentrations have shown a small reduction in recent years. These trends are in line with international trends.
National greenhouse gas emissions
In 2005, total emissions of greenhouse gases in New Zealand were 77.2 million tonnes of carbon dioxide equivalents. Between 1990 and 2005, total greenhouse gas emissions increased by 25 per cent, reflecting our growing population and economy. While New Zealand’s greenhouse gas emissions represent much less than 1 per cent of global emissions, we rank 12th per head of population.
Sectoral emissions of greenhouse gases
New Zealand has an unusual profile of greenhouse gas emissions for a developed nation. Methane and nitrous oxide from the agricultural sector contribute nearly 50 per cent of our total emissions. Carbon dioxide emissions, largely from energy generation and transport, contribute most of the other 50 per cent. Many other developed nations have comparatively lower agricultural emissions, and higher emissions from energy generation.
Carbon removals by forest sinks
Between 1990 and 2005, carbon dioxide removed from the atmosphere by forest growth (termed forest sinks) increased by 29 per cent, largely because of increases in plantation forestry in the mid-1990s.
Climate change impacts on temperatures
In line with international trends, average New Zealand temperatures rose by 0.9°C between 1920 and 2006. This change means we can no longer take historical climate patterns as an accurate guide to the climate we will experience in the future.
Future impacts of climate change
As an island country reliant on primary production and tourism for its economic wealth, New Zealand will be particularly affected by climate change. Climate change is likely to bring about rising sea levels, an increase in floods and droughts, change wind and rainfall patterns, increase temperatures, reduce frosts, put pressure on our ecosystems, and increase the threat of pest species becoming established here.
Present and future management
Like many other developed countries, New Zealand is prioritising the development of a range of policies and initiatives to respond to climate change. In the future, the challenge will continue to be to reduce emissions from energy, transport, and the agricultural sector, and to increase afforestation. The need to adapt to both the positive and negative aspects of a changing climate is a challenge for all sectors.
Ozone
Changes in atmospheric ozone concentrations
In the 1980s, identification of the ozone hole over Antarctica led to international agreements to control the use of ozone-depleting substances. As a result, atmospheric ozone levels over Antarctica are now reducing more slowly than they were during the 1980s and 1990s, and ozone measured over Central Ōtago has stabilised since the late 1990s. The monitored summertime levels of ultraviolet radiation in New Zealand have tracked changes in ozone in recent years.
Future impacts of ozone management
Ozone levels are expected to continue to improve as refrigerants and other chemicals that deplete the ozone layer are phased out in line with international protocols.
The atmosphere enveloping the earth is a vital part of the world we live in. It contains the oxygen we need to breathe, protects us from ultraviolet radiation and the extreme cold of space, and plays an essential role in recycling energy, water, and other essentials for life. Weather is a direct product of atmospheric processes, and influences our pattern of living.
As a result of industrial and other activities, human society is now emitting gases into the atmosphere in such quantities that the composition and dynamics of the atmosphere are changing. The changes occurring in the atmosphere as a result of human activity can have significant environmental, health, and economic effects.
In recent decades, global attention has focused on two environmental issues in relation to the atmosphere: climate change (often referred to as ‘global warming’) and depletion of atmospheric ozone. This chapter discusses the New Zealand aspects of these two environmental issues.
Climate change
Greenhouse gases in the earth’s atmosphere trap warmth from the sun and make life possible. Without them, temperatures at the surface of the earth would be about 30°C colder. The major greenhouse gases include:
- water vapour
- carbon dioxide (CO2)
- methane (CH4)
- nitrous oxide (N2O).
Other greenhouse gases at lower concentrations include:
- sulphur hexafluoride (SF6)
- perfluorocarbons (PFCs)
- hydrofluorocarbons (HFCs).
The ‘enhanced’ greenhouse effect
The Intergovernmental Panel on Climate Change (see box ‘International initiatives on climate change') recently brought together the most up-to-date knowledge on climate change in its Fourth Assessment Report (Intergovernmental Panel on Climate Change, 2007a; 2007b). Since the industrial revolution of the early 19th century, the concentration of greenhouse gases such as carbon dioxide, methane, and nitrous oxide has increased in the atmosphere. They now far exceed pre-industrial levels as determined from ice cores that span thousands of years.
Global increases in atmospheric carbon dioxide concentration are caused primarily by fossil fuel use and land-use change, while increases in methane and nitrous oxide are primarily due to agriculture (Intergovernmental Panel on Climate Change, 2007a). This increased concentration of gases traps more of the sun’s warmth than normal, leading to a gradual warming of the atmosphere (the ‘enhanced’ greenhouse effect).
Fluctuations in the ‘natural’ atmospheric system bring about changes in climate (climate variability). However, changes in the climate as a result of increased concentrations of greenhouse gases in the atmosphere are expected to be much greater, and to happen more quickly, than any natural changes in the past 10,000 years.
Most of the increase in global temperatures since the mid-20th century is attributed to increased greenhouse gas concentrations caused by human activity. Human influence is also discernible on other aspects of the climate, such as ocean warming, temperature extremes, and wind patterns (Intergovernmental Panel on Climate Change, 2007a).
Impacts on New Zealand’s climate
Temperature
New Zealand’s average surface temperature increased by 0.9°C between 1920 and 2006. This increase is consistent with increases in global temperature. The average global temperature has warmed by 0.76°C in the past century (Intergovernmental Panel on Climate Change, 2007a). The average minimum temperature has increased by 1.2°C and the maximum has increased by 0.7°C over the same period for New Zealand. Frost frequency has decreased since the 1950s (National Institute of Water and Atmospheric Research, pers comm).
For the next two decades (to 2030), global increases in temperature of about 0.2°C each decade are projected for a range of expected levels of greenhouse gas emissions (Intergovernmental Panel on Climate Change, 2007a). Best projections of global temperature increases by 2100 are between 1.8 and 4.0°C.
These changes suggest that we can no longer rely on using historical climate data to predict our future climate patterns. Figure 8.1 illustrates how current climate variables such as temperature differ from the historical pattern.
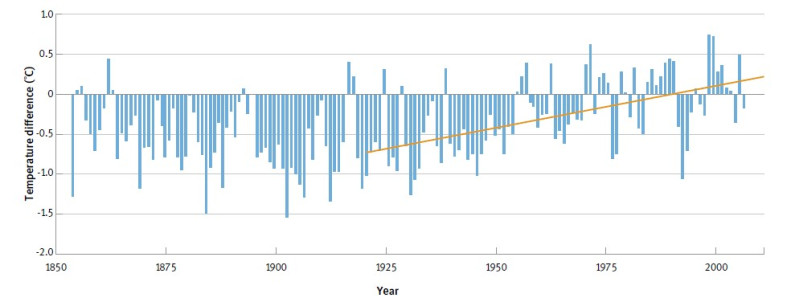
Image: Source: Ministry for the Environment, 2004; National Institute of Water and Atmospheric Research.
Note: The bars represent annual anomalies, that is, the difference in temperature in an individual year compared with the average for the 1971–2000 period. The straight line represents the linear trend in temperature anomaly between 1920 and 2006.
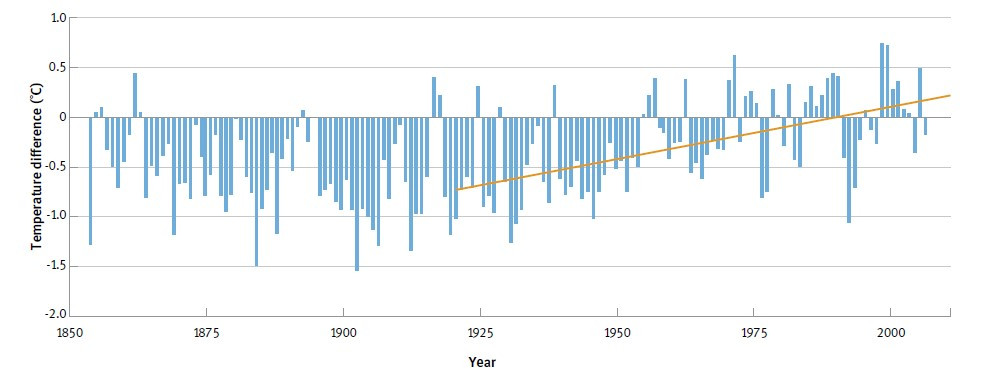
Rainfall
Changes in annual rainfall in New Zealand are expected as a consequence of climate change. A warmer atmosphere will hold more moisture, and so increased rainfall amount and intensity are likely (Intergovernmental Panel on Climate Change, 2007b).
However, Figure 8.2 shows that these expected changes in annual rainfall are not yet evident for several locations in New Zealand. No consistent, country-wide trend has so far been discernible in the rainfall record.
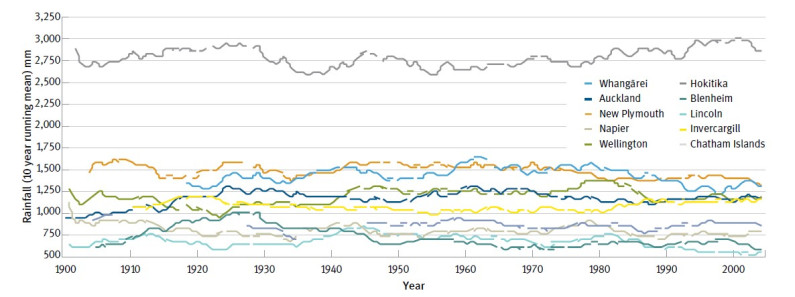
Image: Source: National Institute of Water and Atmospheric Research.
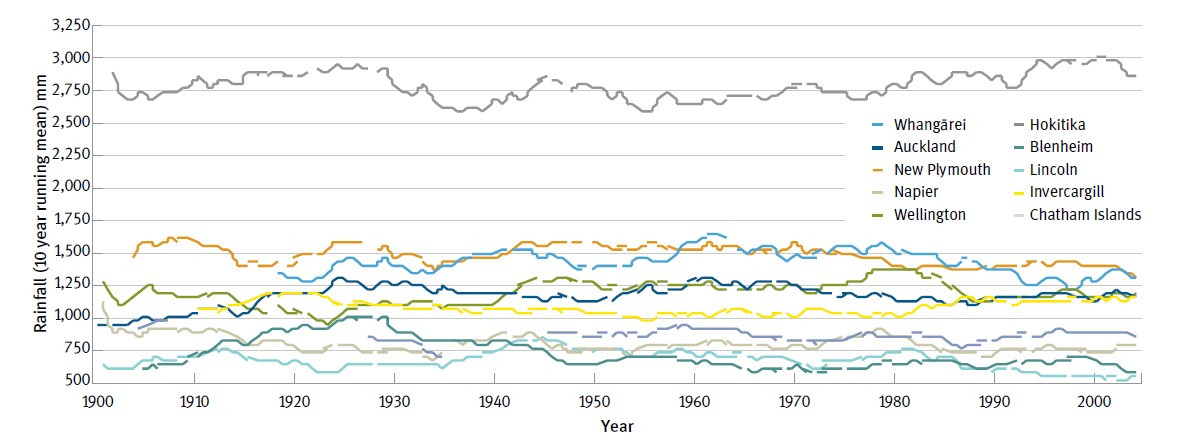
Image: Source: National Institute of Water and Atmospheric Research.
Other climate impacts
Rising global temperatures are expected to lead to other changes in climate patterns that could impact significantly on the global environment, economy, and human society. As an example, the average global sea-level rise is expected to be between 0.19 metres and 0.58 metres by 2100 (Intergovernmental Panel on Climate Change, 2007b). This rise in sea level has the potential to affect coastal erosion and cause saltwater intrusion into aquifers.
Climate models also predict that New Zealand will experience an increased intensity and frequency of extreme weather events, including more droughts in already drought-prone areas, and larger and more frequent floods in regions already vulnerable to flooding. An increase in westerly winds is likely to result in more rainfall and flooding in the west, and less rainfall and more droughts in the east of the country (Ministry for the Environment 2004).
Sea level rise has the potential to impact on coastal erosion.
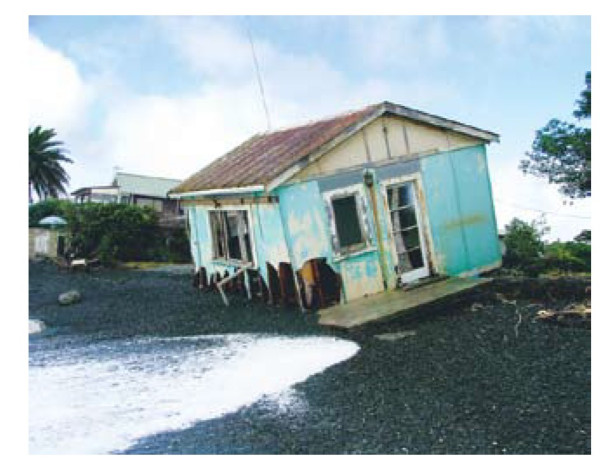
Source: Courtesy of Peter Arnold, National Institute of Water and Atmospheric Research.
More about climate change impacts in New Zealand
As an island country reliant on primary production and tourism for its economic well-being, New Zealand stands to be significantly affected by climate change.
Rising temperatures are likely to lead to greater risks to our agricultural, horticultural, and forestry sectors, as extreme weather events become more frequent and tropical-pest plants and insects become established here. The type of, and suitable location for, key crops may also change. Higher temperatures could cause problems for crop production. For example, crops such as kiwifruit require cold winters for fruit development.
Climate change is also likely to accentuate existing pressures on New Zealand’s native species (see chapter 12, ‘Biodiversity’) and natural ecosystems. Subtropical diseases may become a problem for human health if carrier insects, such as mosquitoes carrying the Ross River virus, become established here.
Predicted extreme weather events have significant costs associated with them, particularly when infrastructure and economic productivity are damaged. As an example, the drought in 1997–1998 is estimated to have cost the New Zealand economy a billion dollars, and the floods of February 2004 are estimated to have cost about $400 million. An increase in forest and grass wildfires in drier eastern areas of the country is likely to have a significant economic effect.
Coastal erosion and sea level rise can pose a particular problem for Māori, whose spiritual sites (urupā and wāhi tapu) are often located close to sea level.
However, a changing climate may also provide opportunities, such as new crops, and faster crop growth rates, made possible by elevated levels of carbon dioxide in the atmosphere. Warmer winters are expected to relieve the pressure on electricity and heating supplies, as well as to provide health benefits (and a reduction in heating costs). Increasing rainfall in the Southern Alps could boost electricity supply by raising water levels in our major hydro storage lakes.
Ozone
Ozone is a gas present in trace quantities in the atmosphere. It is a form of oxygen with three oxygen molecules instead of the normal two. More than 90 per cent of ozone is found in the stratosphere, 20–25 kilometres above the earth, in what is known as the ozone layer.
Ozone plays an important role in protecting the earth from the sun’s harmful effects. Ozone is produced when ultraviolet (UV) radiation from the sun meets oxygen molecules. Once formed, ozone molecules absorb UV radiation before it reaches the surface of the earth. Without this process, life as we know it could not exist (National Institute of Water and Atmospheric Research, pers comm).
Although ozone is constantly created and destroyed in the stratosphere through natural processes, some chemicals increase the amount of ozone destroyed. This is particularly true of chlorofluorocarbons – chemicals that were used widely in the past as refrigerants and in some industrial processes.
When gases containing chlorine and bromine reach the stratosphere, they break down to release reactive molecules of chlorine or bromine, which alter the natural balance of ozone creation and destruction. As the concentrations of chlorine and bromine in the stratosphere rise, there is a consequential increase in the depletion of the ozone layer, and in the amount of UV radiation reaching the ground.
Atmospheric ozone and ground-level ozone
While ozone depletion in the upper atmosphere can cause harm to both the environment and human health, an increasing quantity of ozone at ground level can be a concern for air quality. Chapter 7, ‘Air’, describes the effect of increasing ground-level ozone.
What is the ‘ozone hole’?
Over the past 30 years, ozone levels over Antarctica have dropped by almost 60 per cent during the spring of each year, and a ‘hole’ in the ozone layer is clearly visible in satellite observations. This hole does not extend over New Zealand. In fact, New Zealand experiences its highest ozone levels in October, at the same time as the ozone hole occurs over Antarctica.
Nonetheless, summertime ozone levels over New Zealand continue to be strongly influenced by Antarctic ozone depletion. When the ozone hole over Antarctica breaks up in November or December, ozone-depleted air moves into surrounding areas in the southern hemisphere, including New Zealand. The later the ozone hole breaks up, the higher the sun is in the sky over New Zealand and so the larger the effect on UV levels. If New Zealand experiences a combination of lower ozone with high sun and few clouds, then skin-damaging UV levels can be extreme (National Institute of Water and Atmospheric Research, pers comm).
Increased UV levels
New Zealand’s location in the remote southern Pacific and Southern oceans and its low population density mean it has an exceptionally ‘clean’ atmosphere over most of the country. For example, New Zealand has little of the particulates and shorter-lived industrial gases that impact on heavily industrialised countries in the northern hemisphere (see chapter 7, ‘Air’, for further detail on air quality).
Our latitude and clarity of atmosphere mean that high levels of radiation from the sun reach the ground relatively unhindered. This results in higher levels of UV radiation at ground level in New Zealand than in other developed countries (National Institute of Water and Atmospheric Research, pers comm). Ozone depletion further exacerbates this effect, resulting in increased intensity of the UV radiation that causes sunburn.
The environmental and health impacts of raised levels of UV can be severe, particularly for New Zealand where high levels of UV are already experienced. The impacts include increases in the rates of skin cancers and eye cataracts. Raised levels of UV also suppress human and animal immune systems. Plants can also be affected. For example, high UV levels reduce the growth of plankton, a critical building block of the marine food chain. Increased exposure to UV damages some man-made materials such as paints, plastics, and construction materials.
Seasonal variability in UV levels
In New Zealand there is high seasonal variability in UV levels, especially in the south of the country, where:
- winter levels of sunburn-causing UV are less than 10 per cent of those in summer
- winter intensities of UV that produce vitamin D are probably less than 5 per cent of their summertime peaks.
This variability means that there are two concerns relating to UV in New Zealand. In the summer months, high UV intensities increase our risk of skin damage compared with corresponding northern hemisphere countries. But during the winter months, there may not actually be enough UV radiation to produce sufficient vitamin D in our bodies (McKenzie et al, 2006).
Links between climate change and ozone depletion
Climate change and ozone depletion are accelerated by human activity. Many ozone-depleting gases are also greenhouse gases. By reducing the use of ozone depleting gases, we can both protect the ozone layer and reduce climate change.
At the same time, climate change is likely to accelerate the recovery of the ozone layer, at least outside polar regions. While the earth’s surface is expected to warm in response to increases in greenhouse gases, the stratosphere is expected to cool. Outside polar regions, this combination results in a decrease of the rate of ozone depletion. However, in polar regions, the lower stratospheric temperatures and stronger polar winds could extend the period over which stratospheric clouds are present, which in turn promotes chlorine-caused ozone destruction.
See chapter 1, ‘Environmental reporting’, for more information on the core national environmental indicators and how they are used.
There are two national environmental indicators for atmosphere.
The first is a climate change-related indicator that provides information on emissions and removals of greenhouse gases. The second is an ozone-related indicator that provides information on concentrations of stratospheric ozone.
Further detail follows on the two national environmental indicators for atmosphere.
Greenhouse gas emissions and removals
This indicator is used to measure New Zealand’s contribution to global climate change.
The quantity of greenhouse gases emitted in to the atmosphere as a result of human activity in New Zealand is estimated as part of a national inventory. Gases included in this inventory are: carbon dioxide, methane, nitrous oxide, sulphur hexafluoride, hydrofluorocarbons, and perfluorocarbons. The amount of greenhouse gases removed from the atmosphere as a result of absorption by forestry is also estimated. (Greenhouse gases are removed from the atmosphere by forests, because the trees absorb carbon dioxide as they grow – these are termed ‘forest sinks’ or ‘carbon sinks’. )
Methodologies and reporting formats for use in compiling national inventories have been agreed by the parties to the United Nations Framework Convention on Climate Change (UNFCCC). These methodologies have been used in reporting the New Zealand greenhouse gas inventory.
Additional information on the atmospheric concentrations of greenhouse gases in New Zealand is also reported.
Ozone
This indicator measures concentrations of stratospheric ozone over New Zealand. It is used to provide information on the condition of the ozone layer over mid-latitudes in the southern hemisphere.
To report on this indicator, the National Institute of Water and Atmospheric Research measures stratospheric ozone levels over Lauder in Central Ōtago. At this site, ozone is measured as ‘total column ozone’: the total amount of ozone in a column of air from the earth’s surface to the top of the atmosphere. Data is used to illustrate the degree of ozone depletion, or how fast the ozone layer may be recovering at mid-latitudes in the southern hemisphere.
The following additional information is also discussed:
- levels of ozone-depleting substances in the atmosphere
- levels of UV radiation.
Limitations of the indicators
The indicators for atmosphere measure only stratospheric ozone and the greenhouse gases covered by the UNFCCC and Kyoto Protocol (see box ‘International initiatives on climate change’). Several other gases can cause concern about the atmosphere, but these are not discussed in this report.
International initiatives on climate change
United Nations Framework Convention on Climate Change
The United Nations Framework Convention on Climate Change (UNFCCC) took effect in 1994. Its main objective is to stabilise greenhouse gas concentrations to prevent dangerous human-caused interference with the climate system. Developed countries that have ratified the UNFCCC have a commitment to limit greenhouse gas emissions and to protect and enhance greenhouse gas sinks. The UNFCCC requires parties to submit a national greenhouse gas inventory of emissions by source and removals by sinks for an annual technical review process. (In New Zealand, forests are the primary carbon sink.)
Kyoto Protocol
The Kyoto Protocol under the UNFCCC was agreed in 1997 and came into force in 2005. The protocol sets targets for the greenhouse gas emissions of developed countries for the period 2008 to 2012 (the first commitment period). For that period it aims to reduce the total greenhouse gas emissions of developed countries to 5 per cent below the level they were in 1990.
Different countries have different targets to achieve. New Zealand's target is to reduce its greenhouse gas emissions to the level they were in 1990, or take responsibility for excess emissions. Negotiations are now under way on further commitments for developed countries under the Kyoto Protocol.
Intergovernmental Panel on Climate Change
The Intergovernmental Panel on Climate Change (IPCC) was established by governments in 1988 to improve understanding of and response to climate change. The role of the IPCC is to assess scientific, technical, and socio-economic information relevant to:
-
the risk of human-induced climate change
-
global vulnerability to climate change
-
negative and positive consequences of climate change
-
options for adapting to climate change.
The IPCC also assesses options for how to limit greenhouse gas emissions and how to otherwise mitigate climate change. The IPCC assesses and develops methods and practices for the development of national greenhouse gas inventories and disseminates information about inventory methods and practices. These methodologies have been agreed by the UNFCCC for use in compiling national inventories.
Concentrations of atmospheric greenhouse gases
Concentrations of three greenhouse gases (carbon dioxide, methane, and nitrous oxide) in the atmosphere over New Zealand are measured at Baring Head, to the southeast of Wellington. The measurements at Baring Head are representative of atmospheric gases over a wide region of the ocean to the south of New Zealand.
The concentration of all three gases has increased in the past 35 years (see Figure 8.3). The trends in greenhouse gas concentrations observed at Baring Head are consistent with global trends in atmospheric greenhouse gas concentrations (Intergovernmental Panel on Climate Change, 2007a). It is the global atmospheric concentration of greenhouse gases that determines the risk of climate change.
Carbon dioxide concentrations measured at Baring Head have risen from 324 parts per million (ppm) in 1970, to 379 ppm in 2006. The 35-year record measured at Baring Head has an average growth rate of 1.5 ppm each year. The average growth rate of carbon dioxide concentration in the past 10 years of 1.9 ppm is greater than at any other time over the instrumental record starting in 1960. This trend is supported by global observations.
Methane concentrations at Baring Head show an annual growth rate from 1989 to 1997 of 6.5 parts per billion (ppb) each year (see Figure 8.3). Since 1998, there has been a small decrease in methane concentrations in recent years. This pattern is reflected in measurements taken at Arrival Heights, Antarctica, and other global sites. We do not fully understand what drives these changes in methane concentrations.
The observations for nitrous oxide at Baring Head indicate a steady growth trend (see Figure 8.3). Seasonal variation is very small compared with the annual growth rate, because of the long atmospheric lifetime of nitrous oxide. The average annual growth rate is 0.9 ppb each year.
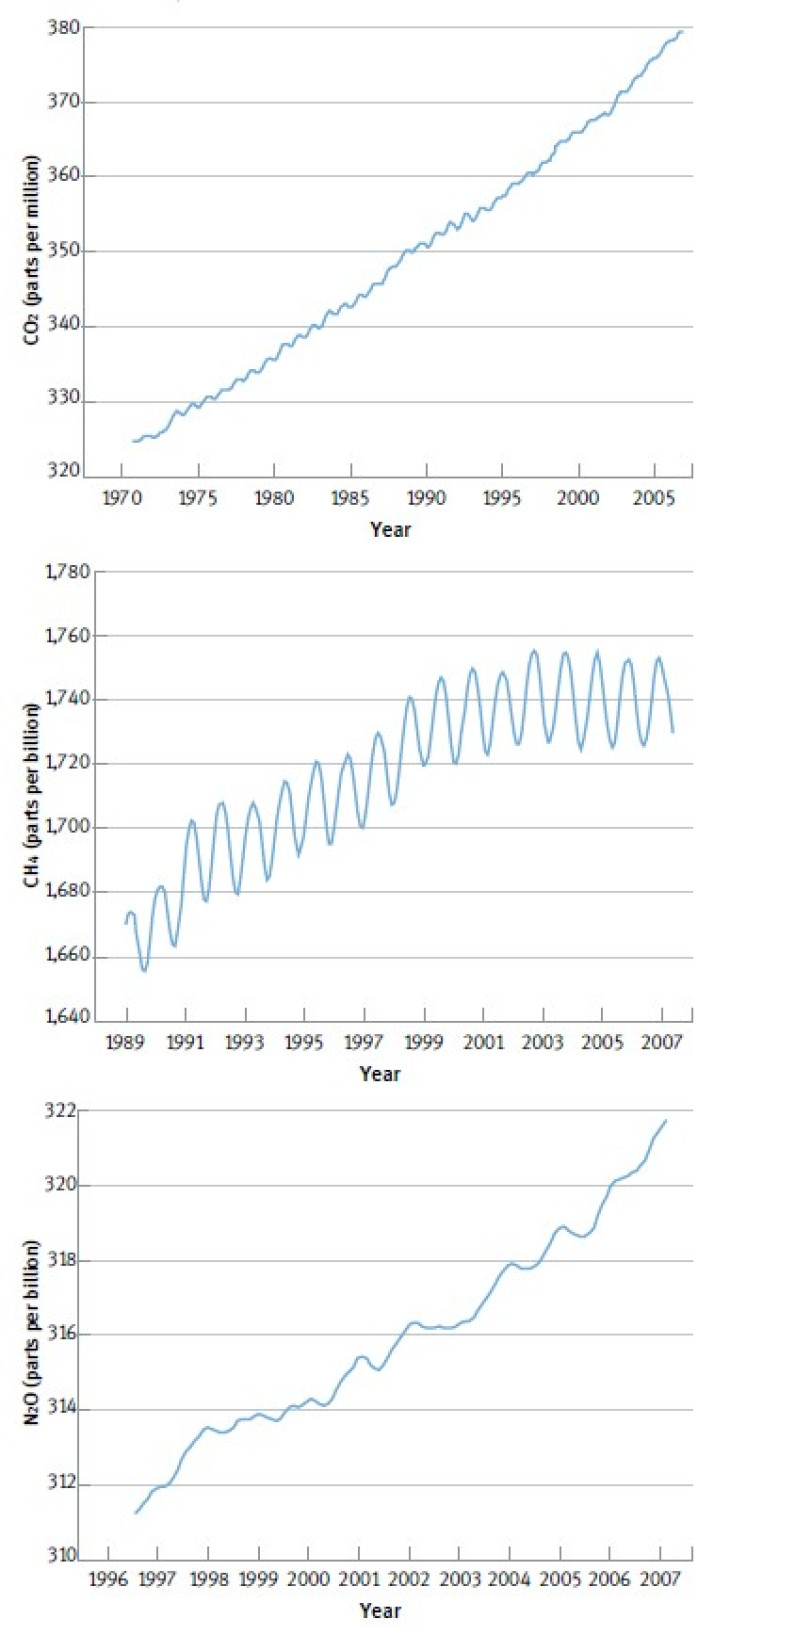
Image: Source: National Institute of Water and Atmospheric Research.

Image: Source: National Institute of Water and Atmospheric Research.
Greenhouse gas emissions and removals
New Zealand’s greenhouse gas emissions represent much less than 1 per cent of total global emissions (Organisation for Economic Co-operation and Development, 2007). While our total emissions are small in the global context, New Zealand ranks 12th in the world for emissions per head of population. For comparison purposes, Figure 8.4 shows carbon dioxide emissions on a population basis for key countries.
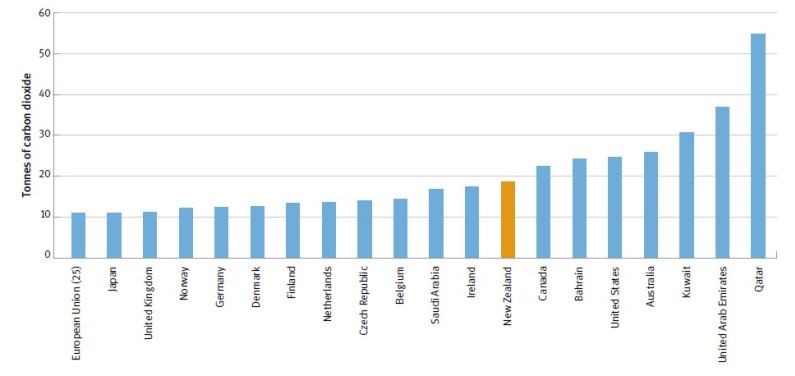
Image: Note: The European Union represents 25 countries, and is an average. Source: Baumert et al, 2005.
National information on greenhouse gas emissions is compiled annually. The data is reported two years in arrears according to international obligations, allowing time for collection, analysis, and reporting. This means that the most recent compiled data for New Zealand is for 2005.
As Figure 8.5 shows, New Zealand has an unusual greenhouse gas emission profile for a developed nation: methane and nitrous oxide from our agricultural sector account for close to 50 per cent of our total emissions. Most of the remainder (43 per cent) is carbon dioxide from energy generation and transport. Many other developed nations have comparatively lower agricultural emissions, and higher emissions from energy generation.

Image: Source: Ministry for the Environment, 2007.
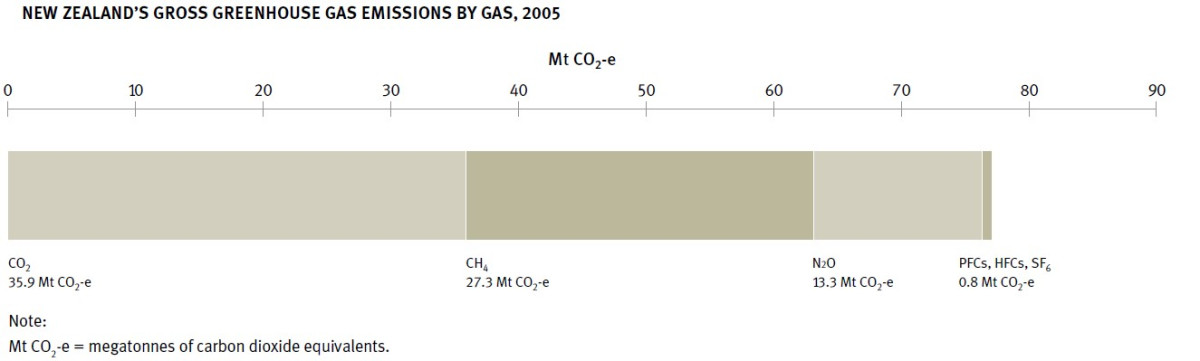
Image: Source: Ministry for the Environment, 2007.
Global warming potentials and CO2 equivalents
Each greenhouse gas has a different warming potential (the relative warming effect of the gas when compared with carbon dioxide). For example, methane has 21 times the global warming potential of carbon dioxide. For ease of comparison, volumes of greenhouse gas emissions and removals are reported in terms of carbon dioxide equivalents (CO2-e) based on 100-year global warming potentials.
Figure 8.6 tracks emissions of carbon dioxide, methane, nitrous oxide, sulphur hexafluoride (SF6), and perfluorocarbons (PFCs) in New Zealand between 1990 and 2005. It shows that emissions of carbon dioxide, methane, and nitrous oxide increased between 1990 and 2005. The increase between 1990 and 2005 for carbon dioxide emissions is 41 per cent.
Total emissions of greenhouse gases in New Zealand for 2005 were 77.2 million tonnes of carbon dioxide equivalents (Mt CO2-e). Figure 8.7 shows that the total emissions in 2005 were 25 per cent higher (15.3 Mt CO2-e) than they were in 1990 (61.9 Mt CO2-e).
Greenhouse gases are removed from the atmosphere by forests, because the trees absorb carbon dioxide as they grow – these are termed ‘forest sinks’ or ‘carbon sinks’.
Planted forests removed a total of 24.5 Mt CO2-e from the atmosphere in 2005, equivalent to 32 per cent of New Zealand’s total greenhouse emissions in that year. This represents an increase in ‘removals’ of 29 per cent since 1990.
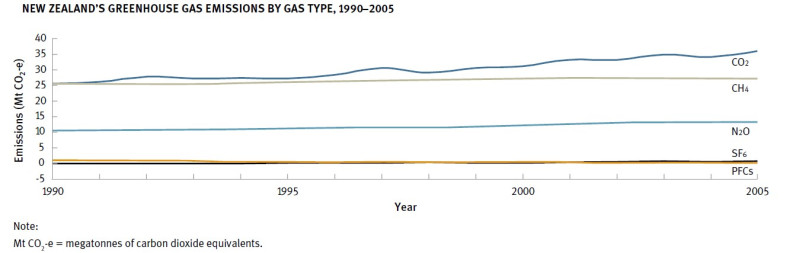
Image: Source: Ministry for the Environment, 2007.

Image: Source: Ministry for the Environment, 2007.

Image: Source: Ministry for the Environment, 2007.
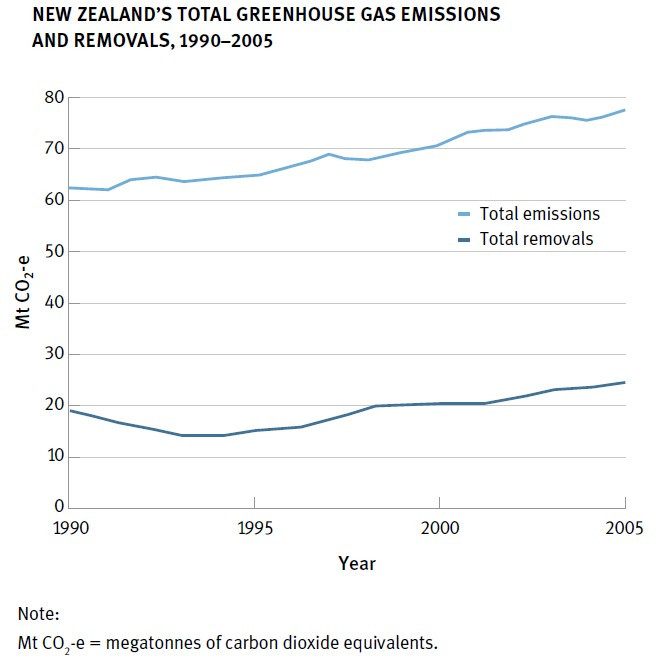
Image: Source: Ministry for the Environment, 2007.
Figure 8.8 shows a summary of New Zealand’s greenhouse gas emissions by sector.
In 2005, agriculture made up 49 per cent of our total emissions, energy 43 per cent, industrial processes 6 per cent, and waste 2 per cent.
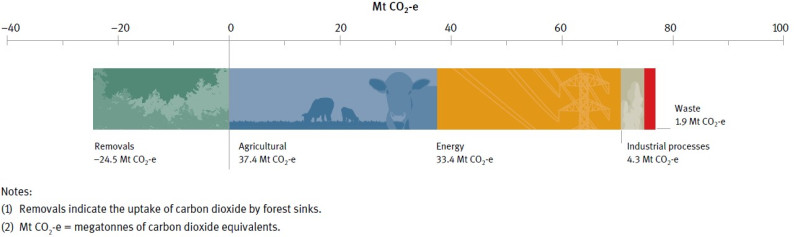
Image: Source: Ministry for the Environment, 2007.

Image: Source: Ministry for the Environment, 2007.
Emissions from the energy sector
The energy sector covers emissions from fuel combustion (including combustion that produces heat in industrial processes), as well as fugitive emissions (emissions that escape from activities relating to fossil fuels). This category includes emissions from the transport sector.
The energy sector produced 33.4 Mt CO2-e, or 43 per cent of total New Zealand emissions in 2005 (see Figure 8.9). Its rate of emissions growth was the highest of any sector in New Zealand between 1990 and 2005. Emissions increased by 9.9 Mt CO2-e, or 42 per cent over the period.

Image: Source: Ministry for the Environment, 2007.
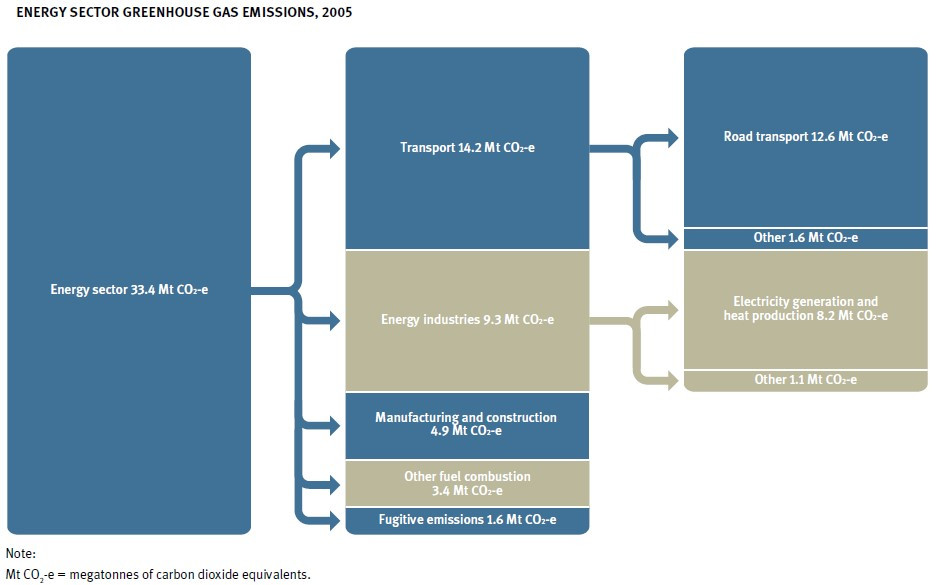
Image: Source: Ministry for the Environment, 2007.
Transport
Transport emissions include those from domestic road, rail, air, and sea transport. In line with international reporting guidelines, international air transport and shipping are not included in these emissions totals.
In 2005, transport contributed 14.2 Mt CO2-e or 18 per cent of New Zealand’s total emissions. Emissions were 62 per cent higher in 2005 than in 1990 (8.8 Mt CO2-e).
Road transport represented 89 per cent (12.6 Mt CO2-e) of domestic transport emissions in 2005. Domestic aviation contributed a further 7 per cent (1.0 Mt CO2-e), shipping 3 per cent (0.4 Mt CO2-e), and rail 1 per cent (0.2 Mt CO2-e). The largest growth in transport emissions is associated with road transport. Emissions from road transport increased by 65 per cent (5.0 MtCO2-e) between 1990 and 2005.
Energy industries
The energy industries category comprises stationary energy supplies. These include electricity generation, petroleum refining, gas processing, and solid fuel manufacturing. Emissions from energy industries were 9.3 Mt CO2-e in 2005 or 12 per cent of national emissions. Energy industries emissions increased by 54 per cent between 1990 and 2005. This increase is primarily due to growth in electricity demand in New Zealand. Growing demand has required more burning of gas, coal, and oil to produce energy. (See chapter 5, ‘Energy’.)
Electricity generation and heat production comprised 88 per cent (8.2 Mt CO2-e) of the energy industries subcategory in 2005.
Manufacturing industries and construction
This category includes emissions from the manufacture of steel, non-ferrous metals, and pulp and paper, and emissions from food processing. Emissions from manufacturing industries and construction contributed 6 per cent (4.9 Mt CO2-e) to New Zealand’s total greenhouse gas emissions in 2005. This represents a 6 per cent increase from 1990 levels.
Other fuel combustion
This category includes emissions from commercial, public, and residential sectors. It covers fuel used by agricultural, fishery, and forestry equipment, and all other fuel combustion emissions. Emissions were 3.4 Mt CO2-e, or 4 per cent of national greenhouse gas emissions in 2005. This was a 17 per cent increase on emissions reported in 1990.
Emissions from the industrial processes and solvents sectors
The industrial processes and solvents sectors produce only a small proportion of New Zealand’s total greenhouse gas emissions.
Industrial processes sector
Emissions from industrial processes include the chemical transformation of one product to another, for example, the reduction of ironsand in steel production. (Emissions from energy used to produce heat in the process are reported within the energy sector.)
The main industrial processes producing greenhouse gases in New Zealand are:
- reduction of ironsand in steel production
- oxidisation of anodes in aluminium production
- production of hydrogen
- calcination of limestone for use in cement production
- calcination of limestone for lime
- production of ammonia and urea.
Most greenhouse gas emissions in this sector are in the form of carbon dioxide. Small contributions come from perfluorocarbons and sulphur hexafluoride.
Emissions from industrial processes were 4.4 Mt CO2-e in 2005 (see Figure 8.10) and represent 6 per cent of total national emissions. This emission category has grown by 32 per cent since 1990, mainly due to an increase in emissions from metal production and consumption of perfluorocarbons.

Image: Source: Ministry for the Environment, 2007.
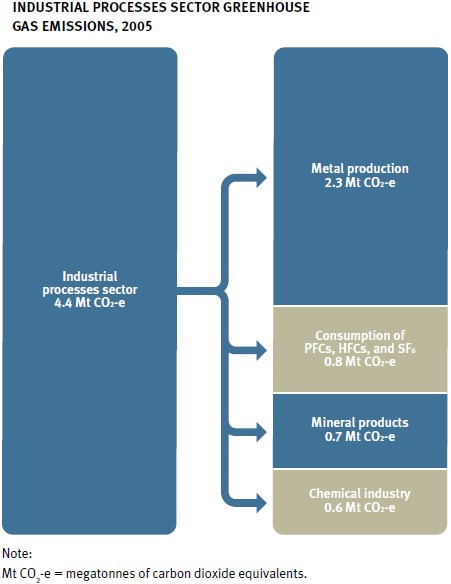
Image: Source: Ministry for the Environment, 2007.
Solvents sector
Most emissions in the solvents sector are indirect emissions, which are reported but do not get counted with New Zealand’s total emissions. Indirect emissions are from evaporation of volatile chemicals when solvent-based products are exposed to air. This occurs during processes such as chemical cleaning, dry cleaning, printing, metal degreasing, and from a variety of industrial and household chemical uses. Emissions from paints, lacquers, thinners, and related materials are also included.
The category, which includes solvents and other product use, is a minor contributor to New Zealand’s total greenhouse gas emissions, being responsible for just 0.05 Mt CO2-e. Emissions have increased by 16 per cent since 1990.
Emissions from the agricultural sector
New Zealand has a unique emissions profile with 49 per cent (37.4 Mt CO2-e) of emissions in 2005 produced by the agricultural sector (see Figure 8.11). Typically, emissions from agriculture for other developed countries make up around 12 per cent of total emissions. Agriculture contributes 96 per cent of New Zealand’s total nitrous oxide emissions and 91 per cent of total methane emissions. Emissions have increased by 15 per cent from 1990 levels (32.5 Mt CO2-e).
Emissions of methane and nitrous oxide are produced when biomass (organic matter) is consumed or decays. Naturally occurring emissions are modified by human activities such as cultivation, addition of nitrogenous fertilisers, farming of livestock, and deliberate burning.

Image: Source: Ministry for the Environment, 2007.
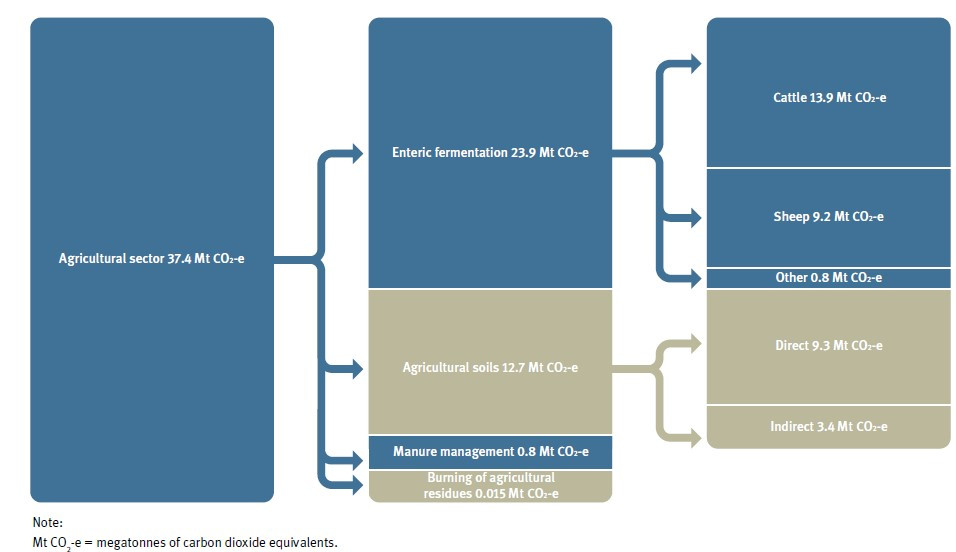
Image: Source: Ministry for the Environment, 2007.
Enteric fermentation
Enteric fermentation is a digestion process in ruminant livestock. The process produces methane. This is New Zealand’s highest single emissions category, contributing 23.9 Mt CO2-e, or 31 per cent to total national emissions in 2005. Enteric fermentation represents 64 per cent of all emissions from agriculture. Emissions have increased by 10 per cent since 1990.
Agricultural soils
Nitrous oxide emissions in this category are associated with the application of nitrogenous fertilisers, animal effluent deposited on agricultural soils, and the use of nitrogen-fixing crops. Emissions can be direct from the soil, and indirect through atmospheric deposition, leaching, and run-off. Agricultural soils contributed 34 per cent of all agricultural emissions primarily as nitrous oxide (12.7 Mt CO2-e) in 2005. Emissions were 27 per cent higher than in 1990.
Manure management
This category produces nitrous oxide and methane emissions from the decomposition of animal waste held in manure management systems (for example, stored in ponds). Emissions were 0.8 Mt CO2-e in 2005.
Grassland burning and burning of agricultural residues
This category includes emissions from the controlled burning of tussock grasslands. The amount of tussock burned has been steadily decreasing since 1959. Emissions from this category comprised 0.001 Mt CO2-e in 2005.
Emissions are also produced from field burning of crop residues (from barley, wheat, and oats). Emissions were 0.014 Mt CO2-e in 2005.
Emissions from the waste sector
Greenhouse gas emissions from waste are predominantly methane, formed from organic wastes (such as food) as they break down over time. Small amounts of nitrous oxide are also generated from the incineration of solvents and decomposition of human waste.
Carbon dioxide emissions from the breakdown of organic material derived from plant materials are not reported because the carbon dioxide emitted is assumed to be reabsorbed in crops in the following year.
Waste emissions were 1.9 Mt CO2-e in 2005, a decrease of 26 per cent since 1990 (see Figure 8.12). This decrease is because of improved capturing of landfill gas from solid waste disposal. The waste sector contributed 2 per cent to New Zealand’s total greenhouse gas emissions in 2005.
Solid waste disposal on land represented 79 per cent (1.5 Mt CO2-e) of waste sector greenhouse gas emissions in 2005. The remainder (21 per cent) is associated with wastewater handling. Wastewater emissions are largely associated with sewage from New Zealand’s human population.
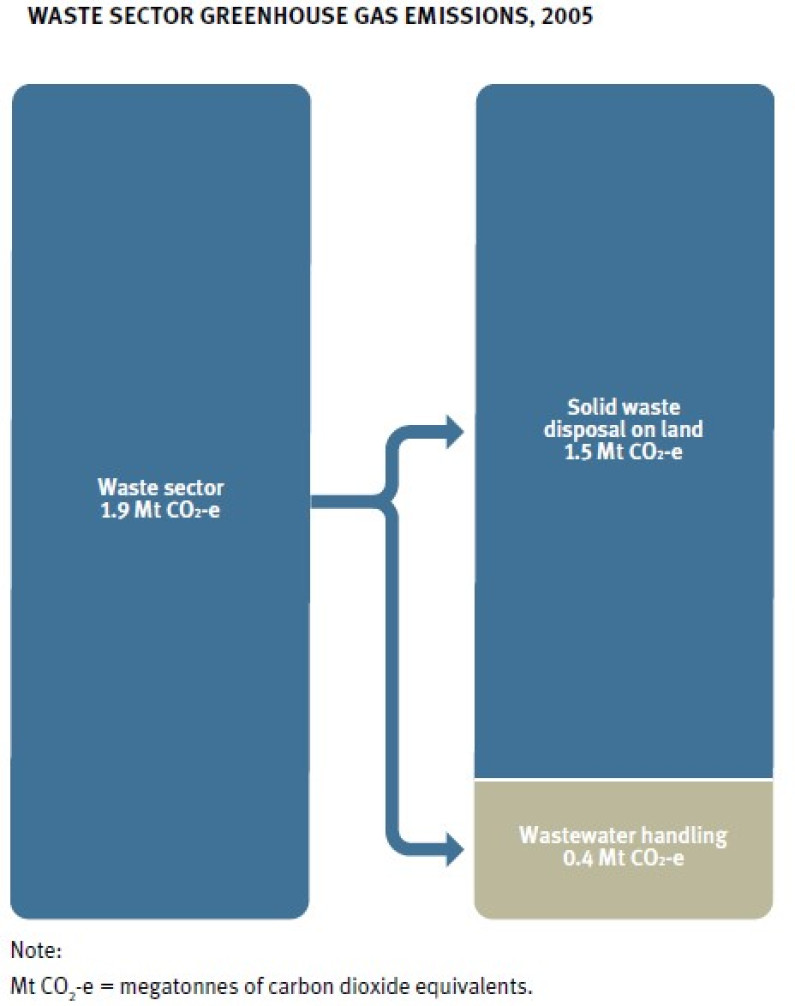
Image: Source: Ministry for the Environment, 2007

Image: Source: Ministry for the Environment, 2007
Climate change legislation
Climate Change Response Act 2002
The Climate Change Response Act 2002 put in place a legal framework to allow New Zealand to ratify the Kyoto Protocol and to meet its obligations under the United Nations Framework Convention on Climate Change and Kyoto Protocol. The Act will enable New Zealand to trade emissions units (carbon credits) on the international market, and establishes a registry to record holdings and transfers of units. The Act also establishes a national inventory agency to record and report information relating to greenhouse gas emissions in accordance with international requirements.
Resource Management Act 1991 and climate change
Under the Resource Management (Energy and Climate Change) Amendment Act 2004 the Resource Management Act 1991 was amended to:
(a) make explicit provision for all persons exercising functions and powers under the principal Act to have particular regard to—
(i) the efficiency of the end use of energy; and
(ii) the effects of climate change; and
(iii) the benefits to be derived from the use and development of renewable energy; and
(b) to require local authorities—
(i) to plan for the effects of climate change; but
(ii) not to consider the effects on climate change of discharges into air of greenhouse gases.
The Resource Management (Energy and Climate Change) Amendment Act 2004 confirmed the Government’s policy that emissions of greenhouse gases be controlled at a national level. The Act removed the power of local government to consider the effect of greenhouse gas emissions on climate change when making rules in regional plans, or when determining air discharge consents, except where necessary to implement a national environmental standard.
One national environmental standard for air quality relates to greenhouse gas emissions. It requires that all operating landfills with a capacity of over 1 million tonnes of refuse collect and either destroy or utilise greenhouse gas emissions (methane).
Under the Resource Management Act 1991, there remains some power for regional councils to control emissions, but not for climate change purposes.
Emissions and removals from the land use, land-use change, and forestry sector
Changes in the amount of carbon in vegetation and soil as a result of human activity are reported in the land use, land-use change, and forestry (LULUCF) sector. This includes removals of greenhouse gases from the atmosphere by forest sinks, as well as emissions from changes in land use.
Forests remove carbon dioxide from the atmosphere and store it as carbon.
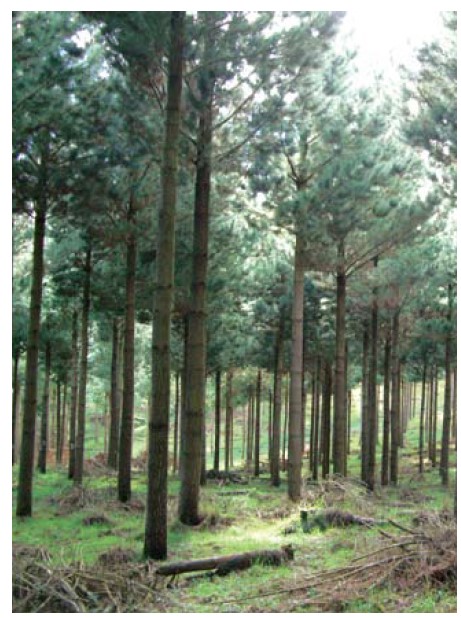
Source: Courtesy of Peter Wiles, Ngahere Muri Forestry Limited.
The category includes changes in six land-use types: forest land, cropland, grassland, wetlands, settlements, and other land. Transfers of land use from one type to another can result in either carbon dioxide emissions or removals. In addition, even where land use stays the same, changes in carbon emissions or removals can occur. An example is where planted forest growth removes carbon dioxide from the atmosphere and stores it as carbon. Emissions can also arise from burning of forest slash (branches and other woody debris from forest harvesting that are not removed from the site), decay of biomass, and changes in soil carbon.
In New Zealand, on balance, this sector represents a carbon sink; that is, there are more removals in this sector than emissions. As noted earlier, removals of greenhouse gas emissions in 2005 equated to 24.5 Mt CO2-e (see Figure 8.13). This removal is equivalent to 32 per cent of our total greenhouse gas emissions. Overall, total LULUCF removals have increased in New Zealand by 29 per cent between 1990 and 2005.
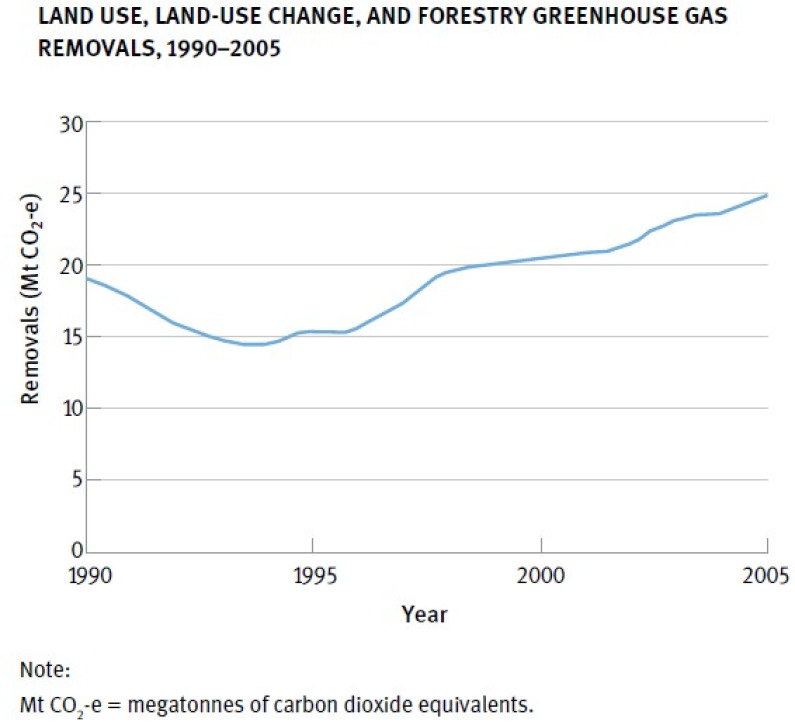
Image: Source: Ministry for the Environment
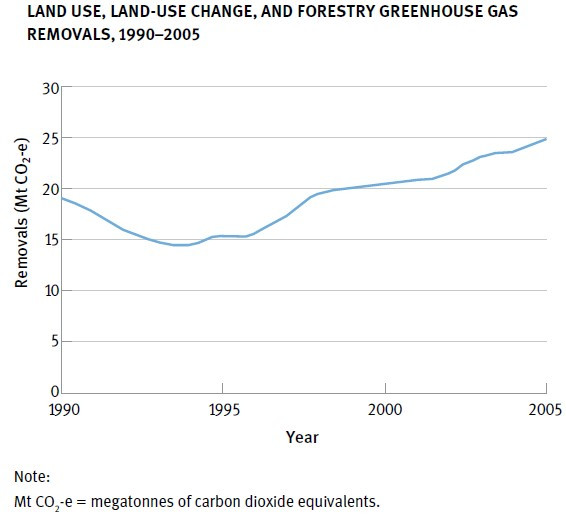
Image: Source: Ministry for the Environment
The trends observed in this sector primarily reflect New Zealand’s changing land-use and forestry activities, particularly during the 1990s with the high forestry planting rates (see chapter 9, ‘Land’, for details on forestry planting and deforestation). In 2005, removals of greenhouse gases from forestry represented the majority of removals in the sector. Removals of greenhouse gases from other changes in land use were not significant.
Local action on climate change
Communities for Climate Protection – New Zealand
Communities for Climate Protection – New Zealand (CCP–NZ) is a voluntary programme that helps local government reduce greenhouse gas emissions from council operations and their wider communities. CCP–NZ provides a framework for taking action to reduce greenhouse gas emissions through energy conservation, renewable energy, sustainable transport, waste reduction, improved building and urban design, and emission-reduction technologies.
Bay of Plenty adaption to climate change
In May 2005, the Western Bay of Plenty was hit by an intense storm that caused flooding throughout the region. A state of emergency was declared, because stormwater infrastructure, roading, and private properties were substantially damaged by the flooding.
While average annual rainfall in the Bay of Plenty is expected to decrease with climate change, extreme rainfall events and flooding such as that which occurred in May 2005 are projected to increase. This has significant implications for new subdivisions and development in the area.
In response, the Tauranga City Council now considers climate change impacts when designing all new or upgraded stormwater infrastructure. The Council has also incorporated the factor of increased high-intensity rainfall into its planning for growth and development in the region over the next 50 years.
Tauranga City Council has upgraded the city's stormwater infrastructure.
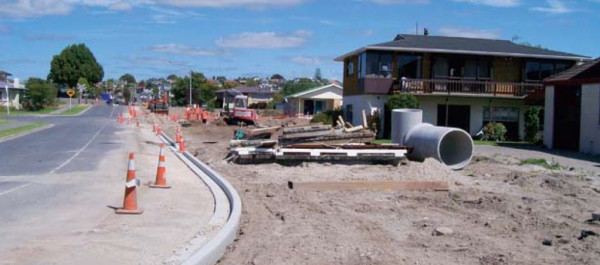
Source: Courtesy of Tauranga City Council.
Impacts of sea level rise on the Avon River, Christchurch
In 2003, Christchurch City Council examined the potential effects of climate change on the Avon catchment and associated coastal areas, and how these risks could be managed.
The study focused primarily on an economic analysis of likely damages, and the response options available to local government to mitigate these. Possible responses the study discussed included minimum floor levels for buildings, subdivision restrictions, stopbank improvements, and tidal barrages.
Since this study was undertaken, changes have been made to the city plan and aspects of the study’s findings have been incorporated into the Urban Development Strategy that seeks to reduce the risks to the community from climate change. Options such as set-backs from waterways and raised floor levels of buildings in flood-prone areas have been incorporated.
Wellington City Council and CLINZI
Wellington City Council has undertaken a CLINZI (Climate's Long-term Impact on New Zealand's Infrastructure) study that asked, ‘What is the impact of climate change on infrastructure systems and services in Wellington City?’
CLINZI is an integrated assessment process for assessing the long-term impact of climate on infrastructure investments. It has been developed by the New Zealand Centre for Ecological Economics in conjunction with the National Institute of Water and Atmospheric Research and the International Global Change Institute, and involves the generation of local climate scenarios, regression modelling, and qualitative analysis, all within a risk-management framework.
The risk analysis work identified several areas requiring further attention by Wellington City Council, including:
- change in water demand
- possible reduction in water quality
- effect of sea-level rise on stormwater discharge rates to the sea
- changes in electricity demand
- impacts on transmission assets
- impacts of erosion and extreme rainfall events on maintenance of roads
- changes in traffic demand.
The analysis of policies and strategies concluded that, while Wellington acknowledged potential climate-change risk in a range of official documents such as the Regional Policy Statement, further work is needed on incorporating climate change impacts in other policies and plans.
Incorporating climate change adaptation into the state highway network
As the Crown Entity responsible for state highways, Transit New Zealand is required to assess and manage risks to New Zealand’s transport network, and ensure its sustainability.
Transit New Zealand recognises that it is prudent to consider climate change in the design and planning of all major long-life infrastructures such as bridges, culverts, and causeways that could be affected by climate change impacts within the working life of the structure.
Future-proofing at the design stage makes later retrofits both feasible and cost-effective. Some new state highway projects are already considering the impacts of climate change during design and construction. For example, the new section of causeway for Auckland’s Upper Harbour Corridor (State Highway 18) was built 0.3 metres higher than the existing causeway, which was then raised to match it. This was in direct response to predicted sea-level rise.
Stratospheric ozone levels
Stratospheric ozone levels in New Zealand have changed considerably over time, as shown in Figure 8.14. Levels have stabilised in the last decade, reversing decreases in the 1980s and 1990s. A turning point in ozone concentrations may have been reached in 1997. Much of the stabilisation over the last decade can be attributed to reduced ozone depletion over Antarctica as a result of higher springtime polar temperatures and slightly reduced levels of chlorine and bromine in the stratosphere.
The average ozone concentration in 2006 was 298 DU (Dobson units), one of the five lowest levels on record (National Institute of Water and Atmospheric Research, pers comm). The 2006 level can be explained by unusual stratospheric weather in that year (Bodeker et al, 2007).
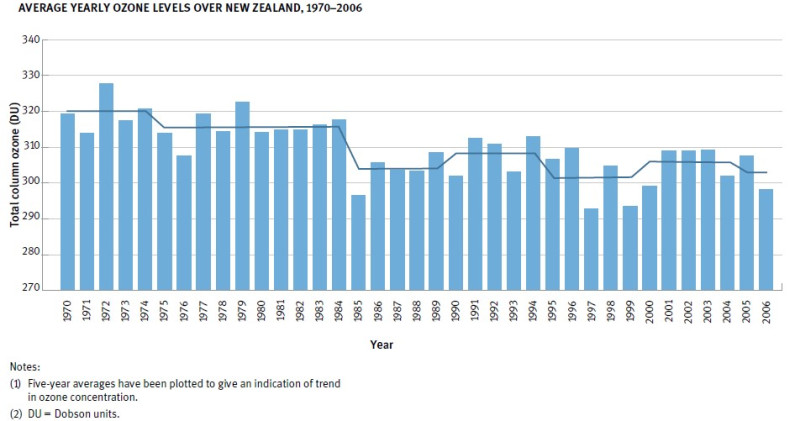
Image: Source: National Institute of Water and Atmospheric Research

Image: Source: National Institute of Water and Atmospheric Research
Levels of ozone-depleting substances in the atmosphere
As discussed earlier, atmospheric concentrations of chlorine and bromine drive ozone depletion. Figure 8.15 shows the changing concentration of atmospheric chlorine and bromine expressed as ‘chlorine equivalents’. Levels of these gases are expressed in units of equivalent effective chlorine, in much the same way as greenhouse gases are expressed in carbon dioxide equivalents.
Comparison of Figures 8.14 and 8.15 shows that ozone levels track closely to average annual levels of chlorine equivalents, although there is a time lag. Concentrations of atmospheric chlorine and bromine have decreased over New Zealand since 1996 and over Antarctica since 2001 (National Institute of Water and Atmospheric Research, pers comm). This decrease is primarily because of the global adherence by parties to the Montreal Protocol (see box ‘Montreal Protocol’), which established targets for the reduction in the use of ozone-depleting substances.
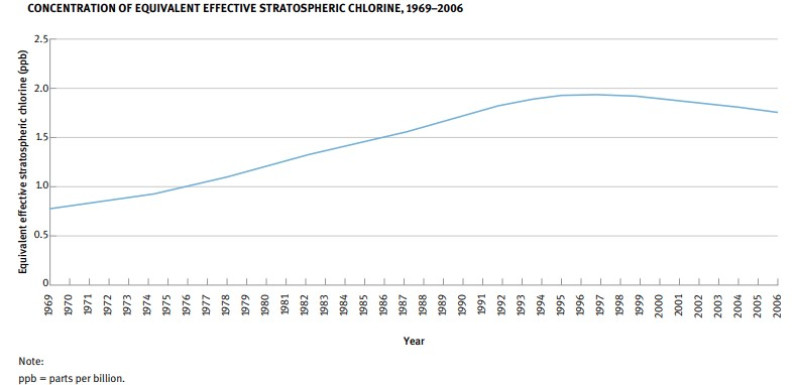
Image: Source: National Institute of Water and Atmospheric Research
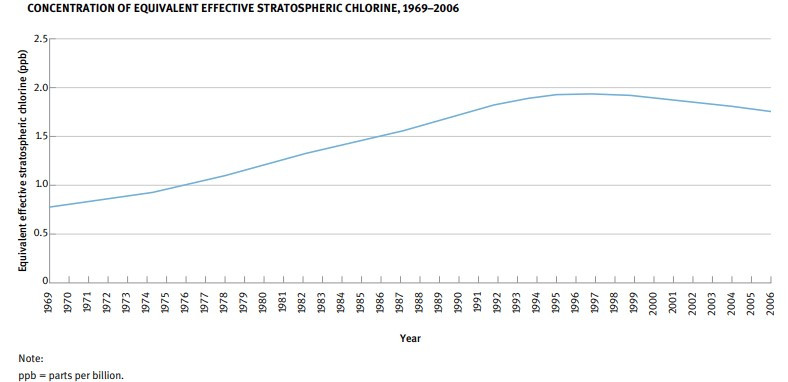
Image: Source: National Institute of Water and Atmospheric Research
Montreal Protocol
The Montreal Protocol on Substances that Deplete the Ozone Layer 1987 sets targets for reducing the production and consumption of ozone-depleting substances. The protocol originally required parties to reduce chlorofluorocarbon (CFC) use to 50 per cent below 1986 levels by 1998, and to freeze halon consumption at 1986 levels from 1992.
The provisions of the protocol have since been tightened through a series of amendments. Halons and CFCs were phased out completely by the early to mid-1990s. Phase-out schedules were agreed for other substances as the impact of those substances on ozone layer depletion became better understood.
New Zealand’s obligations under the Montreal Protocol are implemented through the Ozone Layer Protection Act 1996 and the Ozone Layer Protection Regulations 1996.
Ultraviolet radiation
Ozone depletion reduces the protective properties of the atmosphere and allows higher levels of UV radiation to reach the earth’s surface. Figure 8.16 tracks summertime UV index levels over New Zealand against ozone concentrations. This comparison shows the impact of ozone levels on UV: when ozone levels are low, we experience a high UV index.
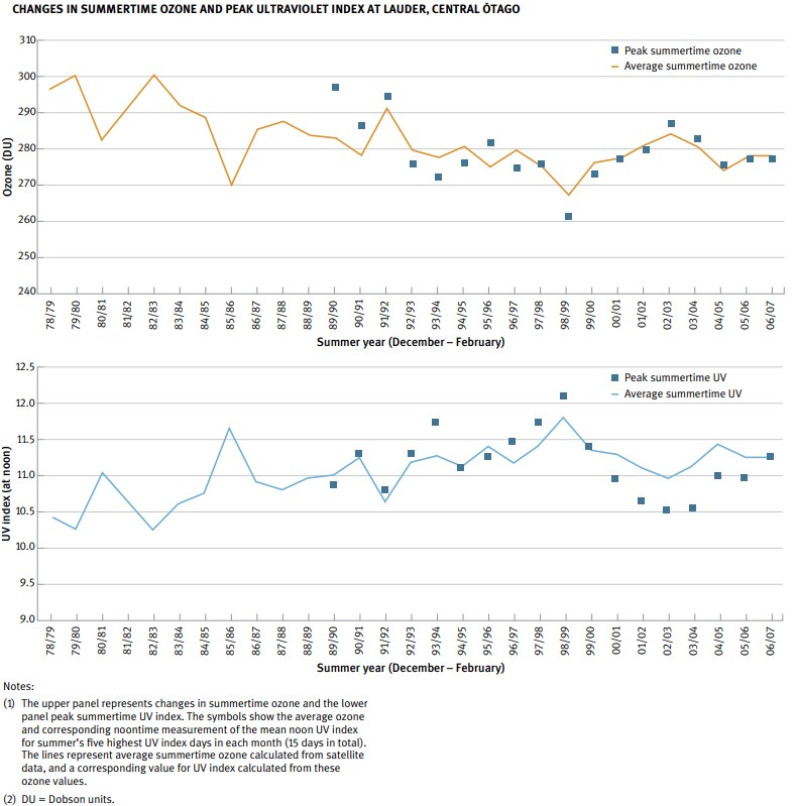
Image: Source: National Institute of Water and Atmospheric Research
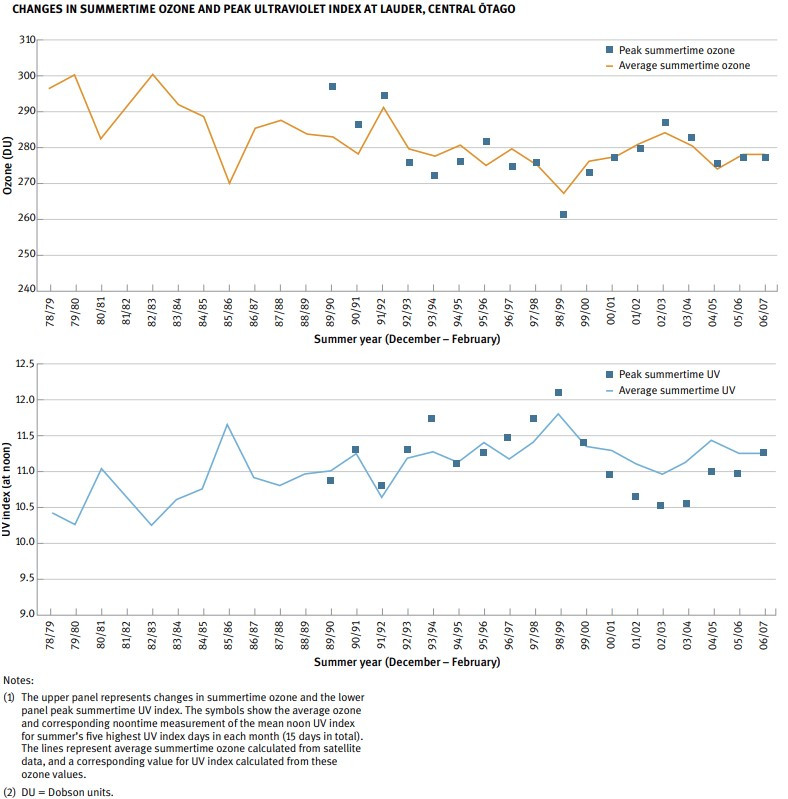
Image: Source: National Institute of Water and Atmospheric Research
The 1997 report, TheState of New Zealand’s Environment 1997, concluded that:
New Zealand contributes an above-average share to the world total of human induced carbon dioxide gas emissions but less than the average for developed countries. …
Although existing measures have achieved some reduction below a ‘business as usual’ projection, New Zealand is not on track to achieve its current commitment under the Framework Convention on Climate Change of stabilising CO2 at 1990 levels by the year 2000. …
Depletion of the ozone layer will continue for many decades and requires international action. New Zealand has been, and remains, an active participant in the responses to ozone loss including the signing of the Montreal Protocol and the banning of CFC imports in their raw form. We have moved to phase out the use of ozone-depleting substances faster than internationally required but do not yet have a phase-out schedule for methyl bromide. (Ministry for the Environment, 1997, chapter 10.)
The report also raised some issues about the availability of data.
Greenhouse gases and potential climate change:
National data on weather patterns, temperature, rainfall etc. are generally of high quality and go back many decades. Data on greenhouse gas concentrations in the atmosphere are also of high quality and go back two decades. Data on some greenhouse gas emissions are still limited and uncertain, but estimates of carbon dioxide emissions from energy and industrial processes can be accurately calculated from economic data. Good data on carbon storage in pine plantations are available, but are lacking for indigenous forests and soils. (Ministry for the Environment, 1997, chapter 10.)
Ozone depletion:
Data on ozone concentrations are of high quality and go back about a decade. National data on imports of some ozone-depleting substances exist, but no data exist on the use of and emission of ozone depleting substances. (Ministry for the Environment, 1997, chapter 10.)
Climate change
In 1997, much of the global debate on climate change was still focused on the growing body of scientific evidence and interpreting what this meant. Today, there is global consensus on the urgent need for response to climate change, both in terms of reducing greenhouse gas emissions, and in preparing for its impacts. This global consensus was set in motion, in part, through the Kyoto Protocol, which set binding reduction targets for developed countries for the period 2008–2012.
New Zealand’s greenhouse gas emissions
Zealand’s greenhouse gas emissions represent much less than 1 per cent of total global emissions (Organisation for Economic Co-operation and Development, 2007). However, relative to its population size, New Zealand continues to have high emissions, and is ranked 12th in the world per head of population. New Zealand has a lower level of per capita emissions than other Organisation for Economic Co-operation and Development countries, such as Australia and Canada, but higher levels than the United Kingdom and Germany.
Our annual emissions have grown by 25 per cent since 1990 as the population and economy have grown. This growth continues to present a challenge in light of our Kyoto Protocol commitments to reduce emissions to 1990 levels, on average, over the period 2008–2012.
The largest growth in emissions since 1990 has been in the energy sector (an increase of 9.9 Mt CO2-e) and the agricultural sector (almost 5 Mt CO2-e). However, growth in our emissions has been tempered by an increase in removals of greenhouse gases by carbon sinks since 1990 (–5 Mt CO2-e).
New Zealand faces particular difficulty in reducing greenhouse gas emissions because of our unique emissions profile – half of our emissions come from the agricultural sector. Since 1997, the management of greenhouse gas emissions in New Zealand has largely focused on investing in research to reduce our significant agricultural emissions and developing programmes to reduce energy and transport emissions, deforestation, and encourage new forest sinks.
Present and future management
Climate change is a long-term issue that presents both risks and opportunities for New Zealanders. We start from a relatively favoured situation with high levels of renewable electricity generation, and low population density. Forest cover is extensive, we enjoy a temperate climate, and awareness of environmental issues is well-established. But we also face challenges. Much of our economy is based on biological industries which will be affected by a changing climate. We are also distant from markets and customers, including our tourism markets so there is a perception that the carbon footprint of our exported goods and services is high.
Present policy development is focusing on policies that reflect our own particular national circumstances, as well as those that seek global solutions.
In addition to sector-specific policies, an emissions trading scheme is under development to reduce greenhouse gas emissions nationally (see box 'Government action on climate change').
Under such a scheme, prices are established for units to emit greenhouse gases. Those prices then influence decisions throughout the economy by producers, consumers, and investors, driving the reduction of emissions and the expansion of more environmentally friendly alternatives.
For New Zealand, both now and in the future, taking effective domestic action will mean both shouldering responsibility for managing the reduction of our national emissions, and creating the platform upon which we can contribute internationally to achieving a broad and effective global response to climate change.
Government action on climate change
Sector-specific policies
A number of initiatives and policies are underway to reduce New Zealand’s greenhouse gas emissions. These include:
- sustainable transport programmes
- energy conservation and efficiency initiatives
- minimum energy-performance regulations
- funding for healthy housing
- air quality regulations
- sustainable land-use policies
- fuel efficiency labelling schemes
- new building standards.
Emissions Trading Scheme
In addition to sector-specific policies, the Government announced in September 2007 that it would introduce an economy-wide Emissions Trading Scheme to reduce New Zealand's greenhouse gas emissions. The scheme is to be phased in from 2008, beginning with the forestry sector, and including all sectors (transport, energy, industry, and agriculture) and greenhouse gases over time.
The Emissions Trading Scheme will set up a market that puts a value on greenhouse gas emissions. It will encourage companies that cut their emissions and make it more expensive for companies who do not.
Commitments and targets
At the same time, the Government has announced several specific targets relating to energy and climate change:
- a goal to increase renewable electricity generation to 90 per cent of New Zealand's total electricity generation by 2050
- a goal to reduce per capita emissions from the transport sector by half by 2040
- a goal to increase forest area by 250,000 hectares by 2020
- for New Zealand to be one of the first countries to widely deploy electric vehicles
- six lead public sector agencies to be carbon neutral by 2012, and the remaining 28 core public sector agencies to be on the path to carbon neutrality by 2012. (See box 'Government action on sustainability' in chapter 3, 'Household consumption'.)
Pastoral Greenhouse Gas Research Consortium
The Government and the agricultural sector signed a memorandum of understanding in 2003 to jointly initiate the Pastoral Greenhouse Gas Research Consortium. The signatories cooperate on research to develop practical and cost-effective farm practices and technologies to reduce agricultural emissions.
The research aims to:
- develop on-farm technologies to improve production efficiency for ruminants
- develop on-farm technologies that lower methane emissions from New Zealand ruminants and nitrous oxide from grazing-animal systems
- exploit commercial opportunities arising in a global market.
Projects to Reduce Emissions programme
The Projects to Reduce Emissions programme introduced its first tender round in 2003 to support new initiatives – mainly in the energy sector – that reduce greenhouse gas emissions by awarding emissions units, or ‘carbon credits’. As these emission units are internationally tradable, the programme was designed to ‘lift over the line’ projects that were not commercially viable.
Permanent Forest Sink Initiative
The Permanent Forest Sink Initiative was introduced in 2006 to promote the establishment of new, permanent forests on previously unforested land. The initiative gives landowners the opportunity to generate income through ‘carbon farming’ – creating new carbon sinks. Participants are able to claim credits under the Kyoto Protocol that can then be on-sold.
Plan of Action for Sustainable Land Management and Climate Change
In 2006, a discussion document, Sustainable Land Management and Climate Change: Options for a Plan of Action, was released for public consultation. $170 million has been committed between 2007–2012 to develop and deliver the plan of action, which centres around five key pillars of work (adaptation to climate change; reducing greenhouse gas emissions alongside the Emissions Trading Scheme; business opportunities arising from climate change; research and technology transfer; and communications).
Stratospheric ozone
The 1997 report identified that the ozone layer was depleting and would continue to do so for several decades. The report also observed that UV radiation appeared to be increasing in response to ozone depletion.
Internationally, as a result of actions under the Montreal Protocol, there has been rapid progress in reducing the use of ozone-depleting chemicals. This has led to more stable levels of ozone over New Zealand and Antarctica. As a consequence, UV radiation is no longer increasing, and in recent years has decreased.
However, stratospheric chlorine and bromine levels are falling only slowly, so full recovery of the ozone layer is some way off.
Ozone-depleting chemicals
Although New Zealand is not a producer of ozone-depleting chemicals, the Government has regulated imports of them. Domestic controls (through the Ozone Layer Protection Act 1996 and Ozone Layer Protection Regulations 1996) reduce New Zealand’s reliance on ozone-depleting substances by progressively restricting the volumes imported. Efforts have also focused on reducing the quantity of ozone-depleting substances in use.
With the introduction of the Halon Management Strategy in 2000, over 30,000 tonnes of halons have been collected for safe destruction. This quantity of halons had the potential to destroy over 1.6 billion tonnes of atmospheric ozone.
A recent Organisation for Economic Co-operation and Development report (Organisation for Economic Co-operation and Development, 2007) states that New Zealand is the world’s 11th largest user of ozone-depleting methyl bromide. The use of methyl bromide for quarantine and pre-shipment processes can be attributed to increased biosecurity requirements for imports and exports (The Minister of Commerce and the Minister for the Environment, 2006).
Importing methyl bromide for uses other than quarantine and pre-shipment treatments is now prohibited, unless allowed by an exemption for ‘critical use’. The parties to the Montreal Protocol approved an exemption for the New Zealand strawberry industry for soil fumigation for the year ending 31 December 2007. The Government has decided that no further nominations for critical use of methyl bromide in the strawberry industry will be supported.
Improvements in data
The 1997 report identified some shortcomings in atmospheric data. In particular, the report found that New Zealand did not hold data on the use and emission of ozone-depleting substances. Progress has been made since that time, with more comprehensive data collected annually since legislation came into force.
There have also been improvements in estimations and calculations of our greenhouse gas inventory data. Emphasis has been placed on development of a Land-Use and Carbon Analysis System, a database to store and analyse land use and carbon stock changes over time. This database will assist with the development and reporting of climate change policy to meet New Zealand’s obligations under the Kyoto Protocol. Mandatory reporting of greenhouse emissions under the United Nations Framework Convention on Climate Change and Kyoto Protocol will ensure data in New Zealand continues to improve over time.
Baumert, K A, Herzog, T, and Pershing, J. 2005. Navigating the Numbers: Greenhouse gas data and international climate policy. Washington: World Resources Institute.
Bodeker, G E, Garny, H, Smale, D, Dameris, M, and Deckert, R. 2007. The 1985 southern hemisphere mid-latitude total column ozone anomaly. Atmospheric Chemistry and Physics Discussions, vol 7, pp 7137–7169.
Intergovernmental Panel on Climate Change. 2007a. Climate Change 2007: The physical science basis. Contribution of Working Group I to the Fourth Assessment Report of the Intergovernmental Panel on Climate Change. Solomon, S, Qin, D, Manning, M, Chen, Z, Marquis, M, Averyt, K, Tignor, M B, and Miller, H L (eds). Cambridge, United Kingdom and New York, United States: Cambridge University Press.
Intergovernmental Panel on Climate Change. 2007b. Summary for Policymakers. Climate Change 2007: Impacts, adaptation and vulnerability. Contribution of Working Group II to the Fourth Assessment Report of the Intergovernmental Panel on Climate Change. Parry M L, Canziani, O F, Palutikof, J P, van der Linden, P J, and Hanson, C E (eds). Cambridge, United Kingdom: Cambridge University Press.
McKenzie R L, Bodeker, G E, Scott, G, and Slusser, J. 2006. Geographical differences in erythermally-weighted UV measured at mid-latitude USDA sites. Photochemical & Photobiological Sciences vol 5, pp 43–352.
Ministry for the Environment. 1997. The State of New Zealand’s Environment 1997. Wellington: Ministry for the Environment and GP Publications.
Ministry for the Environment. 2004. Climate Change Effects and Impacts Assessment: A guidance manual for local government in New Zealand. Wellington: Ministry for the Environment.
Ministry for the Environment. 2007. New Zealand’s Greenhouse Gas Inventory 1990–2005: The national inventory report and common reporting format. Wellington: Ministry for the Environment.
Organisation for Economic Co-operation and Development. 2007. OECD Environmental Performance Reviews: New Zealand. Paris: OECD Publishing.
The Minister of Commerce and the Minister for the Environment. 2006. Appendices to the Journal of the House of Representatives, G22. Report on the Operation of the Ozone Layer Protection Act 1996 for the period ended 31 December 2005.
Chapter 8: Atmosphere
December 2007
© Ministry for the Environment