Air quality in New Zealand
Good air quality is fundamental to our well-being. Every day each New Zealander inhales about 14,000 litres of air, the equivalent of about 150 full bath tubs.
New Zealand has good air quality in most locations for most of the time. However, coal and wood used for home heating and exhaust emissions from transport can affect air quality in about 30 locations, particularly during winter. About 53 per cent of New Zealanders live in these affected locations.
Pollutants in the air can affect our health, because we inhale them into our lungs. Vulnerable groups such as the very young, the very old, and people with underlying respiratory or cardiac disease are particularly at risk. About 1,100 New Zealanders die prematurely each year from exposure to air pollution. The number of New Zealanders who die prematurely from traffic-related air pollution is similar to the number killed in road accidents each year.
Levels of air pollution in New Zealand
PM10 particulates
In most of the areas in New Zealand where air quality can be poor, the cause is high winter levels of PM10 particulates from coal and wood used for home heating. Auckland, where about a third of New Zealand’s population lives, also experiences high levels of PM10 particulates from road transport. Levels of PM10 particulates appear to be falling in some of the main centres of population, although the influence of weather on air pollution makes it difficult to assess trends. Levels of PM10 particulates at roadside locations in Auckland appear to have fallen over the past 10 years.
Nitrogen dioxide
Levels of nitrogen dioxide are at an acceptable level around New Zealand, with the exception of some locations in Auckland affected by traffic emissions. Emissions of nitrogen dioxide in Auckland appear to be increasing.
Carbon monoxide
Levels of carbon monoxide, mostly from traffic emissions, were of concern 10 years ago. Since then, levels appear to have fallen at locations that have historically experienced high concentrations. The improvement is most likely due to improved vehicle technology.
Sulphur dioxide
Sulphur dioxide levels declined in the 1980s and are considered to be low in most parts of the country. However, the areas around the Marsden Point Oil Refinery and other individual locations have higher levels than the rest of the country.
Ozone
Based on traffic emissions data, areas around Auckland, Hamilton, and Christchurch were identified in the mid-1990s as having the greatest potential for elevated levels of ground-level ozone. However, the results from monitoring indicate that ozone levels are satisfactory in these locations.
PM2.5 particulates, benzene, and airborne lead
Monitoring for PM2.5 particulates is not widespread in New Zealand. However, where PM2.5 particulates are monitored, a strong relationship exists between high levels of PM10 particulates and high levels of PM2.5 particulates.
Benzene levels at monitored locations are at an acceptable level. Levels are higher near busy roads than in residential areas, but appear to be improving. This improvement is probably due to changes in vehicle fuel composition.
Lead was eliminated from New Zealand petrol in 1996, so airborne lead levels are now very low.
Present and future management
Today, the main focus for improving air quality in New Zealand is to reduce PM10 particulate emissions from home heating and traffic. Having put in place regular monitoring of air quality in managed airsheds, future effort will continue to focus on tracking PM10 particulate levels against the 2013 target set under the national environmental standards for air quality.
Future work on improving air quality may also focus on developing a better understanding of PM2.5 levels around New Zealand.
Clean air contributes to New Zealand’s quality of life, not only in terms of people’s health, but also in terms of the beauty of the natural and physical environment.
New Zealand is located in a windy and geographically isolated part of the world. This location means air pollution is often blown away and readily dispersed. New Zealand is not significantly polluted by neighbouring countries and has a low population density and limited amount of heavy industry. The combination of these factors results in good air quality in most locations for most of the time.
As in many developed countries, however, the intensity of human activities in centres of population has an impact on ambient (outdoor) air quality from time to time. An ageing vehicle fleet and the use of coal and wood for home heating can have a detrimental effect on air quality in some areas. In addition, busy, congested roads in some built-up urban areas can adversely affect local air quality.
Natural factors that affect air quality
Two key natural factors that affect air quality are the weather and New Zealand’s geography.
Weather
Pollution levels depend not just on the amount of pollution generated (that is, ‘emissions’), but also on how quickly pollution can be dispersed. In this respect, the weather has a strong influence on pollution levels. For example, ‘temperature inversions’, which trap pollution near ground level, can have an adverse effect on air quality (see box ‘What is a temperature inversion?’ and Figure 7.1). Conversely, particularly windy and unsettled weather can have a beneficial effect on air quality.
Geography
Geographical features also affect the dispersion of air pollution. Settlements in locations with geographical features such as valleys or low-lying land surrounded by hills are often more susceptible to a build-up of pollution.
What is a temperature inversion?
A temperature inversion is a layer of warm air that sits over a layer of cooler air near the ground. Temperature inversion layers typically form just after sundown on still winter nights as the air temperature at ground level rapidly decreases. Because cool air is heavier than warm air, the cool air often remains trapped close to the ground.
Inversion layers occur between 10 and several hundred metres above the ground depending on the weather conditions. Air pollution that gets trapped under the inversion layer can build up, causing air pollution levels to rise (see Figure 7.1).
Figure 7.1: How temperature inversions trap pollution

Image: Source — Ministry for the Environment.
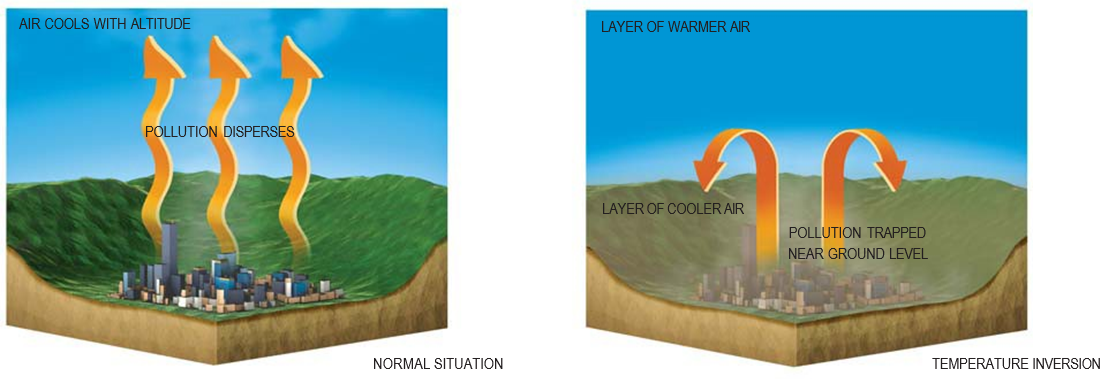
Image: Source — Ministry for the Environment.
Human factors that affect air quality
Home heating and transport are the greatest human influences on ambient air quality in New Zealand.
Our air quality is constantly changing. Pollution levels fluctuate as the amount of pollution emitted varies over time. Morning and evening traffic rush hours cause variations over the day. The use of coal and wood for home heating can make air quality in winter very different from that in summer. Even air quality experienced from one year to the next can vary considerably.
Home heating – the main cause of air pollution
Home heating is the main cause of air pollution in populated areas in the winter. On average, 45 per cent of households in New Zealand burn solid fuels (coal and wood) for home heating. At a regional level, this figure varies considerably across the country, ranging from 32 per cent in Auckland to over 75 per cent on the West Coast of the South Island (Ministry for the Environment, 2005).
Pollution from road transport
Pollution from vehicles can be significant in urban areas, particularly on heavily used roads. New Zealand has one of the highest rates of private vehicle ownership in the world: transportation accounts for the largest share of our energy consumption, and is the second fastest-growing sector in terms of energy demand.
Large centres of population, such as Auckland, are more likely to experience air pollution from vehicles than smaller locations (see photo below).
Older and high-mileage petrol vehicles are more likely to be high emitters of pollution than are newer vehicles (Covec, 2005). The average age of New Zealand motor vehicles is 12.4 years. Nearly two-thirds of the newly registered vehicles in New Zealand are used imports rather than new vehicles (see chapter 4, ‘Transport’).
Until 1996, New Zealand’s petrol contained lead additives, which prevented the use of equipment to control exhaust emissions from petrol vehicles. As a result, many vehicles on New Zealand roads are not built to any emission standards.
Image: Courtesy of Gavin Fisher.
Government action on air quality
Central government undertakes a range of regulatory and non-regulatory initiatives to improve New Zealand’s air quality. Below are examples of government initiatives that have been undertaken in recent years.
Warm Homes initiatives
Through the Warm Homes project, central government is working with local government to help New Zealanders reduce the pollution effects of home heating while staying warm. The project aims to ensure all New Zealanders heat their homes cleanly, efficiently, and sufficiently. Pilot programmes were run in Tokoroa, Timaru, and Taumarunui to retrofit homes with insulation and new heating sources, and evaluate the impacts of this on air quality and health. In 2006, the Warm Homes project also ran seven community workshops in six regions across New Zealand.
In addition, the Government has committed $72 million over four years to help New Zealand families live in warm, dry, healthy, and energy efficient homes. This includes $23 million for an interest-free loans scheme to help householders pay for energy efficiency and cleaner heating options. While the main focus is on energy efficiency, $5.4 million will be targeted at the installation of clean forms of heating for low-income households in areas of poor air quality.
Transport initiatives
Petroleum Products Specifications Regulations 2003
These Regulations specify the technical requirements for petrol and diesel supplied for retail sale (excluding aviation, jet boat, and motor racing). Progressive improvements in fuel specifications have reduced the amount of pollutants such as PM10 and benzene that are emitted from vehicle exhausts. Reduction of aromatics and the lowering of vapour pressure also limit the amount of petrol that evaporates into the air during refuelling and from hot vehicle engines.
The Vehicle Exhaust Emissions Rule
This Land Transport Rule, introduced in 2003, requires all motor vehicles entering the New Zealand fleet for the first time to have been manufactured to the applicable emissions standards specified in the rule. Since 2006, the rule has required all vehicles to undergo a visible smoke test check at every compliance test (that is, border entry, warrant of fitness, and certificate of fitness inspections). This complements the Land Transport (Road User) Rule 2004 which requires that vehicles do not emit visible smoke for more than 10 seconds.
At the time of writing, government is consulting on proposed tighter emissions standards for new vehicles and used vehicles entering New Zealand.
Reducing the sulphur content of diesel in New Zealand
In 2002, the Government introduced regulations that reduced the sulphur content of diesel. By September 2002, the sulphur content of diesel available in Auckland and Northland had reduced from 3,000 parts per million to 1,000 parts per million.
In August 2004, levels were further reduced throughout New Zealand to 500 parts per million. This was followed by another decrease to 50 parts per million in January 2006, representing a 60-fold reduction in sulphur content since 2002. The sulphur content in diesel will be further reduced to 10 parts per million in January 2009.
Other programmes and initiatives
Other programmes and initiatives undertaken by central government include educational or public awareness campaigns, or programmes which support initiatives led by local government. Examples include the following initiatives:
- The Sustainable Management Fund (SMF) was established in 1994 to help communities, iwi, local government, and industry with projects that have a long-term environmental benefit. In 2005, $800,000 of SMF funding was made available to local government to help them implement new air quality monitoring requirements under the national environmental standards for air quality.
- Recent government research relating to air quality includes work on the health and air quality impacts of home heating, and a performance review of the wood burner design standard.
- A number of recent transport initiatives contribute to improved air quality in New Zealand. These include the New Zealand Transport Strategy, Towards a sustainable transport system by 2010, the Biofuels Sales Obligation 2006, a draft New Zealand Rail Strategy, and the 'Choke the Smoke' public awareness campaign on vehicle emissions.
See chapter 1, ‘Environmental reporting’, for more information on the core national environmental indicators and how they are used.
The national environmental indicator for air provides information on air quality in managed airsheds (also known as gazetted airsheds – see box ‘Gazetted airsheds’). To report on the indicator, regional councils and unitary authorities measure levels of PM10 particulates, nitrogen dioxide, carbon monoxide, sulphur dioxide, and ground-level ozone. The indicator compares air quality with New Zealand’s national environmental standards (NESs) for ambient air quality. In this chapter, we refer to the NESs for ambient air quality as ‘ambient standards’.
Gazetted airsheds
Regional councils and unitary authorities have identified and made public (through the New Zealand Gazette) populated areas that are known, or have the potential, to have levels of pollutants higher than permitted by the ambient standards. These areas are referred to as gazetted airsheds.
At the time of publication, 69 airsheds had been gazetted. Of these, 68 were gazetted because of their potential to breach the ambient standard for PM10 particulates. The other airshed is at Marsden Point, Northland. It has the potential to breach the ambient standard for sulphur dioxide.
During the winter of 2006, air quality failed to meet the ambient standard for PM10 particulates at 28 airsheds. Most of these events occurred during winter temperature inversions.
National environmental standards for ambient air quality
In September 2005, five ambient standards for air quality came into effect. These are part of 14 national environmental standards introduced through the Resource Management (National Environmental Standards Relating to Certain Air Pollutants, Dioxins, and Other Toxics) Regulations 2004 (made under the Resource Management Act 1991).
The ambient standards set maximum thresholds for five commonly recognised, or key, air pollutants. These are PM10 particulates, nitrogen dioxide, carbon monoxide, sulphur dioxide, and ground-level ozone. Although the effects of air pollution on the natural environment are recognised, New Zealand’s ambient standards are measured primarily against human health thresholds.
Reporting on air quality
The Regulations require regional councils and unitary authorities to measure and publicly report on air quality whenever pollution in a gazetted airshed exceeds limits set by the ambient standards. Regional councils and unitary authorities have identified airsheds where PM10 particulates are known or suspected to be of concern. PM10 particulate levels in these airsheds are required to comply with the ambient standard for that pollutant by 2013.
In addition to ambient standards, the Regulations introduced other measures to improve air quality, including prohibition and design standards as discussed below.
Prohibition standards
Certain activities such as burning tyres, bitumen, coated wire, and oil in the open air have been prohibited. The standards also prohibited the use of incinerators at schools and health-care institutions unless authorised by resource consent, and prohibited the use of new high-temperature hazardous waste incinerators.
Design standard for wood burners
A design standard for new wood burners installed after September 2005 has been introduced to ensure the reduction of particulate emissions and provide better heat efficiency than that achieved by older wood burners. Although the wood burner standard limits emissions of particulates, it has the additional benefit of controlling emissions of other harmful pollutants such as carbon monoxide, volatile organic compounds (VOCs), hydrocarbons, and dioxins (see box ‘What are dioxins?’).
What are dioxins?
Dioxins are highly toxic compounds (known as persistent organochlorines) that build up in the fatty tissue of animals and humans. They are known to affect the immune, nervous, and reproductive systems, and have been linked to cancer. The World Health Organization has determined that no safe levels exist for exposure to dioxins.
Dioxins are formed as the result of chemical processes. Discharges of dioxins to the air mainly come from burning waste, fuel combustion, and industrial activities such as metal smelting.
Dioxins released into the air move with air currents but eventually settle on the land or water. Dioxins can enter the food chain when grazing animals or fish ingest them, and they are stored in their fatty tissue. Over 90 per cent of people’s exposure to dioxins in New Zealand is thought to come from their eating meat, fish, and dairy products.
Background levels of dioxins in New Zealand are generally low compared with levels in many northern hemisphere countries (Ministry for the Environment, 2001). Historically, activities such as the manufacture of 2,4,5-T (for example, in New Plymouth) and some timber-tanalising processes were significant sources of dioxin. However, dioxin levels have fallen over past decades as New Zealand has moved away from activities that generate dioxins (Ministry for the Environment, 2006b).
A study undertaken to determine the concentration of persistent organochlorine compounds (including dioxins) in the breast milk of New Zealand women showed that levels of these pollutants decreased by about 70 per cent between 1988 and 1998 (Bates et al, 2001).
In line with our international commitments under the 2001 Stockholm Convention, a series of measures have been taken to reduce the release of dioxins through the New Zealand Dioxin Action Plan agreed in 2002 (Ministry for the Environment, 2006b).
In addition, seven national environmental standards were introduced from 2004 to ban certain dioxin-producing activities, such as burning waste in school and hospital incinerators, burning tyres or coated wire in the open, and operating new high-temperature hazardous waste incinerators.
Limits set by the five ambient standards
The limits set by the ambient standards are summarised in Table 7.1.
Table 7.1: New Zealand’s national environmental standards for ambient air quality
| Pollutant | Concentration limit | Number of occasions concentration limit may be exceeded |
|---|---|---|
|
PM10 particulates |
50 µg/m3 (measured as a 24-hour average) |
One 24-hour period in a 12-month period. |
|
Nitrogen dioxide |
200 µg/m3 (measured as a 1-hour average) |
Nine hours in a 12-month period. |
|
Carbon monoxide |
10 mg/m3 (measured as a running 8-hour average) |
One 8-hour period in a 12-month period. |
|
Sulphur dioxide |
350 µg/m3 (measured as a 1-hour average)
570µg/m3 (measured as a 1-hour average) |
Nine hours in a 12-month period.
Not to be exceeded at any time. |
|
Ozone |
150 µg/m3 (measured as a 1-hour average) |
Not to be exceeded at any time. |
Note: µg/m3 = micrograms per cubic metre.
Source: Resource Management (National Environmental Standards Relating to Certain Air Pollutants, Dioxins, and Other Toxics) Regulations 2004.
The indicator discussed in this chapter measures air quality in terms of the number of exceedences, peak levels, and annual averages for each pollutant.
Exceedences are the number of times a pollutant fails to meet an ambient standard. Each ambient standard provides a permissible number of occasions in which the standard may be exceeded in any 12-month period. When more exceedences occur than are permitted by the Regulations, the air quality is described as breaching the standard. For example, the Te Kūiti airshed exceeded the ambient standard for PM10 particulates twice during 2005, constituting one breach of the ambient standard.
Peak levels indicate the severity of pollution events (that is, the maximum level) over a 12-month period, while exceedences indicate the frequency of pollution events over a reporting period. For example, the highest 24-hour concentration for PM10 particulates in the Te Kūiti airshed during 2005 was 54 micrograms per cubic metre.
Annual averages are the average concentration of the pollutant over a year. Annual averages are useful for trend analysis, because data is averaged over a year, so is less affected by unusual, or atypical, values. Annual averages can also indicate the long-term exposure of New Zealanders to pollutants. The ambient guidelines recommend an annual average concentration limit of 20 micrograms per cubic metre for PM10 particulates.
Pollutants measured by the national environmental indicator for air
PM10 particulates
PM10 particulates are airborne particles that are smaller than 10 microns in diameter (about a fifth of the thickness of a human hair). These particles are described as ‘thoracic’ because they are small enough to penetrate deeply into the human lung. They have a broad range of negative health effects on people’s respiratory and cardiovascular systems.
Particulates are produced by the combustion of wood (see Figure 7.2a) and fossil fuels (mostly by home heating and road traffic), as well as various industrial processes.
Secondary particulates also form through atmospheric reactions of sulphur dioxide, oxides of nitrogen, and certain organic compounds. Particulates do not come just from human sources. Natural sources such as dust, pollen (see Figure 7.2b), sea salt (see Figure 7.2c), and soil particles also contribute to PM10 particulate levels in the environment. Though the ambient standards set acceptable levels of PM10 particulates, there are no safe levels (that is, any level of PM10 particulates has some adverse effect on health).
Figure 7.2: Electron microscope images of particulates

Image: Source — Courtesy of Perry Davy.
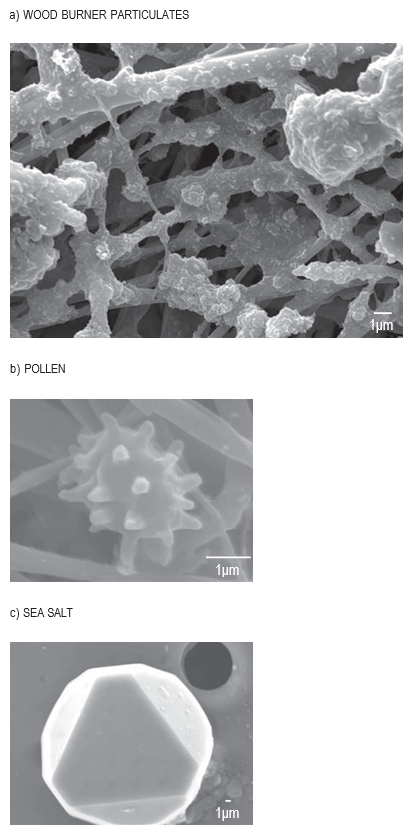
Image: Source — Courtesy of Perry Davy.
Nitrogen dioxide
Nitrogen dioxide results from the combustion of fossil fuels (coal, gas, and oil) and some industrial processes.
Nitrogen dioxide has been linked to increases in asthma symptoms and reduced lung development and function in children. Nitrogen dioxide can decrease the lungs’ defences against bacteria, making them more susceptible to infections.
Traffic tends to be the main source of nitrogen dioxide emissions in the urban environment, although industry is the main source of nitrogen dioxide emissions in several locations.
Carbon monoxide
Carbon monoxide is a product of the incomplete combustion of carbon-containing fuels such as wood, coal, petrol, and diesel.
Carbon monoxide is readily absorbed by the lungs and interferes with the blood’s ability to carry oxygen. The effects of carbon monoxide exposure increase in severity as exposure increases. Foetuses and people with heart disease are the most vulnerable to elevated carbon monoxide levels.
The main sources of carbon monoxide in most urban areas are traffic and home heating.
Sulphur dioxide
Sulphur dioxide is produced during the combustion of fuels containing sulphur, such as coal and diesel.
Sulphur dioxide is a respiratory system irritant and can restrict the airways of people suffering from asthma or chronic lung disease. The effects of sulphur dioxide are worse when a person is exercising, because they draw this highly reactive pollutant more deeply into the lungs. Sulphur dioxide has also been linked to cardiovascular disease.
In most parts of New Zealand the main source of sulphur dioxide is industry. Motor vehicles are the main contributor in areas with little industry. Diesel vehicles produce higher emissions than do petrol vehicles. In Wellington, the main source of sulphur dioxide is shipping.
Ozone
Ozone occurs naturally in the upper atmosphere, or stratosphere (see chapter 8, ‘Atmosphere’), where it screens out harmful ultraviolet radiation. However, at ground level, ozone affects the respiratory and cardiovascular system and can cause tissue damage to the lungs. Acute effects occur if a person is exercising in high levels of ozone.
Ground-level ozone is a secondary pollutant. It is not emitted directly but forms when volatile organic compounds (VOCs) react with oxides of nitrogen in the presence of sunlight.
Transport is a significant contributor of oxides of nitrogen and VOCs. Other sources of VOCs include home heating and some industrial processes.
Other pollutants not measured by the national environmental indicator for air
Air quality in New Zealand can be affected by pollutants that are not included as part of the national environmental indicator for air. In addition to the ambient standards, New Zealand has ambient air quality guidelines (ambient guidelines) that recommend health-based concentration limits for 15 pollutants. Table 7.2 summarises the limits set by the ambient guidelines for three pollutants that have reached elevated levels across New Zealand in the past.
Table 7.2: Ambient guidelines for other pollutants
| Pollutant | Recommended concentration limit |
|---|---|
|
PM2.5 |
25 µg/m3 ( measured as a 24-hour average) |
|
Benzene |
10 µg/m3 ( measured as an annual average reducing to 3.6 µg/m3 measured as an annual average from 2010) |
|
Lead |
0.2 µg/m3 ( measured as a three-month moving average) |
Notes: (1) µg/m3 = micrograms per cubic metre. (2) The PM2.5 concentration limit is not strictly a health-based guideline. It is recommended that levels above this limit are further investigated.
Source: Ministry for the Environment, 2002.
PM2.5 particulates
Particulate matter is composed of particles of varying sizes, but is often described as ‘coarse’ or ‘fine’.* PM10 particulates include particulates smaller than 10 microns in diameter, and encompass both coarse and fine components. PM2.5 particulates represent the fine component alone, being solely composed of particles smaller than 2.5 microns in diameter.
Several studies indicate that PM2.5 particulates are more directly linked to negative health effects than are PM10 particulates. PM2.5 particulates can penetrate further into the lungs than can PM10 particulates, and can reach the alveoli or gas-exchange region of the lungs.
Most PM2.5 particulates come from combustion sources. Most particulate matter from natural sources (such as sea salt and soil particles) is larger than 2.5 microns in diameter.
* Some publications describe PM10 particulates as ‘fine’ particulates. While PM10 particulates do have a fine particulate component, they also contain a coarse component. For this reason, PM10 particulates are not called ‘fine’ particulates in this report.
Benzene
The main sources of benzene in urban areas are transport and home heating. Benzene is emitted from the exhaust pipes of vehicles and through the evaporation of petrol. Other sources of benzene include oil refineries and petrochemical production.
Benzene is a known carcinogen that can negatively affect bone marrow, leading to anaemia and other complications.
Lead
Lead is a heavy metal that can be absorbed into the body through the lungs, stomach, and intestines. The absorption of lead can affect the development of foetuses and impair brain development in young children.
Exhaust-pipe emissions from petrol vehicles used to be a significant source of airborne lead when petrol contained lead additives to boost the octane rating. However, reductions of the lead levels in petrol in New Zealand began in 1986, culminating in the complete removal of lead additives in 1996.
Airborne lead emissions can also come from industrial activities such as metal smelting.
Limitations of the indicator
The four key limitations are listed below.
Number and type of pollutants covered
The indicator covers only the five key ambient air pollutants of national significance. In addition, it does not include indoor air pollution.
Health impacts of air quality
The indicator is set up to track air quality against limits for protecting people’s health. However, it is not able to show the health effects of air quality on people.
Furthermore, the indicator does not show synergistic effects from exposure to two or more pollutants in the environment. This is relevant because combustion processes give rise to several pollutants simultaneously.
Variations in weather and climate
The indicator reports on the state of air quality over time, but does not allow for the influence of variations in weather and climate from year to year. This makes it difficult to assess whether changes in air quality are caused by changing environmental pressures (reduction in the emission of pollutants) or meteorological variations.
Main centres of population
Before the introduction of the ambient standards in 2005, many locations had little or no nationally comparable monitoring that provided data for long-term trends of air quality. As a result, and given that the air indicator is concerned with human exposure to pollution, this chapter focuses on the following five major centres of population for which longer data sets are available: Auckland, Hamilton, Wellington, Christchurch, and Dunedin.
This section covers the state and trends of the following five key air pollutants:
- PM10 particulates
- nitrogen dioxide
- carbon monoxide
- sulphur dioxide
- ozone.
In addition to these five key air pollutants, this section also looks at PM2.5 particulates, benzene, and lead.
PM10 particulates
State of PM10 particulates in gazetted airsheds during 2005
This section provides an overview of the state of PM10 particulates across New Zealand.
As most of New Zealand is expected to have good air quality, only 1.5 per cent of New Zealand’s total land area has been gazetted as airsheds to date. However, about 65 per cent of New Zealanders live in a gazetted airshed as a result of New Zealand having a highly urbanised population (see chapter 2, ‘Our environment and people’). Furthermore, about 53 per cent of New Zealanders live in a gazetted airshed that has breached the PM10 particulate ambient standard.
Elevated PM10 particulate levels
About 30 locations in New Zealand experience periods of poor air quality* each year resulting from elevated levels of PM10 particulates. Elevated PM10 particulate levels are not restricted to large centres of population (see photo below). Even very small communities can experience poor air quality during winter, where domestic coal and wood burning is prevalent and conditions prevent adequate dispersion of pollutants. Auckland is particularly affected by emissions from road traffic as well as by emissions from home heating in the winter.
* For the purposes of this report, where air quality breaches ambient standards, or exceeds ambient guidelines, air quality is described as ‘poor’.
Image: Courtesy of Greater Wellington Regional Council.
Poor air quality in winter
Air pollution episodes during winter in Christchurch are generally well known. However, smaller settlements around the country such as Alexandra, Tīmaru, Nelson, and Richmond also experience poor winter air quality from elevated PM10 particulate levels. Reefton, with a population of about 990, is New Zealand’s smallest gazetted airshed that experiences high winter PM10 particulate levels.
Exceedences in monitored airsheds during 2005
Figure 7.3 shows the frequency and extent of exceedences of PM10 particulates in monitored airsheds during 2005 (that is, the number of times levels of PM10 particulates were higher than the level allowed by the ambient standard and the highest 24-hour concentration experienced).
During 2005, several airsheds, including Nelson, Tīmaru, Alexandra, and Christchurch, experienced a large number of exceedences of the ambient standard for PM10 particulates.
The greatest number of exceedences (51) was experienced in the Nelson South airshed. Although Nelson South exceeded the ambient standard most frequently, monitoring in other airsheds recorded higher 24-hour concentrations. The highest 24-hour concentration in the Nelson South airshed for 2005 was 96 micrograms per cubic metre, compared with 198 micrograms per cubic metre and 154 micrograms per cubic metre in the Invercargill and Christchurch airsheds respectively.
The ambient standard for PM10 permits one annual PM10 particulate exceedence in 12 months. Therefore, the ambient standard was not breached in Dunedin, Taupō, and the Wairarapa for 2005 (each of which had one exceedence in 2005). The ambient standard was also not breached in the locations in Figure 7.3 for which no exceedences are shown.
The majority of the exceedences shown in Figure 7.3 are limited to the winter months, with PM10 particulate levels usually meeting the ambient standard for the rest of the year. This pattern is demonstrated for Christchurch in Figure 7.4.
Figure 7.3: Highest 24-hour concentrations and extent of exceedences of PM10 particulates in monitored airsheds, 2005
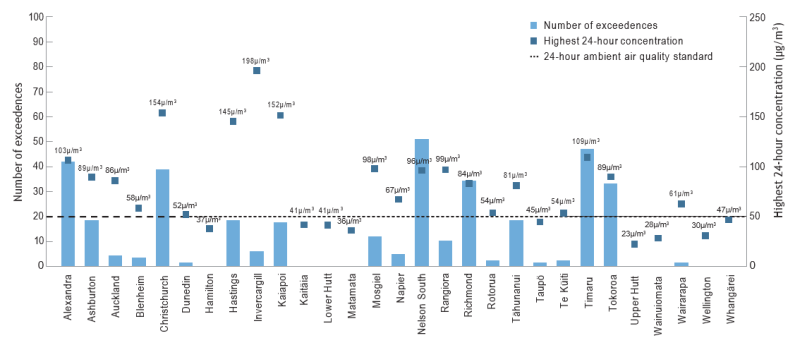
Image: Source — Ministry for the Environment.

Image: Source — Ministry for the Environment.
Figure 7.4: PM10 particulate levels in Burnside, Christchurch, 2005
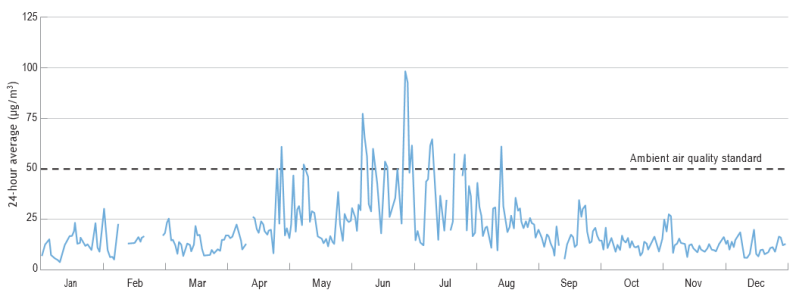
Image: Source — Ministry for the Environment, 2006a.

Image: Source — Ministry for the Environment, 2006a.
State of PM10 particulates outside gazetted airsheds
Areas outside gazetted airsheds are sparsely populated, and, as a result, little PM10 particulate monitoring occurs in the rural environment and areas free from emissions caused by human activity. However, data collected outside of the airsheds does confirm that New Zealand is expected to have good air quality in most locations.
The National Institute of Water and Atmospheric Research (NIWA) measures aerosol optical depth (AOD) in Lauder, Central Ōtago. AOD is a measure of the clarity, or visibility, of the air, and is affected by the amount of particles and light-absorbing gases in the air. Measurements of AOD at Lauder are among the lowest observed in the world (up to 10 times lower than at sites in the northern hemisphere that are considered clean), and are often similar to measurements in Antarctica and Hawaii, indicating that New Zealand has comparatively excellent air quality by world standards.
More about health effects of pollution – the Health and Air Pollution in New Zealand study
The 2007 Health and Air Pollution in New Zealand study identifies and quantifies the human health risks of exposure to air pollution, based on results from 67 urban areas. The study confirms the findings of a study in 2002 that estimated the number of New Zealanders dying prematurely because of traffic-related air pollution was similar to the number of people dying from road traffic accidents (Fisher et al, 2007).
The 2007 study also found the following:
- Each year, about 1,100 people die prematurely from exposure to urban air pollution.
- The total economic cost of air pollution in New Zealand is estimated to be $1.14 billion each year. This figure equates to $421 for each person.
- People whose health is most affected by air pollution are:
- older people, particularly those over 65 years
- infants, particularly those under 1 year
- people with asthma and other respiratory problems
- people with other chronic diseases, such as heart disease.
Other less obvious effects from air pollution include restricted activity days (for example, days off work from illness) that occur during periods of poor air quality.
Recent trends in PM10 particulate levels in the main centres
Total suspended particulate levels
The earliest data for particulate matter dates back to monitoring established in Auckland in 1964 to measure total suspended particulate (TSP) levels. TSP encompasses a wide range of particle sizes, and includes any particles with a diameter up to 50 microns. This measurement has been superseded by PM10 particulate monitoring, which focuses on the more specific size range of particles associated with negative health effects.
Figure 7.5 shows a significant decrease in TSP levels over the past 40 years. Though the amount of particulates released into the air has fallen over this period, it is not known what proportion of the TSP was made up of PM10 particulates. This factor makes it difficult to quantify the extent to which PM10 particulate levels have fallen over the 40-year period, although some correlation would be expected.
Figure 7.5: Annual total suspended particulate levels in Auckland, 1964–2005
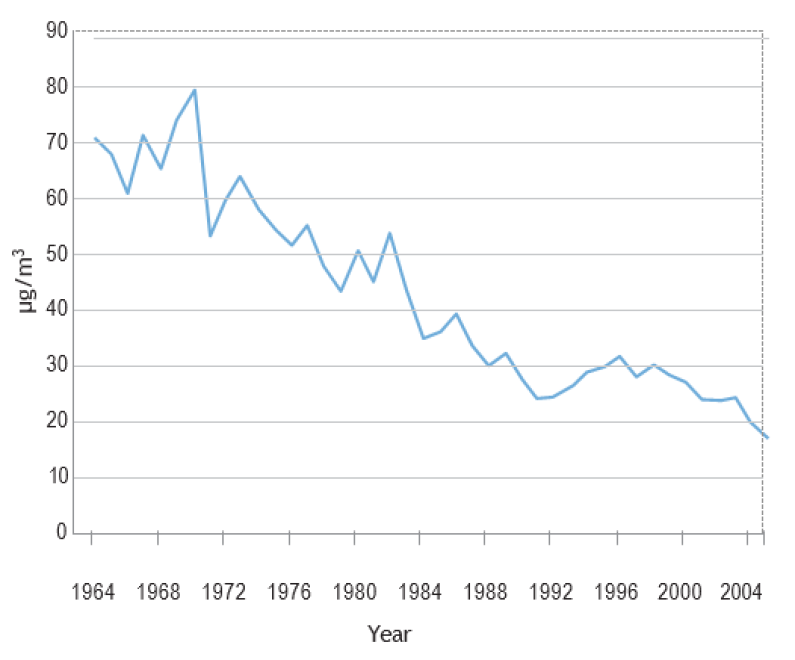
Image: Source — Auckland Regional Council, 2006a.

Image: Source — Auckland Regional Council, 2006a.
Poor air quality in the Auckland airshed
Monitoring of PM10 particulates at 12 sites in the Auckland airshed indicates that the region experiences incidences of poor air quality, including at the residential site, Takapuna (see Figure 7.6). Levels at other residential sites in Auckland show similar or slightly lower levels of PM10 particulates.
Monitoring of PM10 particulates at busy transport corridors in Auckland shows higher levels than in residential areas, though annual average levels at two roadside sites appear to be improving. However, this trend may have been influenced by reduced traffic flows resulting from nearby road improvements, rather than representing an overall improvement in the region.
High peak levels of PM10 particulates in Christchurch
Of the five main centres of population, Christchurch experiences some of the highest peak levels of PM10 particulates, mostly during winter temperature inversions. Monitoring at the residential site, St Albans, shows incidences of poor air quality each year, with more than 50 exceedences recorded in 1999 and 2001 (see Figure 7.6). The topography of the Canterbury Plains is particularly vulnerable to temperature inversions, so several other airsheds in the region have similar incidences of poor air quality during the winter.
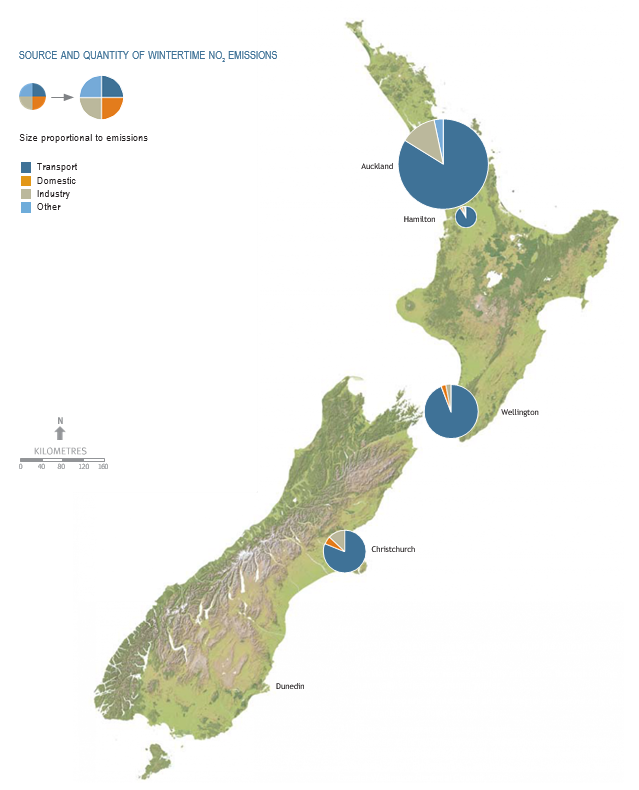
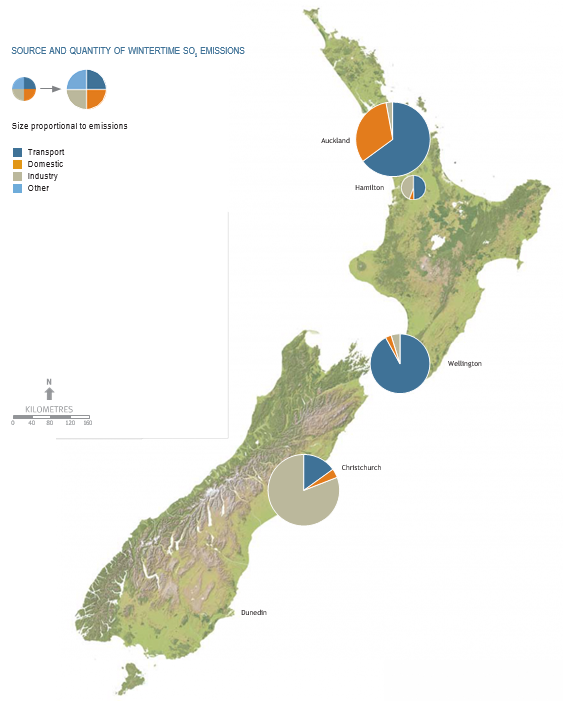
Figure 7.6: PM10 particulate levels and emissions in main centres of population

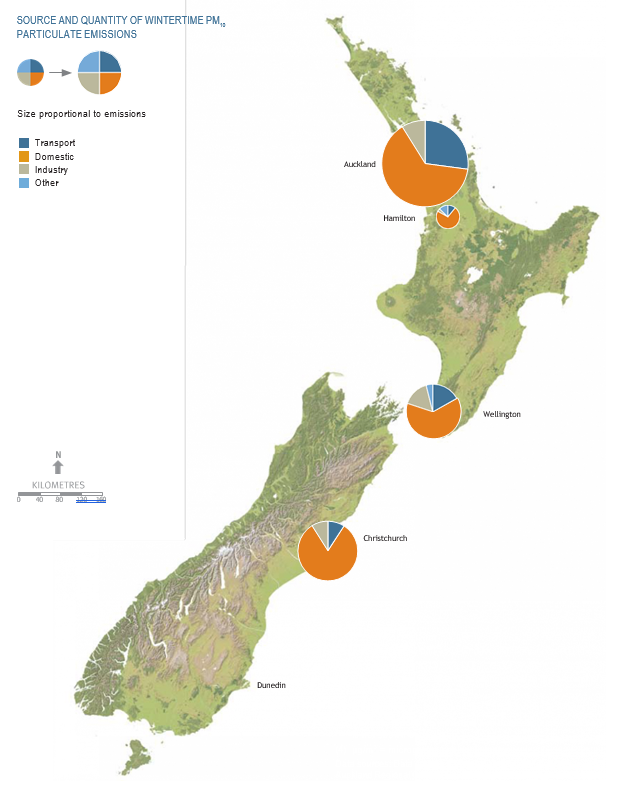
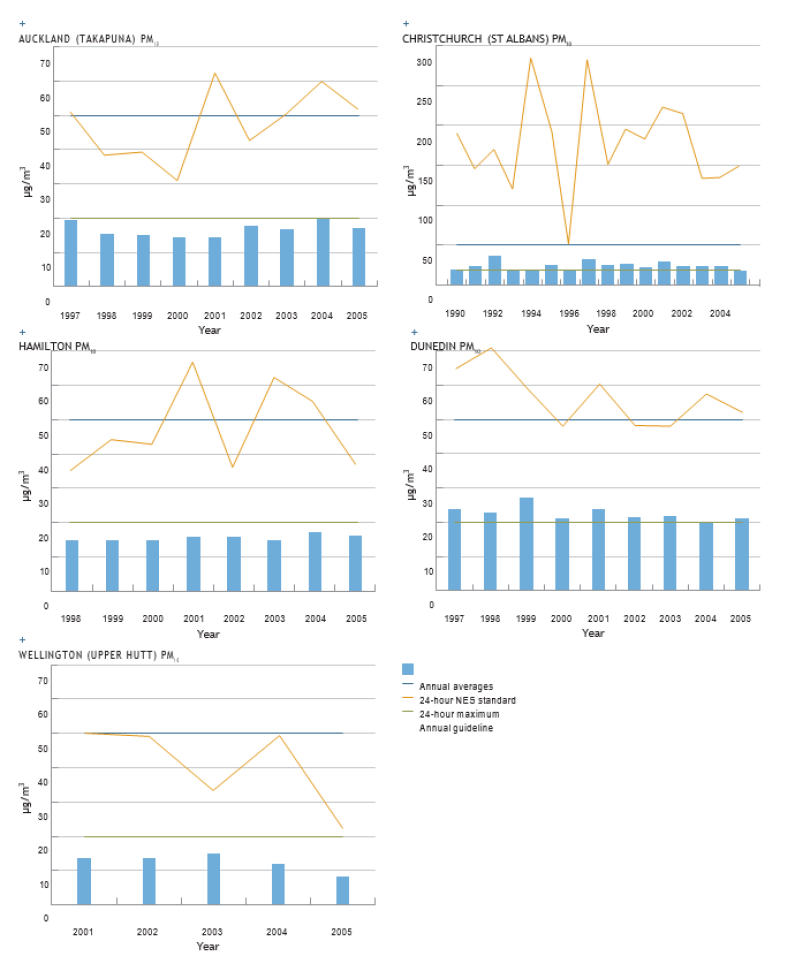

Notes: (1) The size of the pie graphs is proportional to the amount of emissions in each location represented. (2) A different scale is used on the Christchurch (St Albans) graph. (3) Dunedin reports on industrial and domestic emissions only and therefore is not shown on the map. (4) μg/m3 = micrograms per cubic metre.
Winter exceedences of PM10 particulates in Hamilton and Dunedin
Hamilton and Dunedin experience exceedences of the ambient standard for PM10 particulates during the winter. Residential monitoring sites in Hamilton and Dunedin have experienced poor air quality in recent years (see Figure 7.6). Note that the Dunedin data is based on monitoring equipment that is unable to monitor on a daily basis. Continuous monitoring equipment has recently been installed that will provide a better picture of annual PM10 particulate levels than was previously possible.
No exceedences recorded in Wellington
No long-term data on air quality in residential areas is available for central Wellington. However, monitoring at busy roadside locations around Wellington indicates no exceedences of the ambient standard to date.
Monitoring of PM10 particulates in residential areas is carried out in other parts of the Wellington region, such as Upper Hutt (see Figure 7.6). Though potentially susceptible to wintertime pollution episodes, this site has had no exceedences of the ambient air quality standard recorded.
Sources of PM10 particulates
Emissions vary depending on the time of year
The quantity and main sources of PM10 particulate emissions caused by human activity change seasonally, depending on the type of activities at different times of the year. Winter emissions have the greatest effect on air quality because this time of year tends to be when emissions are highest. For example, Auckland produces an estimated 29 tonnes of PM10 particulates each day during the winter, with 64 per cent of emissions coming from home heating sources. In the summer, this level falls to an estimated 10 tonnes each day, with most emissions coming from the transport sector.
Home heating is a main source of PM10 particulates in winter
Home heating is the biggest source of PM10 particulates during winter in all five main centres of population. In metropolitan Christchurch and Dunedin a particularly high proportion of winter PM10 particulates come from home heating.
Local action on home heating
Regional councils and territorial authorities undertake a wide range of programmes in their communities to reduce the effects of air pollution caused by home heating emissions. Below are examples of local initiatives that contribute to national improvements in air quality.
Environment Canterbury Clean Heat project
Environment Canterbury’s Clean Heat project offers householders a free energy audit of their homes. The project also provides assistance to low-income homeowners to replace open fires and burners with cleaner heating options and to upgrade housing insulation.
Nelson City Council Clean Heat Warm Homes programme
The Nelson City Council Clean Heat Warm Homes programme is modelled on Environment Canterbury’s Clean Heat project and has operated since 2003.
Nelson City Council and Tasman District Council Good Wood scheme
Firewood retailers are encouraged to become ‘Good Wood’ suppliers who agree to supply dry wood (or wood that will be dry for the following winter). Suppliers must have moisture meters to confirm the moisture content of the wood supplied. Retailers who agree to the code can use the Good Wood logo. Regular marketing and promotion of Good Wood suppliers is carried out by the Nelson City Council and Tasman District Council.
Nelson City Council Smoke Patrol
Nelson City Council has a dedicated smoke patrol officer. The officer’s role is to identify excessively smoky domestic fires and offer the householder advice on ways to reduce smoke, information about Good Wood, and financial assistance to upgrade old burners and improve insulation.
Method of home heating affects PM10 particulates
Although home heating is the main source of winter PM10 particulates in Hamilton, emissions are lower than for many other urban areas in the region. A large proportion of Hamilton households (64 per cent) use gas to heat their main living areas, and only 1 per cent of households burn coal (Environment Waikato, 2006b). (Particulate emissions from gas appliances are negligible.)
Figure 7.7 shows typical PM10 particulate emissions from different types of home heating appliances. Both Auckland and Christchurch have reported lower PM10 particulate emissions in recent years. Over the same period, homeowners have changed to methods of home heating that produce less pollution.
Total home heating emissions in metropolitan Christchurch decreased by 15 per cent between 1999 and 2002 (despite an increase in the number of households). This decrease in emissions coincided with a regional decrease in the use of open fires, coal, and wood and an increase in the use of electricity, oil, and gas (Environment Canterbury, 2004).
More about emissions from home heating appliances
Figure 7.7 shows the emissions of PM10 particulates from different types of heating appliance. Open coal fires have the highest emissions and are the least thermally efficient. Emissions from wood burners vary because older appliances were designed to less stringent standards than the current national environmental standard wood burner design standard (1.5 grams of PM10 particulates per kilogram of wood burnt). Real-life emissions (as distinct from the laboratory tests on which the design standard is based) from solid fuel burners vary considerably, depending on the quality of fuel used and how the appliance is operated and maintained.
Figure 7.7: PM10 particulate emissions from different types of home heating appliances

Image: Source — Ministry for the Environment, 2005.
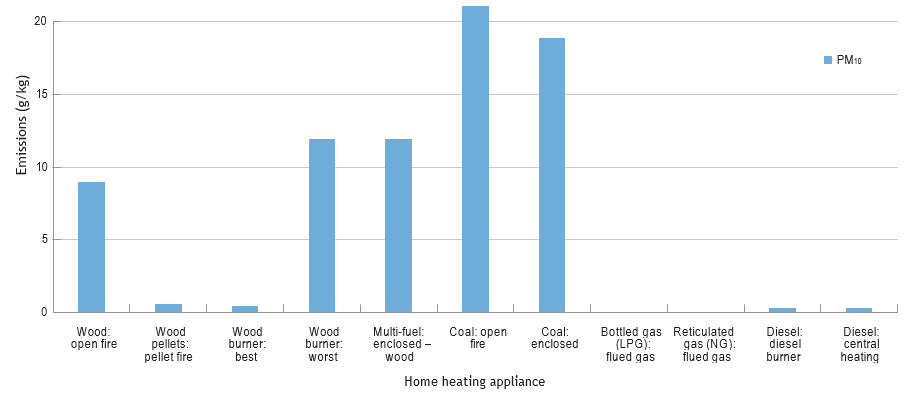
Image: Source — Ministry for the Environment, 2005.
Road traffic emissions as a source of PM10 particulates
Road traffic is another significant source of PM10 particulates, and is the main source of PM10 particulate emissions in Auckland over an entire year. About 73 per cent of PM10 particulate emissions from motor vehicles come from diesel exhaust alone (Auckland Regional Council, 2006b). The use of diesel fuel is expected to increase, particularly in commercial vehicles (Ministry of Economic Development, 2006).
Contribution to emissions from diesel vehicles
Badly tuned vehicles contribute a significant amount of air pollution. It is estimated that 10 per cent of all vehicles produce about 40 per cent of total vehicle emissions (Ministry of Transport, 2007). Emissions are made worse when an engine is poorly tuned. A diesel engine can continue running in a more neglected state than can a petrol engine.
Both diesel and petrol contain small amounts of sulphur that is not removed during the refining process. Sulphur in diesel leads to the formation of sulphate particulates. Reducing the sulphur content of diesel reduces emissions of PM10 particulates and ensures fuel is suitable for the introduction of newer-technology vehicles that produce lower emissions.
Local action on traffic pollution
The following initiatives are examples of actions regional councils and territorial authorities can take to reduce air pollution caused by traffic emissions.
Auckland Regional Council 0800 Smokey campaign
In August 2000, Auckland Regional Council began a public education campaign designed to raise awareness of Auckland’s air pollution problems from motor vehicles, and to get Aucklanders to take action. The aims of the 0800 Smokey campaign were to:
- raise awareness that motor vehicle emissions cause more than 80 per cent of the air pollution in Auckland and that owners should tune their vehicles to reduce the impact of motor vehicle emissions
- promote the 0800 SMOKEY hotline and website through which people could report smoky vehicles
- raise the profile of air quality in the region to influence national policies on fuel quality and vehicle importation.
Free exhaust emission checks were offered to vehicle owners.
Over a 15-week period, 20,000 people reported 23,000 different vehicles. One vehicle was reported 67 times.
Auckland Regional Council Bus Emissions Reduction project
In July 2003, Auckland Regional Council funded the collaborative Bus Emissions Reduction project to identify and trial initiatives for reducing emissions from buses and heavy vehicles. Key outcomes include:
- developing a bus emissions prediction model to evaluate the environmental performance of different fleet options
- undertaking emissions testing to identify buses for targeted maintenance
- trialling retrofitting of diesel oxidation catalysts as a cost-effective means of reducing emissions from older buses
- participating in a joint biodiesel trial with other stakeholders to identify potential air quality benefits.
Nitrogen dioxide
Recent trends in nitrogen dioxide levels in the main centres
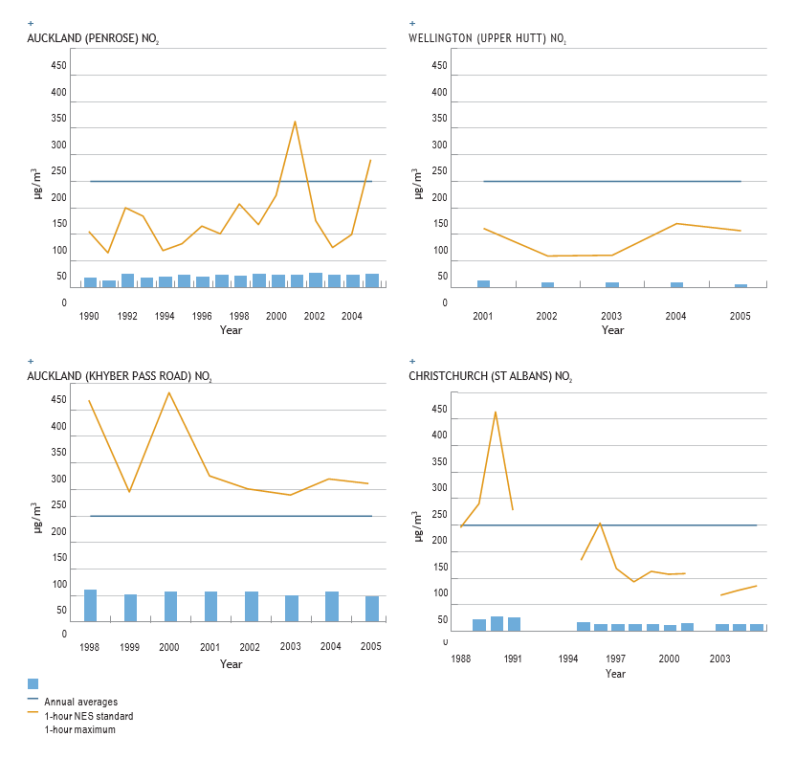
Sites close to major roads or industrial sources are the most likely locations to be affected by elevated levels of nitrogen dioxide. The roadside Khyber Pass Road site in Auckland (see Figure 7.8) is located alongside a heavily congested road, carrying more than 27,000 vehicles each day. This site experiences periods of poor air quality each year. In 2001, the site experienced an unusually high number of exceedences (53 exceedences over 23 days), illustrating the effect that atmospheric conditions can have on pollution levels in different years.
Monitoring at two recently commissioned roadside sites in Wellington reports higher levels of nitrogen dioxide than in residential areas, but nevertheless indicates good air quality.
Levels of nitrogen dioxide in residential areas of Christchurch and Wellington also indicate good air quality (see Figure 7.8). Though the Christchurch site has experienced poor air quality in the past, nitrogen dioxide levels have been good over the past 10 years.
Figure 7.8 also shows nitrogen dioxide levels at the industrial Penrose site in Auckland. This site is fringed with residential properties that are likely to experience higher levels of nitrogen dioxide than are other Auckland residential monitoring sites. The industrial Penrose site has not exceeded the ambient standard more than the nine times permitted by the standard. However, this site has experienced exceedences of the ambient standard for nitrogen dioxide during some years.
No long-term, continuous nitrogen dioxide monitoring occurs in Hamilton or Dunedin. Monitoring surveys conducted in Hamilton during 1998 and 1999 indicate that nitrogen dioxide levels were low. Monitoring methods used in Dunedin differ from methods used at sites in Figure 7.8, so results from Dunedin cannot be assessed in the same way as the result of other main centres.
Sources of oxides of nitrogen
Most emissions are not emitted as nitrogen dioxide but mainly in the form of nitric oxide. Once released to the atmosphere, nitric oxide can be further oxidised to form harmful nitrogen dioxide. Estimates of emissions are for this reason always expressed as oxides of nitrogen.
Transport is the main source of oxides of nitrogen in all main centres of population, accounting for about 80–90 per cent of emissions. It is interesting to note that a significant proportion of oxides of nitrogen emissions in Wellington come from shipping.
In Auckland, estimates of oxides of nitrogen emissions have increased slightly since 1998. This is attributed to an increase in the number of diesel vehicles in the region (Auckland Regional Council, 2006b). Diesel vehicles produce higher oxides of nitrogen emissions than an equivalent petrol engine. At a national level, the number of diesel vehicles on the roads has increased by 39 per cent between 2001 and 2006 (see chapter 4, ‘Transport’).
In contrast, estimates of oxides of nitrogen emissions from motor vehicles in Christchurch have decreased by 5 per cent, despite a 12 per cent increase in the number of vehicle kilometres travelled. This is thought to be the result of an increase in the number of vehicles with emission control equipment in the region (Environment Canterbury, 2004).
Recent emission estimates for Dunedin do not include motor vehicle emissions.
Figure 7.8: Nitrogen dioxide (NO2) levels and emissions in main centres of population


Carbon monoxide
Recent trends in carbon monoxide levels in the main centres
Results of monitoring at Auckland and Christchurch sites
Levels of carbon monoxide at the Auckland and Christchurch monitoring sites appear to have fallen over the past 10 years (see Figure 7.10). This trend has been particularly noticeable at Auckland’s roadside Khyber Pass Road site, which is strongly affected by traffic emissions. The site experienced a large number of exceedences of the ambient standard for carbon monoxide in the second half of the 1990s (including 190 exceedences over 47 days in 1997), but has experienced no exceedences since 1999.
Carbon monoxide levels measured in a residential area of Christchurch have also noticeably reduced. No data is available for roadside sites in Christchurch.
Results of monitoring at Hamilton and Wellington sites
Carbon monoxide levels in Hamilton and Wellington remain below the ambient standard. Monitoring was established in central Wellington in 2004 to assess the influence of transport emissions in a heavily trafficked area. Although levels are higher than those of the Lower Hutt site, levels of carbon monoxide at the central Wellington site remain well below the limit set by the ambient standard.
Dunedin screening surveys
No permanent monitoring has been established in Dunedin, but screening surveys suggest that carbon monoxide levels in Dunedin meet the ambient standard.
Sources of carbon monoxide emissions
Transport as a source of carbon monoxide emissions
Transport is the main source of carbon monoxide in New Zealand. Emissions estimates indicate that transport contributes 85 per cent of annual carbon monoxide emissions in Auckland and 51 per cent of winter emissions in metropolitan Christchurch.
Carbon monoxide emissions in both Auckland and Christchurch have fallen in recent years despite increasing numbers of vehicles and vehicle kilometres travelled. Although private vehicles and congestion increased in metropolitan Christchurch between 1999 and 2001, emissions estimates indicate that carbon monoxide from motor vehicles fell by 15 per cent (Environment Canterbury, 2004). The fall in carbon monoxide emissions is thought to result from the increasing numbers of vehicles with emission control equipment.
Home heating as a source of carbon monoxide emissions
Changes in home heating also influence emissions of carbon monoxide. In Christchurch, 48 per cent of carbon monoxide emissions are estimated to come from home heating. Between 1999 and 2002 domestic emissions of carbon monoxide decreased by 13 per cent. This decrease was due to increased use of gas and electricity and a decrease in coal and wood burning, although wood remains a popular fuel choice in Christchurch (Environment Canterbury, 2004).
Sulphur dioxide
Recent trends in sulphur dioxide levels in the main centres
Figure 7.9 shows a steady fall in sulphur dioxide levels during the 1970s and 1980s as a result of the declining use of coal and heavy fuel oils in Auckland. Monitoring at other locations around New Zealand indicated a similar improvement in levels and was gradually discontinued. In the mid-1990s, sulphur dioxide levels in Auckland increased again, coinciding with an increase in the registration of new and imported diesel vehicles (particularly heavy goods vehicles).
Figure 7.9: Annual sulphur dioxide (SO2) levels at Penrose, Auckland, 1975–2000
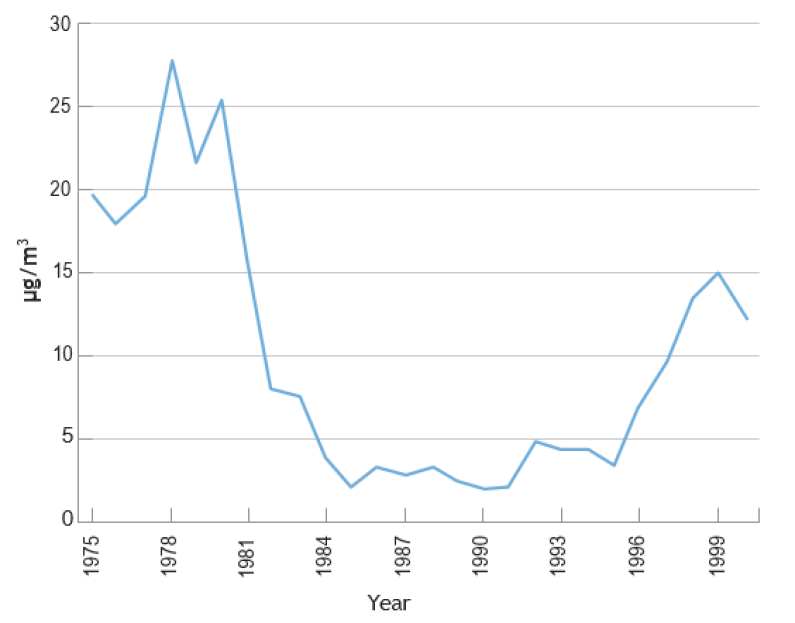
Image: Data source — Auckland Regional Council, 2006a.
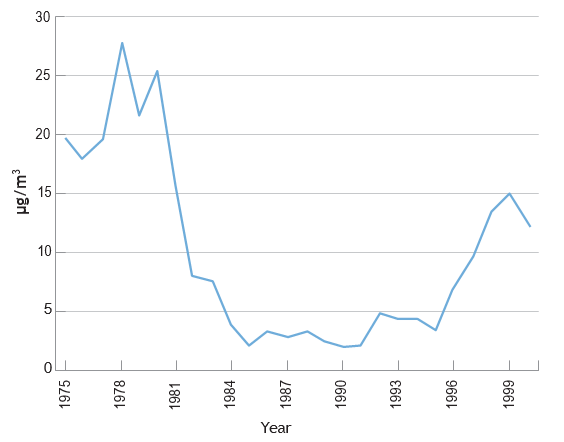
Image: Data source — Auckland Regional Council, 2006a.
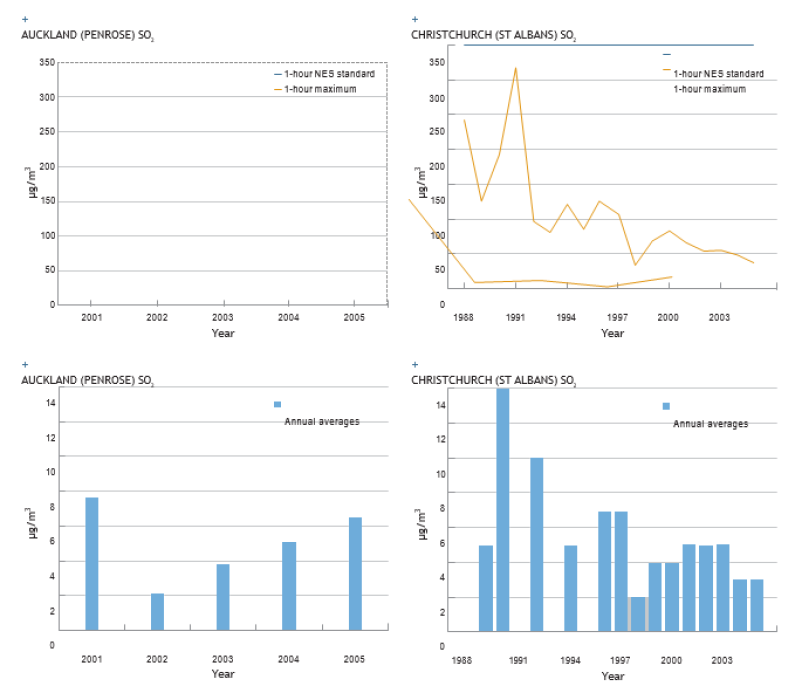
In recent years, improved monitoring methods have shown that the Penrose site in Auckland has had good air quality with respect to the ambient standard for sulphur dioxide (see Figure 7.11). The fall in sulphur dioxide levels at this site between 2001 and 2002 coincides with a significant reduction in the sulphur content of diesel fuel in the Auckland region. However, since 2002 the annual average has increased each year.
Levels at the residential Christchurch site (see Figure 7.11) have fallen since the early 1990s and indicate that levels of sulphur dioxide are not of concern. However, other monitoring sites in the Canterbury region near industrial sources (such as Woolston and Hornby) have occasionally recorded high levels of sulphur dioxide.
Levels of sulphur dioxide in Hamilton, Wellington, and Dunedin are generally considered to be low and are not monitored.
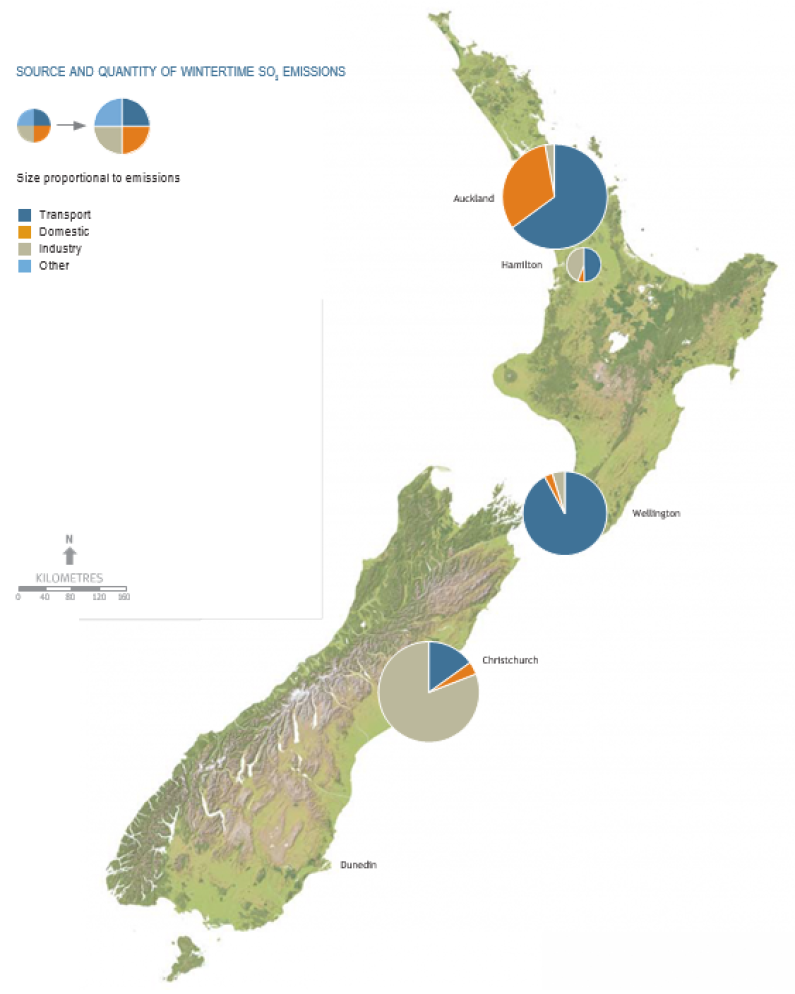
Sources of sulphur dioxide
The main sources of sulphur dioxide vary across the country. In Auckland, the main source is transport emissions. In Christchurch, 80 per cent of daily wintertime emissions of oxides of sulphur come from industrial sources such as coal-fired boilers, and, to a lesser degree, diesel boilers. Vehicle emissions of sulphur dioxide in Christchurch are increasing and have been attributed to an increased number of diesel vehicles on the road (Environment Canterbury, 2004).
Figure 7.11 shows that 92 per cent of winter sulphur dioxide emissions in the Wellington region are from transport. Emissions inventories estimate that 93 per cent of these emissions come from commercial shipping (Air and Environmental Services Ltd, 2001). Motor vehicles are the largest source of winter sulphur dioxide in Hamilton (49 per cent), closely followed by industry (44 per cent) (Environment Waikato, 2006b). In contrast, the main source in Dunedin is industry (85 per cent), followed by home heating (15 per cent) (Otago Regional Council, 2005a). No data is available for transport in Dunedin.
Global air quality guidelines for sulphur dioxide
New Zealand’s ambient standards and guidelines have been consistent with World Health Organization (WHO) recommendations. In the light of recent health research, WHO published its first global air quality guidelines in October 2006, recommending concentration limits for key pollutants. WHO’s new guidelines reduce the 24-hour average sulphur dioxide guideline from 120 micrograms per cubic metre to 20 micrograms per cubic metre. New Zealand’s ambient guideline is set at 120 micrograms per cubic metre. Most of New Zealand is likely to meet the new WHO guideline. However, some areas, particularly those downwind of refineries and coal-burning industrial plants, may exceed the guideline over a 24-hour period.
Figure 7.10: Carbon monoxide (CO) levels and emissions in main centres of population
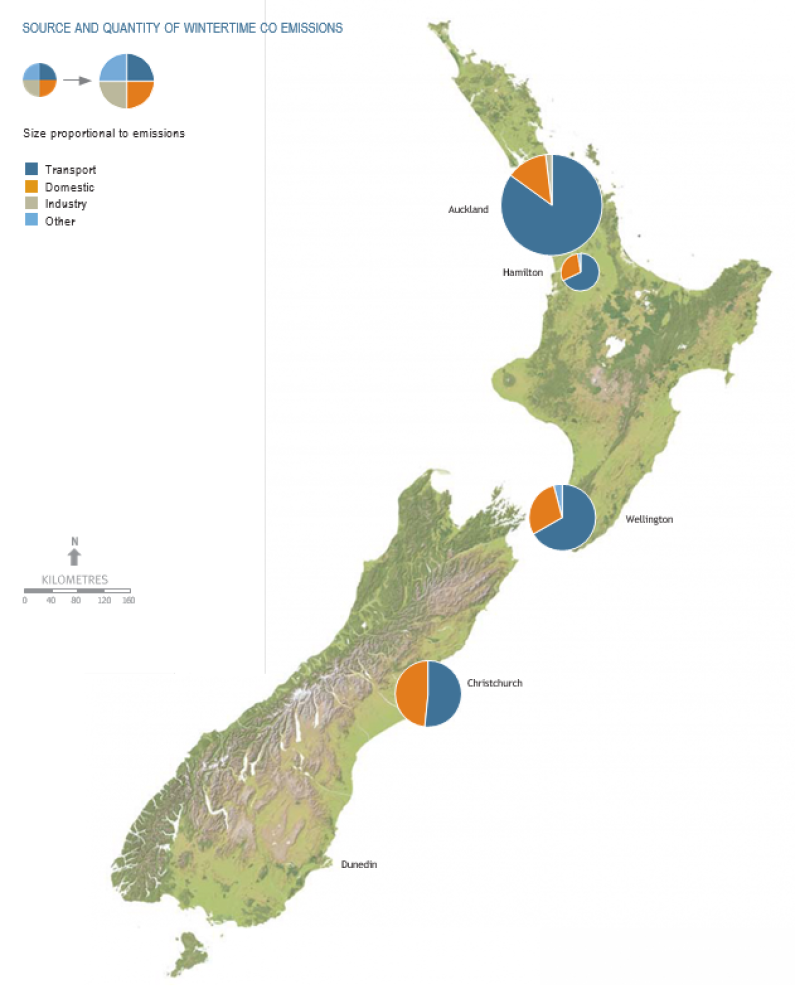

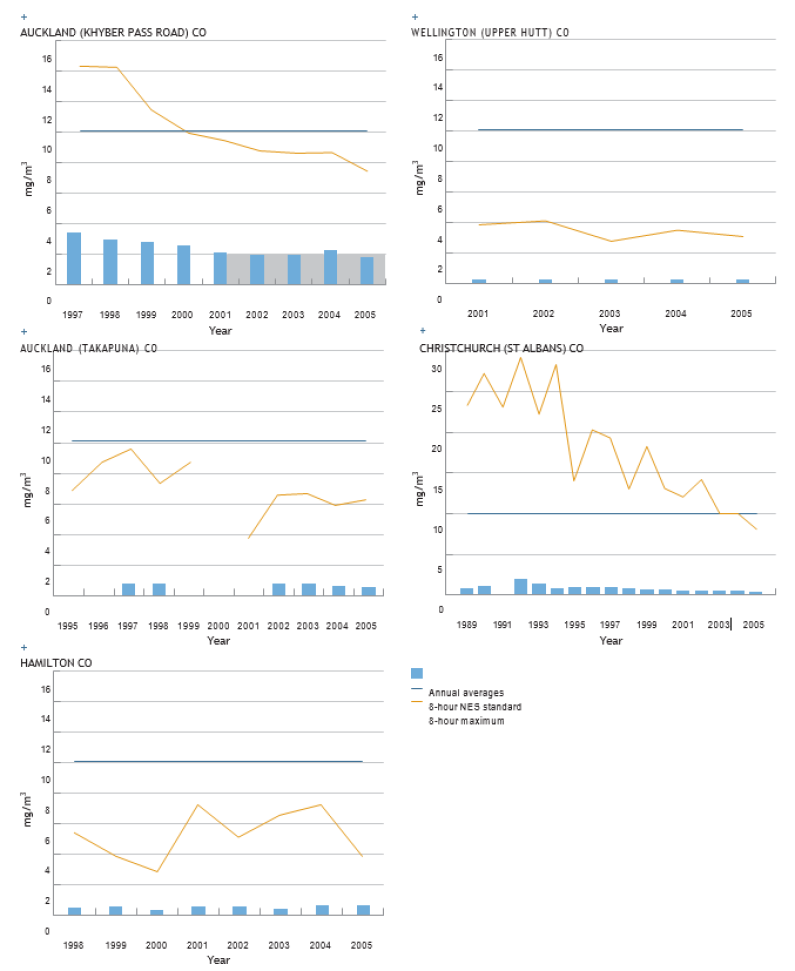
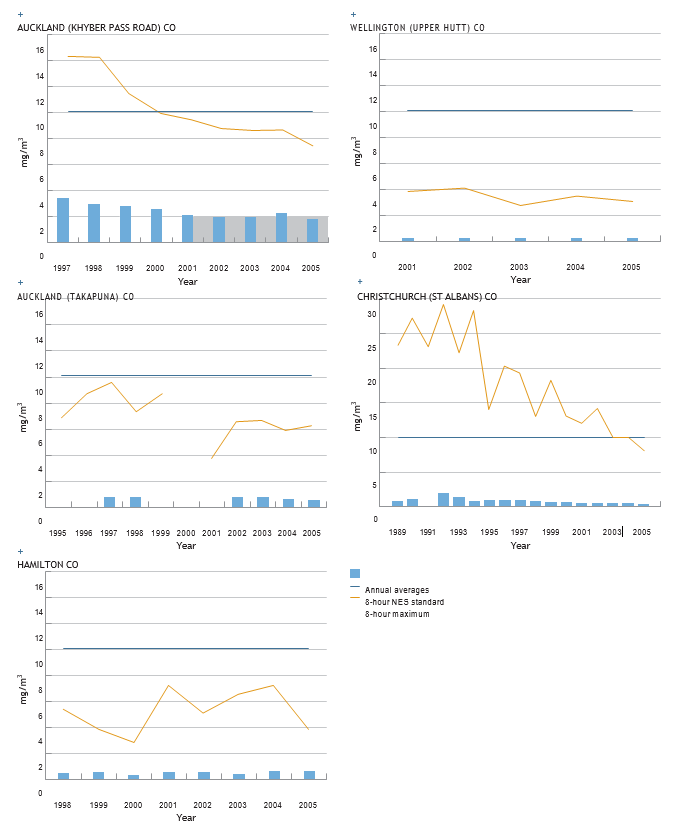
Figure 7.11: Sulphur dioxide (SO2) levels and emissions in main centres of population

Ozone
Recent trends in ozone levels in the main centres
Auckland, Christchurch, and Hamilton have been identified as having the highest potential for ozone pollution (photochemical smog) during the summer (National Institute of Water and Atmospheric Research, 1996). Ozone is a secondary pollutant that requires precursor pollutants and its formation is a slow and complex process. Consequently, the highest levels tend to be found some tens of kilometres downwind of the sources of precursor pollutants.
Auckland has four ozone monitoring sites including Musick Point. No exceedances of the ambient standard for ozone have occurred during the course of the monitoring. The Musick Point monitoring site did, however, exceed the ambient guideline twice in 2002.
Ozone is not monitored in metropolitan Christchurch. Instead, it is measured in Lincoln, 20 kilometres south west of Christchurch, where levels are expected to be highest. Monitoring for ozone during the summers of 1998 and 2003 indicated no exceedances of the ambient standard.
A short screening survey carried out in Hamilton during the 2003 summer indicated that ozone levels were considerably below the ambient standard.
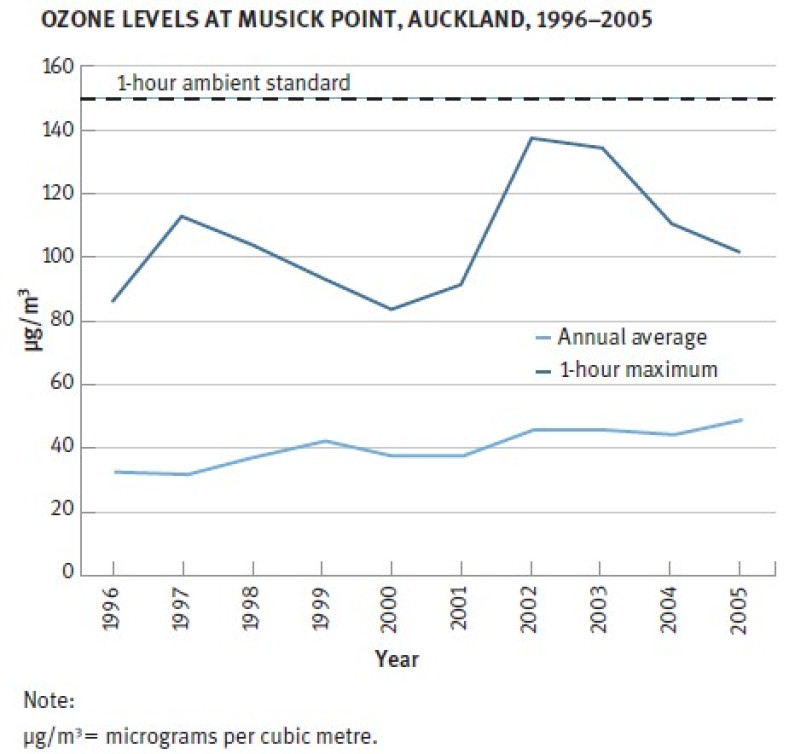
Image: Data source: Auckland Regional Council, 2006a.
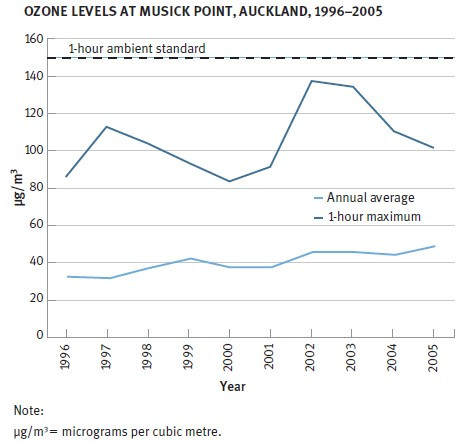
Image: Data source: Auckland Regional Council, 2006a.
Sources of ozone precursors
In Auckland and Hamilton, the main source of ozone precursors (oxides of nitrogen and volatile organic compounds) is traffic. In Christchurch, the main source of ozone precursors is traffic, but 60 per cent of the volatile organic compounds come from home heating (Ministry for the Environment, 2003).
PM2.5 particulates
Monitoring indicates that the relationship between PM2.5 and PM10 particulate levels can vary during the year. For example, monitoring in Christchurch indicates that the levels of PM10 and PM2.5 particulates are similar in winter, but less so in summer. During summer, a larger proportion of the PM10 particulates come from natural sources such as sea salt and soil particles, which are largely absent in PM2.5 particulates. During winter, both PM10 and PM2.5 particulates in Christchurch come mainly from combustion sources such as home heating, so levels are more similar. Most particulate monitoring in New Zealand is for PM10 particulates rather than PM2.5 particulates.
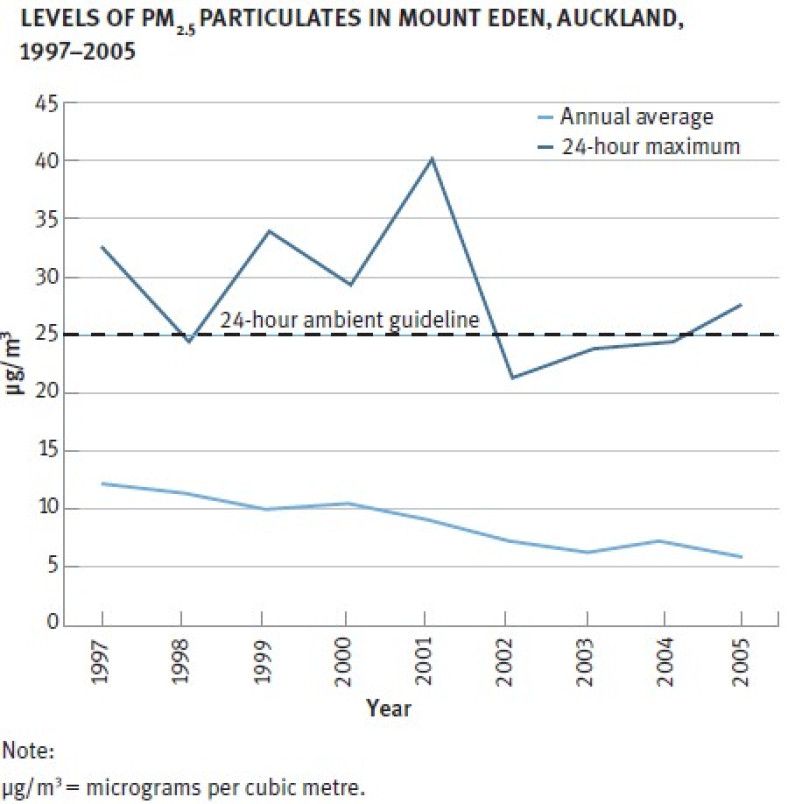
Image: Data source: Auckland Regional Council, 2006a
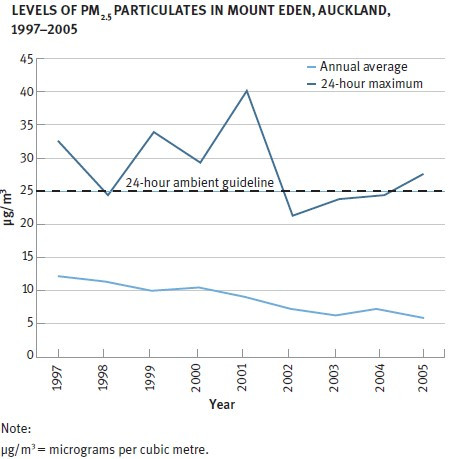
Image: Data source: Auckland Regional Council, 2006a
Monitoring for PM2.5 particulates
Monitoring for PM2.5 particulates has been carried out at several sites around Auckland. Long-term monitoring from Auckland’s residential Mount Eden monitoring site indicates an overall decrease in the annual average (see Figure 7.13). Generally, Auckland experiences a few exceedances of the reporting guideline each year. The highest number of exceedances occurred at the Penrose industrial site. Exceedances of the reporting guideline are summarised in Table 7.3.
TABLE 7.3: EXCEEDENCES OF THE REPORTING GUIDELINE FOR PM2.5 PARTICULATES AROUND AUCKLAND, 1997–2005
| Year | EXCEEDENCES OF THE PM2.5 GUIDELINE (25 μg/m3) | |||
|---|---|---|---|---|
| Year | Mount Eden | Penrose | Khyber Pass Road | Queen Street |
| 1997 | 2 | 6 | ||
| 1998 | 0 | 6 | ||
| 1999 | 1 | 3 | ||
| 2000 | 1 | 3 | ||
| 2001 | 2 | 3 | ||
| 2002 | 0 | 1 | 0 | 1 |
| 2003 | 0 | 5 | 1 | 1 |
| 2004 | 0 | 0 | 2 | |
| 2005 | 1 | 1 | 1 | |
Note:
μg/m3 = micrograms per cubic metre.
Data source: Auckland Regional Council, 2006a.
Some PM2.5 particulate monitoring has been carried out in Christchurch. Environment Canterbury estimates that during nights of high PM10 particulate levels, 90% of the particles are likely to be PM2.5 particulates (Foster, 1998).
Winter PM2.5 particulate levels are summarised in Table 7.4. In places where the source of PM10 particulates is predominantly from home heating, PM2.5 particulate levels are likely to exceed the reporting guideline (25 micrograms per cubic metre) more frequently than the PM10 particulate levels exceed the ambient air quality standard (50 micrograms per cubic metre).
For example, in 2001 there were 49 exceedences of the PM2.5 particulate reporting guideline compared with 37 exceedences of the PM10 particulate ambient standard.
TABLE 7.4: WINTER PM2.5 PARTICULATE LEVELS AT ST ALBANS, CHRISTCHURCH, 2001 AND 2005
| YEAR | MAXIMUM 24-HOUR AVERAGE |
EXCEEDENCES OF THE 25 μg/m3 GUIDELINE |
| 2001 | 123 | 49 |
| 2005 | 134 | 45 |
Note:
μg/m3 = micrograms per cubic metre.
Data source: Environment Canterbury, 2006.
Benzene
Annual benzene levels measured at an industrial Auckland site and a residential Christchurch site (see Figure 7.14) are below both the current ambient guideline (10 micrograms per cubic metre) and the guideline limit of 3.6 micrograms per cubic metre that will take effect in 2010. Levels at roadside sites in Christchurch were higher than those in residential areas. While the Christchurch roadside levels of benzene met the current ambient guideline, annual average concentrations for 2004–2005 were greater than 3.6 micrograms per cubic metre.
Benzene levels at all Christchurch sites are decreasing (Environment Canterbury, 2005). Environment Canterbury attributes the decrease in benzene levels to improvements in vehicle emissions technology, changes in fuel specifications, and possibly, changes in the number of domestic wood burners in favour of electricity or gas. Benzene levels in petrol were reduced from 4 parts per million to 1 part per million in January 2006, which should help to further improve air quality.
Monitoring of benzene in Hamilton indicates improving air quality, with all monitored sites meeting the 2010 ambient guideline between September 2005 and September 2006 (Environment Waikato, 2006a).
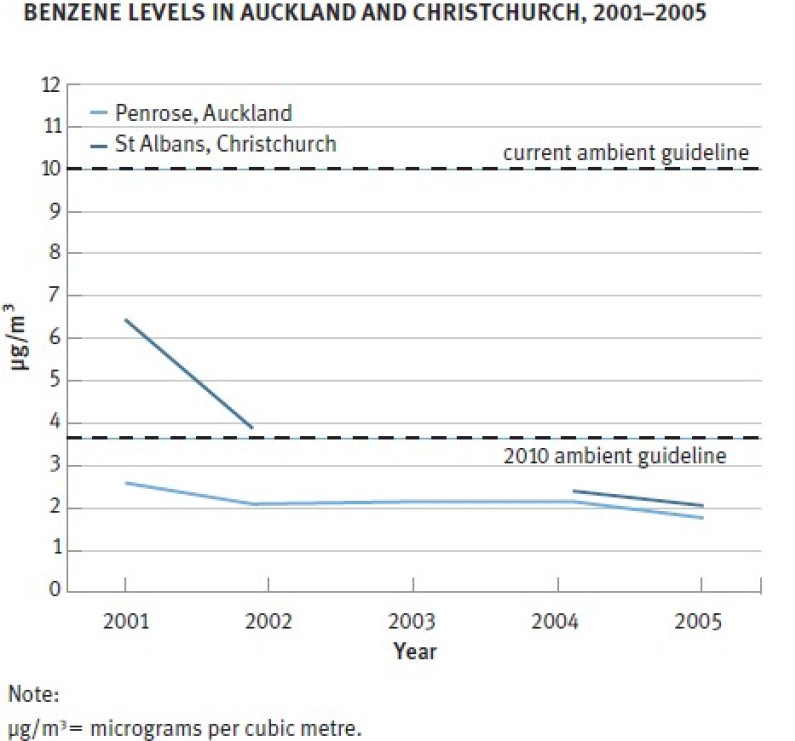
Image: Data source: Ministry for the Environment, 2006b
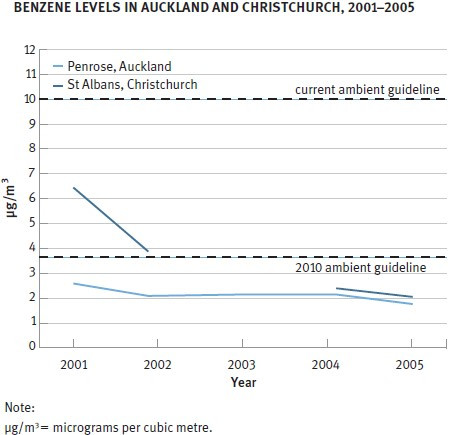
Image: Data source: Ministry for the Environment, 2006b
Emissions data for benzene has not been widely compiled in New Zealand, and emissions factors for different sources are not well established. However, data indicates the main source of benzene emissions in Auckland is from motor vehicles. In Christchurch, home heating is the main source (51 per cent) followed by road transport (42 per cent) (Ministry for the Environment, 2003).
Lead
Figure 7.15 shows a downward trend in airborne lead levels measured at three Auckland sites as a result of the reduction of lead levels in petrol, culminating in lead-free petrol in 1996. Monitoring in Christchurch indicates that levels are also well below the ambient guideline for lead.
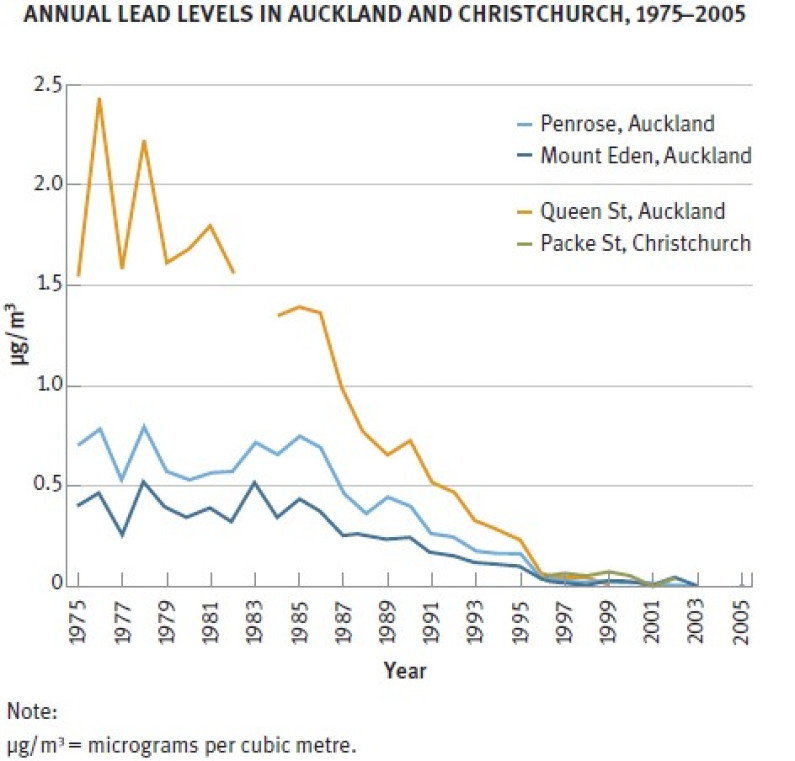
Image: Data source: Auckland Regional Council, 2006a; Ministry for the Environment, 2006c
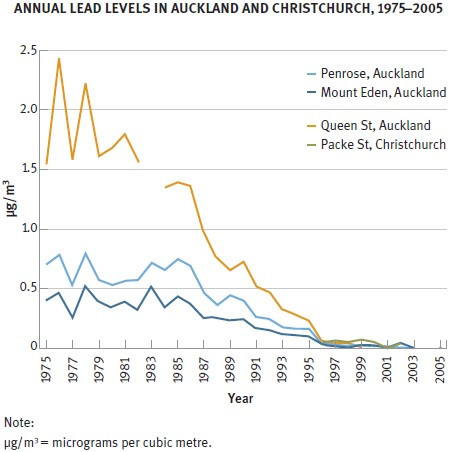
Image: Data source: Auckland Regional Council, 2006a; Ministry for the Environment, 2006c
The 1997 report, The State of New Zealand’s Environment 1997, concluded that:
New Zealand is thought to have good air quality by international standards but this judgement is based on little, but increasing, monitoring. In some locations in our larger urban centres, however, there is evidence of ambient air quality at times exceeding New Zealand guideline limits for protecting human health....
Instances of significant air pollution are caused by the combined effect of discharges from industry, small businesses and homes and the growing use of our vehicle fleet....
Regional councils have mechanisms available under the Resource Management Act to deal satisfactorily with the point source discharges, both large and small, but these mechanisms are unlikely to be as effective on vehicle emissions.
(Ministry for the Environment, 1997, chapter 10.)
Improvements in Air Quality Monitoring
Since 1997, the number of air quality monitoring sites in New Zealand has increased. Monitoring has shown that, across New Zealand, high levels of PM10 particulates caused by road traffic and winter home heating can affect both large urban areas and small settlements. These areas are now much better defined than in 1997, with the requirement to formally identify areas as gazetted airsheds. Regional PM10 particulate monitoring networks have been expanded and upgraded to ensure continuous monitoring where levels are of concern. Legislation has also been introduced to address air quality issues in specific locations.
Levels of Carbon Monoxide
The 1997 report identified concerns that elevated levels of roadside carbon monoxide were likely to increase as vehicle numbers increased. However, while the national vehicle fleet has continued to grow since the mid-1990s, carbon monoxide levels at many monitoring sites appear to have improved. This improvement is most likely a result of improved vehicle technology.
Ozone levels in Auckland, Hamilton, and Christchurch
In 1997 little ozone monitoring took place. This meant the extent of ozone pollution was not well understood. Since this time, monitoring in Auckland, Hamilton, and Christchurch (the areas of potential concern identified in the 1980s) indicates that ozone levels are not as high as those experienced in parts of Europe, and are unlikely to be a significant health problem.
New air quality regulations
Since the 1997 report, 14 national environmental standards have come into effect to improve air quality in New Zealand. They do so by setting maximum thresholds for five common ambient air pollutants, and introducing prohibition and design standards. This is a significant step forward in improving New Zealand’s air quality.
Present and future management
Today, the main focus for improving New Zealand’s air quality is on addressing PM10 particulate pollution from home heating and traffic in affected areas around New Zealand. A number of initiatives (such as the Warm Homes initiative) are under way to address emissions from home heating and ensure better health.
As the Resource Management Act 1991 is unlikely to be effective in controlling air pollution from traffic, other work is under way to minimise the impact of air pollution from road transport. This work includes the introduction of a visible smoke test for warrants of fitness or certificates of fitness, and the requirement for imported vehicles to meet certain emissions standards. Further reductions in air pollution from road transport are likely to result through improved emissions control equipment on imported vehicles.
Having put in place regular monitoring of air quality in managed airsheds, work will continue to track the effectiveness of the national environmental standards for air quality to ensure levels of PM10 particulates meet the target set for 2013.
Future work on improving air quality is likely to focus on developing a better understanding of PM2.5 levels around New Zealand.
Auckland Regional Council. 2006a. Air Quality Data CD. Auckland: Auckland Regional Council.
Auckland Regional Council. 2006b. Auckland Air Emissions Inventory: 2004. Auckland: Auckland Regional Council.
Bates et al. 2001. Investigation of Organochlorine Contaminants in the Milk of New Zealand Women. Wellington: Institute of Environmental Science and Research.
Covec, 2005. Vehicle Fleet Emission Screening Programme: Social and economic impact assessment: Phase 1, prepared for the Ministry of Transport. Auckland: Covec Limited.
Environment Canterbury. 2004. 2002 Christchurch Inventory of Emission to Air. Christchurch: Environment Canterbury.
Environment Canterbury. 2005. Concentrations of Benzene, Toluene, Ethylbenzene and Xylene in Ambient Air, Christchurch 2004/2005. Christchurch: Environment Canterbury.
Environment Canterbury. 2006. Annual Ambient Air Quality Monitoring Report 2005. Christchurch: Environment Canterbury.
Environment Waikato. 2006a. Air Quality Monitoring 2006. Hamilton: Environment Waikato.
Environment Waikato. 2006b. Hamilton Emission Inventory 2005. Hamilton: Environment Waikato.
Fisher, G, Kjellstrom, T, Kingham, S, Hales, S, and Shrestha, R I. 2007. Health and Air Pollution in New Zealand; Main report. Auckland: Health Research Council, Ministry for the Environment, and Ministry of Transport.
Foster, E. 1998. An Investigation into the Measurement of PM10in Christchurch. Canterbury: Canterbury Regional Council.
Greater Wellington Regional Council. 2005. Air Quality Monitoring Technical Report. Wellington: Greater Wellington Regional Council.
Ministry for the Environment. 1997. The State of New Zealand’s Environment 1997. Wellington: Ministry for the Environment and GP Publications.
Ministry for the Environment. 2001. An Action Plan for Reducing Discharges of Dioxin to Air. Wellington: Ministry for the Environment.
Ministry for the Environment. 2002. Ambient Air Quality Guidelines. Wellington: Ministry for the Environment.
Ministry for the Environment. 2003. Emissions Inventories for CO, NOx, SO2, Benzene and Benzo(a)pyrene in New Zealand. Wellington: Ministry for the Environment.
Ministry for the Environment. 2005. Warm Homes Technical Paper: Social drivers, phase 1 interim progress report. Wellington: Ministry for the Environment.
Ministry for the Environment. 2006a. GEMS/AMIS Air Quality Monitoring Programme Annual Report 2005. Wellington: Ministry for the Environment.
Ministry for the Environment. 2006b. Ministryfor the Environment GEMS/AMIS Air Quality Programme Review 1996-2005, unpublished. Wellington: Ministry for the Environment.
Ministry for the Environment. 2006c. New Zealand’s National Implementation Plan under the Stockholm Convention on Persistent Organic Pollutants. Wellington: Ministry for the Environment.
Ministry of Economic Development. 2006. New Zealand’s Energy Outlook to 2030. Wellington: Ministry of Economic Development.
Ministry of Transport. 2007. Vehicle Emissions: Questions and answers. Retrieved from http://www.transport.govt.nz/qa6 (23 May 2007).
National Institute for Water and Atmospheric Research. 1996. A Study of the Photochemical Pollution Potential in New Zealand’s Major Cities. Auckland: National Institute of Water and Atmospheric Research.
Otago Regional Council. 2005a. Air Emissions Inventory – Dunedin, Mosgiel and Alexandra 2005, unpublished. Dunedin: Otago Regional Council.
Otago Regional Council. 2005b. Ambient Air Quality in Otago 1997–2004 (Particulate Matter). Dunedin: Otago Regional Council.
Chapter 7: Air
December 2007
© Ministry for the Environment