Energy in New Zealand
Using energy supplies efficiently saves money and helps New Zealand companies produce their goods and services more competitively.
New Zealand has access to a wide range of energy sources, both renewable (hydro, geothermal, wood, wind, biogas, and solar) and non-renewable (oil, gas, and coal). We have some of the most efficient forms of renewable energy in the world, such as wind and hydro.
While our energy needs are increasing, they are not increasing as fast as our economy is growing. Since 1990, New Zealand’s economic growth has exceeded energy demand, indicating that New Zealand’s economy has reduced, to some degree, its reliance on energy.
Impacts of energy
All forms of energy generation and use have an impact on the environment. For example, our growing consumption of non-renewable energy contributes to increased greenhouse gas and particulate emissions, which have negative impacts on the environment and human health.
Energy supply and consumption
New Zealand’s total primary energy supply is growing to meet increased consumer demand. Between 1995 and 2005, New Zealand’s total primary energy supply increased by 10 per cent, from 675 petajoules to 740 petajoules. In 2005, 72 per cent of this supply comes from fossil-fuel-based oil and natural gas. The remaining 28 per cent is from renewable sources.
As our population grows and our lifestyles change, so do our energy needs. Between 1995 and 2005, total consumer energy demand increased by 21 per cent from 407 petajoules to 494 petajoules. Much of this growth in demand is from transport, which accounted for 43 per cent of New Zealand’s total energy consumption in 2005. To meet this demand, New Zealand has become more reliant on imported oil and oil products.
New Zealand’s use of renewable sources for electricity generation is high by international standards. In 2005, renewable sources accounted for about 66 per cent of New Zealand’s electricity generation, with hydro-electricity providing 56 per cent of New Zealand’s total electricity generation.
Present and future management
In 2007, New Zealand is increasing its focus on renewable energy, energy efficiency and conservation, and security of supply to meet our increasing energy demands.
This focus on efficiency, conservation, and renewable energy will continue as New Zealand responds to the national and international demands for action on climate change.
Domestically, the increasing demand for energy is likely to require the development of new infrastructure for electricity generation (such as power stations and wind turbines) and transmission (transmission lines).
We are also likely to experience changes in the future to the fuels we use in our vehicles, with the uptake of biofuels and an increasing number of hybrid vehicles on our roads.
Energy is an essential part of almost all our industrial, commercial, transport, and household activities. A secure and sustainable energy supply is therefore vital to ensuring New Zealand’s continued economic and social well-being.
Renewable energy sources
New Zealand has access to a diverse range of renewable energy sources (see Figure 5.1). The water in our rivers is harnessed to provide hydro-electric generation, with well-developed systems in the Waikato River catchment in the North Island and the Waitaki River and Clutha River catchments in the South Island.
Since the 1900s, geothermal energy has been used to generate electricity in New Zealand, with high-temperature geothermal reservoirs concentrated in the Taupō Volcanic Zone. New Zealand’s first geothermal power station was commissioned at Wairākei in 1958.
Further contributions to New Zealand’s renewable energy supply come from wood, biogas, the sun, and wind. The marine environment has the potential to contribute to New Zealand’s energy needs in the future – wave and tidal energy can be harnessed to generate renewable electricity. Some industrial processes burn waste materials, such as used oil and wood waste, to create energy (see box ‘Local action: waste-to-energy later in this chapter for more information).
There are potential limitations with some renewable energy sources, such as hydro and wind. While New Zealand has a lot of potential capacity, public opinion is divided on further growth in the number of hydro-electric power stations on rivers and the number of large wind farms.
Non-renewable energy sources
Reserves of natural gas and limited quantities of oil are extracted from gas and oil fields in the Taranaki region. The balance of New Zealand’s oil supply is imported. Coal deposits exist throughout New Zealand, although most production is from mines on the South Island’s West Coast and from the Waikato region.
Environmental and human health impacts
The production and use of renewable and non-renewable energy impacts on the environment as listed in the examples below.
- The extraction and processing of fossil fuels affects adjacent air, land, and sea.
- The burning of fossil fuels contributes to:
- climate change through a build-up of greenhouse gases, primarily carbon dioxide
- localised air pollution due to particulate emissions.
- Construction of storage lakes and dams for hydro-electric generation alters the surrounding land, ecosystems, and settlements.
- Wind farms have a visual impact on the landscape and selecting suitable sites for wind power developments can be difficult because such sites are often exposed locations on prominent ridgelines. The potential noise impact of wind farms is also a consideration in the assessment of environmental impacts.
The by-products of fossil fuel energy use include harmful particulate emissions, which can impact on human health causing irritation of the eyes, throat, and lungs. For people with existing respiratory conditions, such as asthma or bronchitis, inhaling particulates can exacerbate the condition (see chapter 7, ‘Air’ for more information about particulates).
Energy consumption
As our population grows and our lifestyles change, so do our energy needs. Over the past 10 years our consumption of goods and services has increased (see chapter 3, ‘Household consumption’), and so has our consumption of energy.
Figure 5.1: Location of New Zealand’s major energy sources
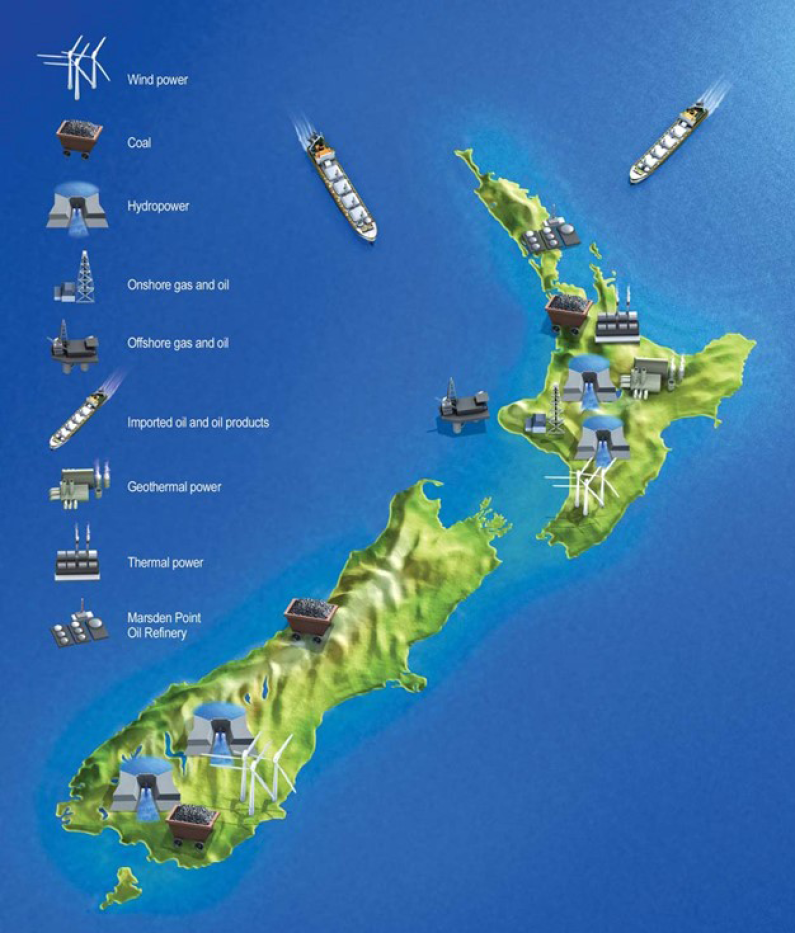
Image: Source — Ministry for the Environment.
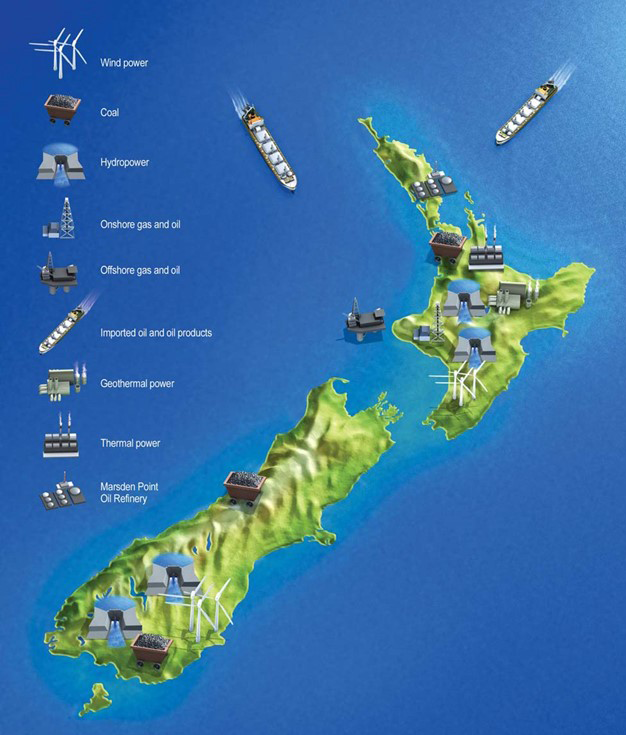
Image: Source — Ministry for the Environment.
See chapter 1, ‘Environmental reporting’ for more information on the core national environmental indicators and how they are used.
There are four national environmental indicators for energy. They are:
- total consumer energy demand
- total primary energy supply
- consumer energy demand compared to gross domestic product
- electricity generation.
Total consumer energy demand
This indicator measures the total amount of energy consumed in New Zealand, by fuel type and by sector.
Total primary energy supply
This indicator measures the total amount of energy available for use in New Zealand. It includes energy as it is first obtained from natural sources. This means that coal is accounted for as it is mined, domestic oil and natural gas as they are extracted from wells, imported oil and oil products as they are imported, and hydro as it is used for electricity generation.
The indicator accounts for imports and exports, and allows for changes in energy stocks between months, quarters, or years. By convention, fuels used for international transport are excluded from total primary energy supply.
Consumer energy demand compared to gross domestic product
This indicator measures the progress New Zealand is making towards separating (‘decoupling’) energy demand from economic growth. It compares economic growth as measured by gross domestic product (GDP) with consumer energy demand and aims to indicate the economy’s reliance on energy resources (that is, the extent to which GDP and energy demand are decoupled).
Decoupling can be either ‘relative’ or ‘absolute’. Absolute decoupling is said to occur when energy demand is stable or decreasing while GDP is growing. Decoupling is said to be relative when energy demand is increasing, but at a lesser rate than GDP (Organisation for Economic Co-operation and Development, 2002).
The ideal trend is for the economy to grow while demand for energy decreases (absolute decoupling) or at least grows at a slower rate or remains constant (relative decoupling), indicating economic prosperity at a reduced cost to the environment.
Electricity generation
This indicator measures electricity generation by fuel type and the relative efficiency of each fuel type. Relative efficiency is determined by comparing the total amount of each fuel type available for electricity generation with the net amount of electricity it generates.
Government action on energy
New Zealand Energy Strategy to 2050
The New Zealand Energy Strategy to 2050, Powering our Future: Towards a sustainable low emissions energy system, was released in October 2007. The strategy provides long-term direction for energy policy and promotes the development of an energy system that supports economic growth in an environmentally responsible way (Ministry of Economic Development, 2007).
New Zealand Energy Efficiency and Conservation Strategy
The Energy Efficiency and Conservation Authority was established as a Crown entity in 2000 and, with the Ministry for the Environment, developed the National Energy Efficiency and Conservation Strategy (NEECS). The strategy set out the Government’s policies on energy efficiency, energy conservation, and the use of renewable energy. It also set national targets relating to both energy efficiency and the level of energy supply for renewable energy sources.
In October 2007, the New Zealand Energy Efficiency and Conservation Strategy, Making it Happen: Action plan to maximise energy efficiency and renewable energy was released to replace the NEECS. It will help achieve the objectives of the New Zealand Energy Strategy to 2050. It includes measures to reduce electricity demand; address energy use in transport, buildings, and industry; and promote greater consideration of sustainable energy in the development of land, settlements, and energy production (Energy Efficiency and Conservation Authority, 2007).
Energy Efficiency and Conservation Act 2000
The Energy Efficiency and Conservation Act 2000 is the legislative basis in New Zealand for promoting energy efficiency, energy conservation, and renewable energy. The Act established the Energy Efficiency and Conservation Authority as a stand-alone Crown entity with a role to promote energy efficiency, energy conservation, and renewable energy across all sectors of the economy.
The Act provides for the preparation of regulations for product energy efficiency standards and labelling, as well as disclosing information to compile statistics on energy efficiency, energy conservation, and renewable energy.
Total consumer energy demand
Energy consumption cannot simply be thought of in terms of the amount of energy used to fuel our cars and to heat and light our homes. Before reaching us, many forms of energy are converted from their initial state (primary energy) into a more convenient, useable state (consumer energy). This process is called energy transformation.
Approximately one-third of New Zealand’s primary energy is ‘lost’ during the transformation process. Where conversion involves heat (for example, converting geothermal steam into electricity), large amounts of energy are lost as waste heat.
Further primary energy is diverted into non-energy products (for example, the production of urea fertiliser and methanol from natural gas). As a result, our total primary energy consumption is far greater than the amount consumed by end users suggests.
Figure 5.2 shows consumer energy demand by fuel type for 2005. Just over half of New Zealand’s consumer energy demand was met by oil (51 per cent) and nearly a third (27 per cent) by electricity. The remaining demand was met by gas (9 per cent), other renewables (biogas, wind, wood, and solar) (7 per cent), coal (4 per cent), and geothermal (2 per cent).
See ‘Electricity generation’ later in this chapter for more information about fuel consumption for generating electricity.
Figure 5.2: Consumer energy demand by fuel type, 2005
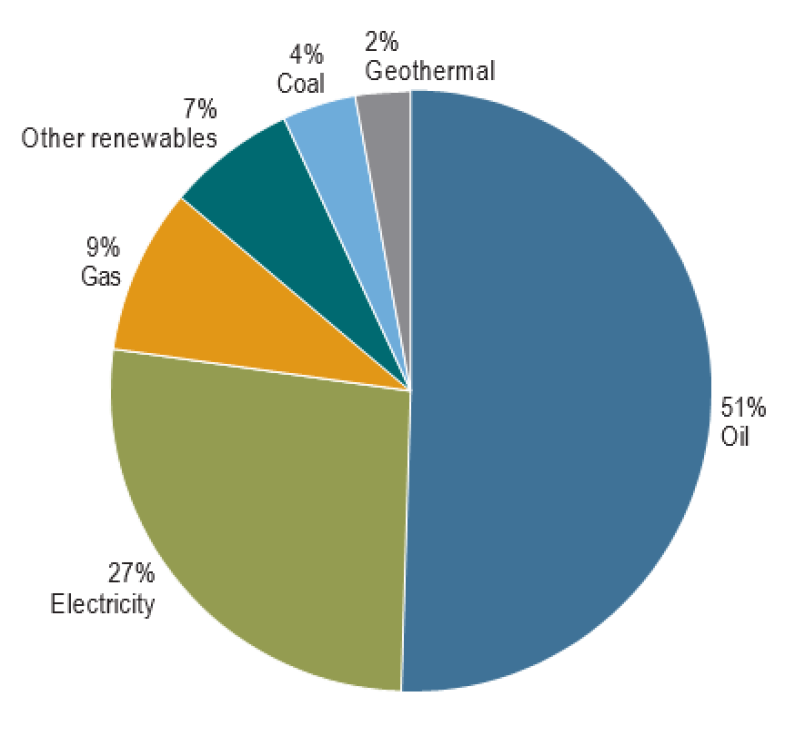
Image: Source — Ministry of Economic Development, 2006.
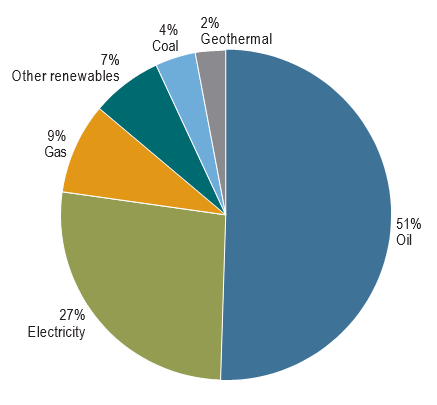
Image: Source — Ministry of Economic Development, 2006.
Figure 5.3 shows that between 1995 and 2005, consumer energy demand increased 21 per cent, from 407 petajoules to 494 petajoules. Consumption of coal and geothermal energy decreased by 15 per cent and 29 per cent respectively, while consumption of oil increased by 28 per cent, gas 26 per cent, electricity 20 per cent, and other renewables by 28 per cent.
Figure 5.3: Consumer energy demand by fuel type, 1995–2005
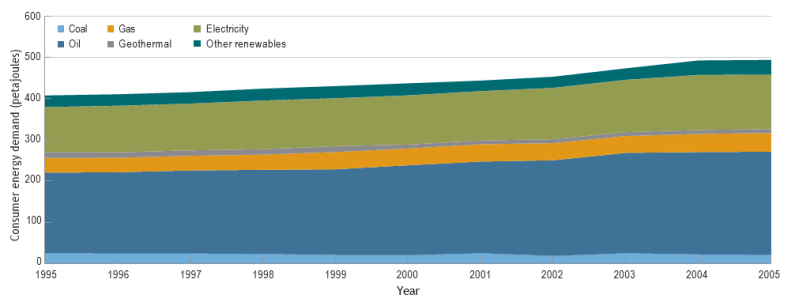
Image: Data source — adapted from Ministry of Economic Development, 2006.

Image: Data source — adapted from Ministry of Economic Development, 2006.
Figure 5.4 shows consumer energy demand by sector for 2005. Domestic transport accounted for the largest share (43 per cent) of New Zealand’s total energy consumption, while industry had the second largest share, at 30 per cent. The balance was made up by the residential (13 per cent), commercial (10 per cent), and agricultural sectors (4 per cent).
Figure 5.5 shows that between 1995 and 2005, consumer energy demand increased 21 per cent. The greatest growth was seen in the commercial sector, which increased 32 per cent. This was closely followed by the domestic transport sector, whose share increased by 30 per cent. The domestic transport sector also accounted for the largest share of energy consumed during this period.
Figure 5.4: Consumer energy demand by sector, 2005
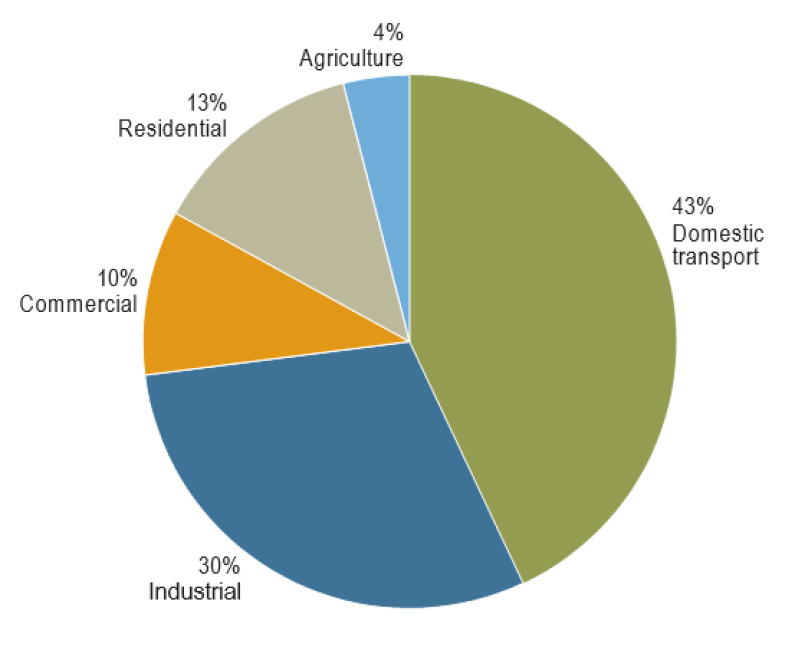
Image: Source — Ministry of Economic Development, 2006.

Image: Source — Ministry of Economic Development, 2006.
Figure 5.5: Consumer energy demand by sector, 1995–2005
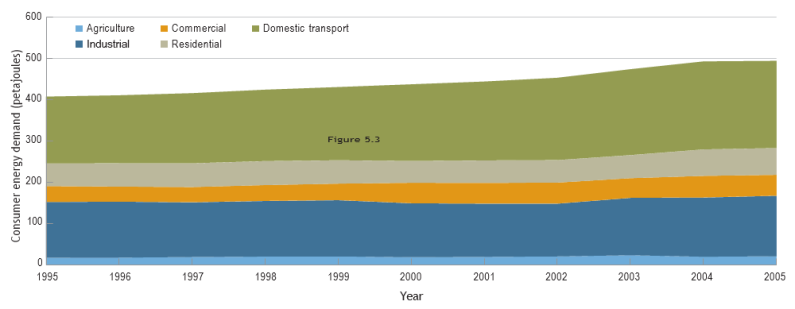
Image: Data source — adapted from Ministry of Economic Development, 2006.

Image: Data source — adapted from Ministry of Economic Development, 2006.
Total primary energy supply
In 2005, New Zealand’s total primary energy supply was about 740 petajoules. About two-thirds of this (494 petajoules) was used as consumer energy. The remaining third was used or lost during energy transformation and distribution of the energy to consumers.
New Zealand’s primary energy supply has been and still is, dominated by fossil fuels – oil, natural gas, and coal. In 2005, 72 per cent of New Zealand’s energy supply came from these sources. Of the total primary energy supply, oil accounted for 39 per cent, gas for 20 per cent, and coal 13 per cent (see Figure 5.6).
Renewable energy sources accounted for the remaining 28 per cent of New Zealand’s primary energy supply in 2005, comprising a mix of hydro (11 per cent), geothermal (11 per cent), and other renewable sources, including solar, wind, biogas, and wood (6 per cent).
A small amount of energy is generated in New Zealand from waste products such as used oil and methane gas. Refer to box ‘Local action: waste-to-energy’ for an example of a successful project.
Local action: waste-to-energy
There is a growing awareness in New Zealand of opportunities to produce energy from waste. Waste-to-energy projects have benefits for the environment, including reduced greenhouse gas emissions and reduced reliance on fossil fuels.
Christchurch City Council has turned waste into a resource by capturing gas from the closed Burwood landfill to heat and power the QEII Park swimming pool complex. Using landfill gas at QEII Park will replace 1.5 million litres of liquid petroleum gas each year, helping to reduce the Council’s reliance on fossil fuels. The project also has benefits for reducing greenhouse gas emissions, because methane gas is captured instead of being released into the environment.
Through the Projects to Reduce Emissions programme, Christchurch City Council was allocated 200,000 carbon credits by the Government for the project. The carbon credits will be transferred to Christchurch City Council in return for emission reductions from 2008 to 2012.
Figure 5.6: Primary energy supply, 2005

Image: Source — Ministry of Economic Development, 2006.
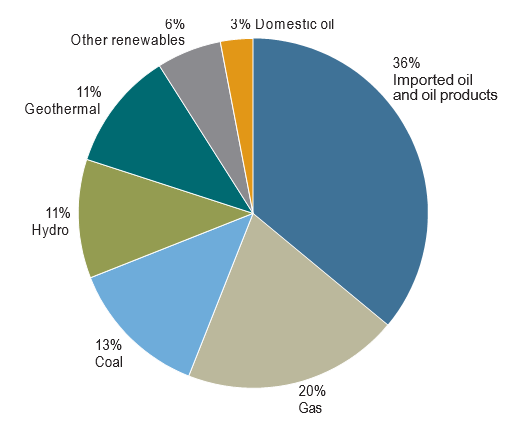
Image: Source — Ministry of Economic Development, 2006.
Since 1974, New Zealand’s primary energy supply has increased by 89 per cent, from 392 petajoules to 740 petajoules. Changes in the mix of fuels that contribute to our energy supply have also occurred over that time (see Figure 5.7). For example, the development of the Maui gas field off the coast of Taranaki in the 1970s resulted in an increase in the amount of gas available for use from the early 1980s on. As New Zealand’s gas and oil reserves declined over the 10 years between 1995 and 2005, there was a 40 per cent decrease in the primary energy supply of domestic oil. To maintain security of supply, New Zealand increased its imports of oil and oil products by 38 per cent during the same period.
From 1995 to 2005, New Zealand’s primary energy supply increased by about 10 per cent, from 675 petajoules to 740 petajoules. The sources of energy supply varied during this time, with the most notable trend being a 100 per cent increase in the amount of energy supplied by coal.
The split between renewable and non-renewable energy sources has remained relatively constant during the period 1995 to 2005, with fossil fuels contributing about 70 per cent and renewable sources about 30 per cent of the primary energy supply. The share of renewable energy varies from year to year, depending on water inflows to hydro-electricity lakes and consumer demand for energy.
Figure 5.7: Primary energy supply, 1974–2005
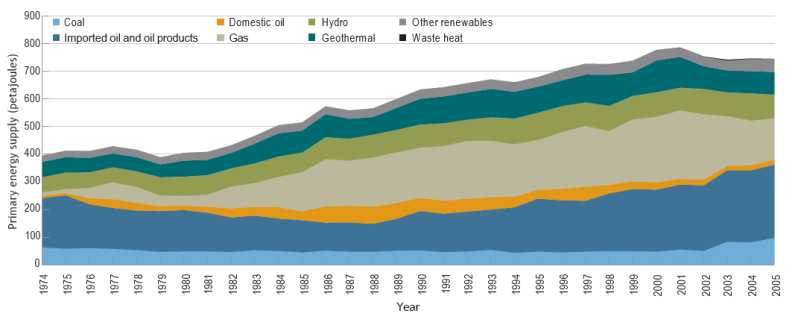
Image: Source — Ministry of Economic Development, 2006.
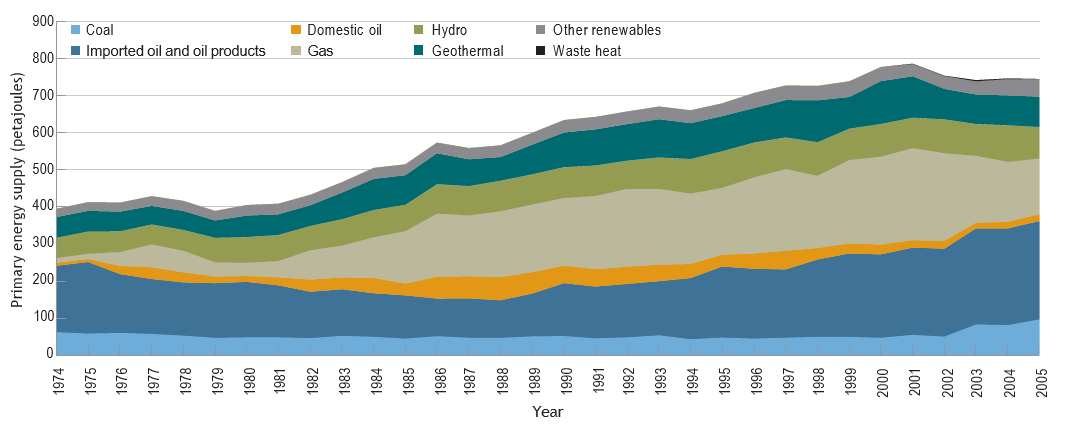
Image: Source — Ministry of Economic Development, 2006.
Consumer energy demand compared to gross domestic product
From 1990 to 2005, New Zealand’s total consumer energy demand increased by 37 per cent. Over the same period, the size of the New Zealand economy, as measured by gross domestic product (GDP), increased by 56 per cent. This increase suggests the economy is reducing its reliance on energy, at least to some degree. As shown in Figure 5.8, the relationship between energy demand and economic growth has varied during the period.
Figure 5.8: Consumer energy demand compared to gross domestic product (percentage change, 1990–2005)
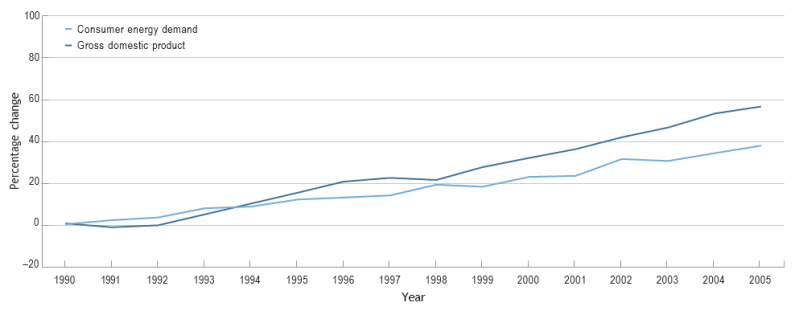
Image: Data source — adapted from Ministry of Economic Development, 2006; Statistics New Zealand, 2006.
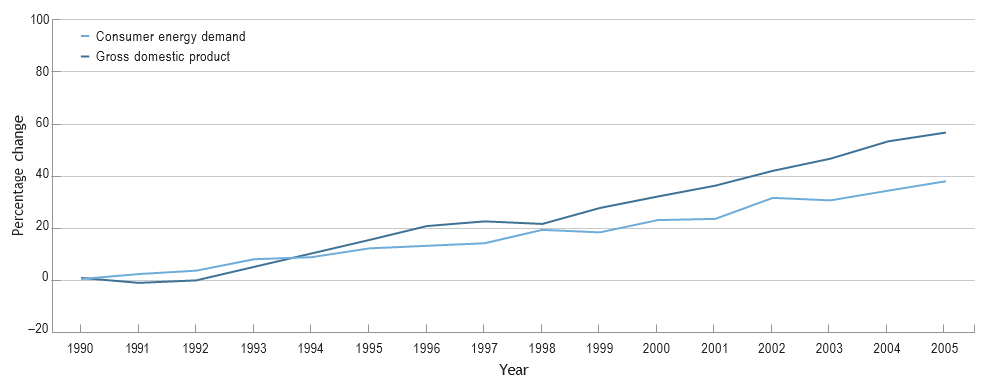
Image: Data source — adapted from Ministry of Economic Development, 2006; Statistics New Zealand, 2006.
Electricity generation
Over the last decade, New Zealand’s electricity industry has gone through a process of reform to establish a competitive market.
New Zealand’s electricity is produced at generation stations connected at high voltage to the national transmission network, known as the national grid. Transpower New Zealand Limited owns and operates the national grid, which connects most of the major power stations around the country to local distribution lines.
Electricity in New Zealand often has to travel a considerable distance from where it is generated to the end user. This results in comparatively high transmission losses, by international standards.
The Electricity Commission was established in 2003 to regulate the industry. It regulates the operation of the electricity industry and markets to ensure electricity is generated and delivered to consumers in an efficient, fair, reliable, and environmentally sustainable manner (Electricity Commission, 2005).
New Zealand’s fuels for electricity generation
In comparison to many countries, New Zealand generates a high proportion of electricity from renewable sources. In 2005, renewable sources accounted for 66 per cent of New Zealand’s electricity generation, with hydro-electricity providing 56 per cent of that amount. Geothermal (6 per cent), wind (1 per cent), and others (biogas, waste heat, and wood) (2 per cent) are the other renewable sources contributing to New Zealand’s annual electricity generation (these figures add up to 65 per cent due to rounding). (See Figure 5.9).
Most of New Zealand’s renewable electricity is generated by hydro-electric power stations in the South Island. The amount varies from year to year, depending on water inflows to storage lakes from rainfall and snowmelt. In dry years, such as 2005 when storage lake levels were low due to lack of rainfall, fossil fuels (coal and gas) are relied on to make up the shortfall in generation. (See Figure 5.10).
Figure 5.9 shows that in 2005, fossil fuels (coal and gas) provided 34 per cent of New Zealand’s total electricity generation. This is an increase from the previous year, when coal and gas made up 27 per cent of the total.
Wind has played an increasingly important role in electricity generation, contributing 1.5 per cent of total generation in 2005, compared with 0.9 per cent the previous year (discrepancies between text and figure are due to rounding). New Zealand currently has eight wind farms in operation, capable of generating more than 228 megawatts in total. This is enough energy to power about 100,000 households (assuming the wind farms are operating 40 per cent of the time).
Figure 5.9: Electricity generation by fuel type, 2005

Image: Data source — adapted from Ministry of Economic Development, 2006.
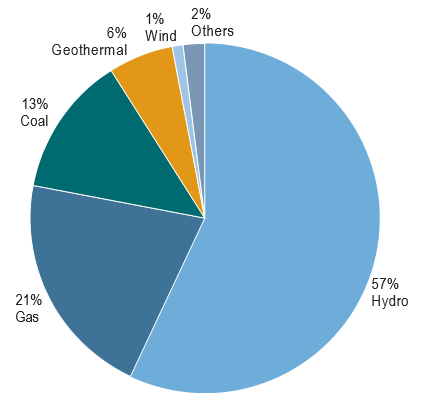
Image: Data source — adapted from Ministry of Economic Development, 2006.
Figure 5.10: Electricity generation by fuel type, 1974–2005

Image: Source — Ministry of Economic Development, 2006.
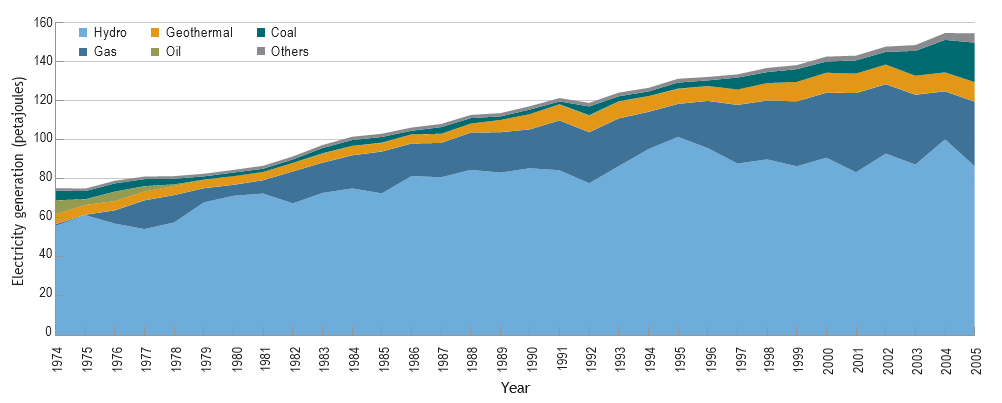
Image: Source — Ministry of Economic Development, 2006.
Efficiency of fuel types for electricity generation
Energy efficiency means doing more with the same amount of energy, or doing the same thing using less energy. By using more efficient fuels to generate electricity, New Zealand can minimise the amount of energy we need to produce and use. The efficiency of each fuel type for generating electricity is calculated as the difference between the primary energy use and the net amount of electricity generated by each fuel type.
Figure 5.11 presents a ‘snapshot’ of energy flows within New Zealand’s electricity system (based on 2005 data). It shows the fuel types used to generate electricity, how much electricity they generate, and where it is used.
The process of generating electricity from primary energy (for example, burning coal to drive turbines) generates a lot of heat that cannot easily be harnessed to generate electricity and is therefore lost. This lost energy is an example of the ‘transformation losses’ that occur during the process of converting primary energy, such as coal, into a more useful form of energy, such as electricity.
A small proportion of the generated electricity is used within power stations for lighting and heating (a quantity referred to as ‘own use’). Some of the electricity is also lost from power lines in the form of heat and faults while being transmitted to consumers (referred to as ‘transmission losses’). Completing the balance are ‘statistical differences’, which are small reporting errors that may occur in processing this information.
Figure 5.11 shows that in 2005, the total primary energy supply for electricity generation was 293 petajoules, while the net amount of electricity generated was 149 petajoules, which represents an average efficiency of just over 50 per cent. The remaining 144 petajoules were lost as heat when transforming the primary energy sources into electricity, and also used as electricity within power stations (‘own use’). In 2005, 132 petajoules of the electricity generated were used by the consumer once further losses in transmitting and distributing the electricity and statistical differences were taken into account.
Figure 5.11: Relative efficiency of fuel types for electricity generation, 2005
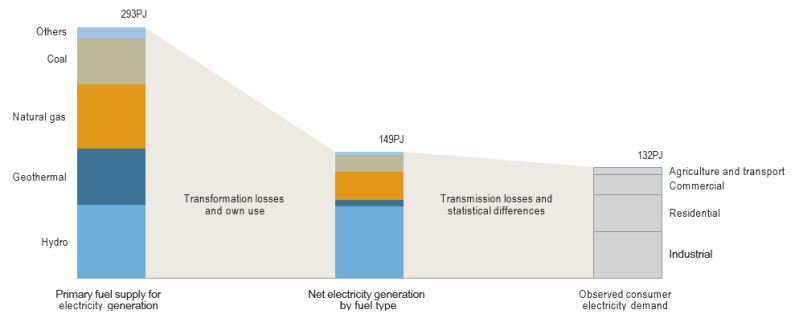
Image: Data source — adapted from Ministry of Economic Development, 2006.
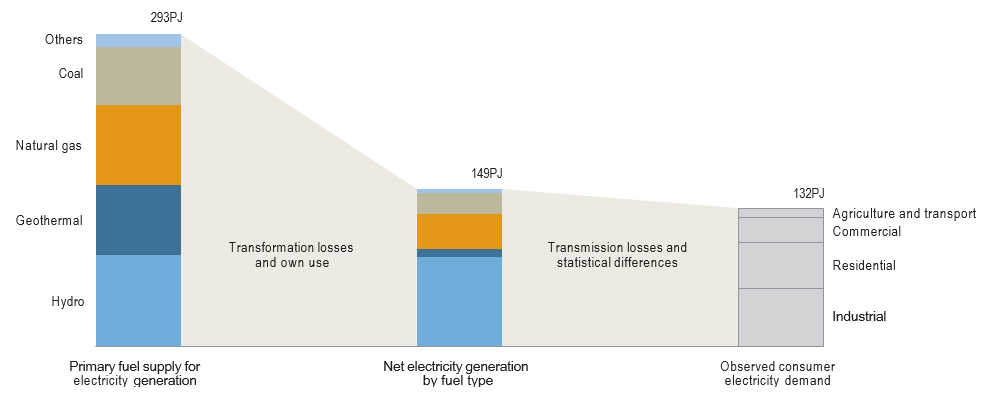
Image: Data source — adapted from Ministry of Economic Development, 2006.
On average, hydro and wind are the most efficient forms of energy for generating electricity in New Zealand, at almost 100 per cent efficient. By convention, geothermal generation is around 15 per cent efficient. In general, the efficiency of thermal fuels (coal and natural gas) ranges from 30 to 50 per cent. While thermal fuel may seem relatively inefficient compared with hydro and wind, thermal fuels are important, at least at present, for meeting our energy needs at times of peak demand, or in dry years.
It is important to note that these efficiencies reflect national averages and some generation plants may be more efficient than others. In addition, while the use of geothermal energy for electricity is relatively inefficient, the direct use of geothermal energy (for example, for heating water) is much more efficient than converting that energy to electricity.
Government action on energy efficiency and conservation
Several government programmes have been developed in recent years to raise community awareness about energy efficiency and provide businesses and households with the tools to improve their energy choices. Energy efficiency initiatives include the following programmes:
Solar Water Heating programme
The Solar Water Heating programme promotes the uptake of solar water heating in homes, which in turn reduces the demand for electricity and gas. In 2006, the Government announced an investment of $15.5 million over the first three-and-a-half years of a five-year programme to increase the use of solar water heating. The New Zealand Energy Efficiency and Conservation Strategy has set a target of 15,000-20,000 solar water heating units to be installed by 2010 (Energy Efficiency and Conservation Authority, 2006).
The Minimum Energy Performance Standards programme
This programme reduces energy consumption by ensuring products such as fridges/freezers, hot-water cylinders and air conditioners comply with specific minimum standards for energy efficiency.
Emprove
Emprove is a suite of management tools to help businesses cut energy costs by adopting an energy management plan to control the amount of energy used. The Energy Efficiency and Conservation Authority encourages businesses to regard energy as a variable cost, rather than a fixed overhead, assisting them with energy audit grants and advice to identify opportunities to reduce their energy use.
Energy Intensive Businesses programme
This programme offers cash grants to help businesses adopt energy saving technologies, which may not be widely adopted in their sector. It is aimed at companies in nine energy intensive sectors which spend more than 5 per cent of their business costs on energy.
EnergyWise Home Grants scheme
This scheme retrofits the homes of low-income households with better insulation, leading to health and energy-saving benefits. As of March 2007, more than 30,000 homes have been retrofitted in this way.
The 1997 report, The State of New Zealand’s Environment 1997, concluded that:
Most of our electricity is of hydro origin (with impacts on river flows and lake levels) but around two-thirds of our total primary energy supply is from fossil fuels (with pollutant impacts on atmosphere, water and soil)…
Responses to the environmental impacts of energy services include the requirement to obtain consents under the Resource Management Act, moves toward greater use of renewable energy forms (including the development of wind power) and the encouragement of energy efficiency.
In 2007, most of New Zealand’s electricity is still generated from its hydro resources and more than two-thirds of its total primary energy supply comes from fossil fuels.
Consumer demand for energy
Since 1997, total consumer demand for energy has grown. During this time, consumption of oil, gas, electricity, and renewable fuels (biogas, wind, wood, and solar) has increased, while consumption of geothermal energy and coal has decreased (excluding the geothermal energy and coal used to generate electricity). Since 1997, the transport sector has consumed the largest share of energy; however, the commercial sector has shown the greatest growth in consumption.
Similarly, Statistics New Zealand’s 2007 report, Energy and the Economy: 1997–2005, found that use of transport fuels by households accounts for a considerable proportion of New Zealand’s energy consumption. In 2005, households used 83 per cent of New Zealand’s consumer petrol. When electricity use by households is combined with their transport fuel use, households are the largest user of energy in New Zealand.
Total primary energy supply
To meet growing consumer demand, New Zealand’s total primary energy supply has increased since 1997 and is still dominated by fossil fuels.
New Zealand’s domestic gas and oil reserves have declined over the past 10 years, and as a result the amount of primary energy supplied by New Zealand oil has decreased. However, the contribution of New Zealand oil sources to its total primary energy supply has always been relatively small, and we rely on imported oil to ensure security of supply.
Use of renewable energy
Since 1997, New Zealand has been moving towards greater use of renewable energy forms such as wind power, solar power, and biofuels.
In 1997, New Zealand had one wind farm, Hau Nui in the Wairarapa region, and one turbine at Brooklyn in Wellington. There are now eight wind farms operating throughout the country, with several more projects at various stages of planning.
Demand for solar energy is small but is increasing, particularly for water heating. Industry sales of solar water heating systems indicate that, as of June 2006, about 35,000 solar water heating systems were installed in New Zealand homes and commercial buildings. Ten per cent (3,500) of these were installed in the year leading up to June 2006 (Energy Efficiency and Conservation Authority, 2006b).
International energy policies have led to the development of a global market for renewable transport fuels and technologies. This has prompted the introduction of biofuels for commercial use in New Zealand.
Energy efficiency and conservation
Since the introduction of the Energy Efficiency and Conservation Act in 2000, there has been an increased focus on energy efficiency and conservation in New Zealand. Energy efficiency and conservation measures focus on demand management – that is, influencing the quantity and pattern of energy used by the consumer. Examples include:
- programmes to improve insulation in older homes and to encourage the uptake of efficient home heating and lighting options
- the Energy Star rating programme, which enables consumers to compare the energy efficiency of household appliances
- the introduction of energy efficiency requirements in the Building Code
- schemes to help businesses, households, and organisations save energy.
By improving how we use energy, New Zealand can reduce the need for new energy supplies, improve security of supply, reduce greenhouse gas emissions, and increase productivity. This will free up valuable capital for more productive enterprises.
Since 1997, consumer energy demand has increased at a lesser rate than the growth of the economy (as measured by gross domestic product). This trend indicates weak relative decoupling of energy demand from economic growth. In the future, there will be a greater focus on decoupling energy demand and economic growth.
Present and future management
New Zealand continues to move towards greater use of renewable energy and an increased focus on energy efficiency.
The recent changes in international energy supply and higher energy costs, coupled with concerns about climate change, have resulted in a global drive towards even greater energy efficiency and greater use of renewable fuels. These concerns are likely to continue into the future. The challenge for New Zealand is to maintain economic and social well-being, while reducing the environmental costs of energy use.
Electricity Commission. 2005. Electricity Industry Markets and Operational Structure. Retrieved from http://www.electricitycommission.govt.nz/industry/ (5 March 2007).
Energy Efficiency and Conservation Authority. 2006. Increasing the Uptake of Solar Water Heating. Wellington: Energy Efficiency and Conservation Authority.
Energy Efficiency and Conservation Authority. 2007. New Zealand Energy Efficiency and Conservation Strategy, Making it Happen: Action plan to maximise energy efficiency and renewable energy. Wellington: Energy Efficiency and Conservation Authority.
Energy Efficiency and Conservation Authority. No date. Energy Efficiency and Conservation Authority. Retrieved from http://www.eeca.govt.nz (6 August 2007).
Ministry for the Environment. 1997. The State of New Zealand’s Environment 1997. Wellington: Ministry for the Environment and GP Publications.
Ministry of Economic Development. 2006. New Zealand Energy Data File. Wellington: Ministry of Economic Development.
Ministry of Economic Development. 2007. Powering our Future: Towards a sustainable low emissions energy system – New Zealand Energy Strategy to 2050. Wellington: Ministry of Economic Development.
Organisation for Economic Co-operation and Development. 2002. Indicators to Measure Decoupling of Environmental Pressure from Economic Growth – Executive Summary, 16 May 2002. Retrieved from http://www.oecd.org/dataoecd/0/52/1933638.pdf (26 February 2007).
Statistics New Zealand. 2006. Gross Domestic Product September 2006 Quarter. Retrieved from http://www.stats.govt.nz/store/2006/12/gross-domestic-product-sep-06-qtr... (5 March 2007).
Statistics New Zealand. 2007. Energy and the Economy: 1997–2005. Wellington: Statistics New Zealand.
Chapter 5: Energy
December 2007
© Ministry for the Environment