Transport in New Zealand
New Zealanders value their mobility. We rely on transport to access work, educational, social, and recreational activities. Transport also underpins New Zealand’s economic prosperity by enabling the movement of people and goods, and connecting New Zealand to international markets.
Road transport is the central element of New Zealand’s transport system, reflecting our small pockets of population and comparatively large land area. In recent years, New Zealanders have become increasingly reliant on road transport, and the number of vehicles per person is growing; we tend to buy larger vehicles and use them more.
Impacts of transport
Our extensive use of cars and trucks is putting pressure on the environment and human health.
- The consumption of fossil fuels creates exhaust emissions that negatively affect our air quality.
- Run-off from roads negatively affects our waterways.
- Greenhouse gas emissions from our transport fuels contribute to climate change.
- End-of-life oil, tyres, and vehicles require careful disposal.
Vehicle kilometres travelled
The number of vehicle kilometres travelled on New Zealand roads has more than doubled since 1980, indicating that New Zealanders have become increasingly mobile. The car is the largest contributor to total vehicle kilometres travelled.
In 2006, New Zealanders travelled over 39.2 billion vehicle kilometres. Between 2001 and 2005, the vehicle kilometres travelled on New Zealand roads increased for all vehicle types. In 2006, however, the vehicle kilometres travelled for all vehicle types decreased slightly from the previous year.
New Zealand’s vehicle fleet
In 2006, 61 per cent of New Zealand’s vehicle fleet was more than 10 years old. This represents a 4 percentage point increase in age from 2001.
New Zealand’s vehicle fleet is dominated by ageing, petrol-fuelled vehicles, although the share of diesel vehicles on the road has increased 3 per cent between 2001 and 2006. The number of diesel vehicles in the fleet increased by 39 per cent over the same period.
Vehicle ownership in New Zealand has more than tripled since the 1950s. In 2005, the number of vehicles per person was 0.7, the fifth highest rate of vehicle ownership among member countries of the Organisation for Economic Co-operation and Development.
Other modes
Shipping is an essential component of New Zealand’s transport system. In 2006, 99.5 per cent of New Zealand’s total export cargo (by weight) left from seaports. Transportation by ship can have a lower ‘carbon footprint’ than comparable air and road transport.
Air transport is another key component of New Zealand’s transport system. In 2005, more than 8.61 million passengers travelled to and from New Zealand by plane.
Present and future management
Increasingly, transport planners are recognising the impacts of transport on the environment. They are putting more effort into increasing the use of public transport, encouraging people to walk or cycle, designing our urban spaces to minimise the need for motorised forms of transport, and encouraging people to buy and use more fuel-efficient vehicles.
These issues will continue to remain a focus for transport planning. The need to reduce greenhouse gas emissions from transport – a major contributor to emissions – is likely to drive greater effort to improve fuel efficiency and increase the use of biofuels and alternative means of powering vehicles, such as electricity.
New Zealanders value their mobility. We rely on transport to access a range of work, educational, social, and recreational activities. Transport also underpins New Zealand’s economic prosperity by enabling the movement of people and goods, and by connecting New Zealand to international markets.
New Zealand has a well-developed transport system. It comprises nearly 91,000 kilometres of roads and highways, 4,000 kilometres of railway tracks, 13 major commercial seaports, 7 international airports, and several smaller provincial airports.
Road transport – the central element of our transport system
New Zealand roads carry over 39 billion vehicle kilometres of traffic every year. Road transport is the central element of New Zealand’s transport system, reflecting our small pockets of population, comparatively large land area, and high rates of vehicle ownership. This chapter therefore focuses primarily on road transport.
New Zealand has no vehicle manufacturing industry, so all our vehicles are imported, which makes us a ‘technology taker’ with respect to our vehicle fleet. Being a ‘technology taker’ means our vehicle fleet is greatly influenced by technological developments and standards in other countries. In 2005, 230,000 cars were imported, of which 152,000 (66 per cent) were used cars previously registered overseas and 78,000 (34 per cent) were new cars (Land Transport New Zealand, 2007).
Rail, sea, and air transport
Although New Zealanders rely mainly on motor vehicles to move from place to place, rail is used for freight and some passenger transport between towns and cities and within larger cities. New Zealand has a national rail network of about 4,000 kilometres, with comparatively well-developed urban networks in Wellington and Auckland.
Shipping is essential for transporting New Zealand’s export goods to overseas markets. In the year ended 30 June 2006, 21.7 million tonnes of export cargo, valued at $27,814 million, left from New Zealand’s seaports. The amount of cargo transported by sea equates to 99.5 per cent of total export cargo by weight and 84.3 per cent of total export cargo by value (Statistics New Zealand, 2006c).
Maritime transport is also responsible for a small number of passenger arrivals and departures. However, most passengers travel to and from New Zealand by air, with more than 8.61 million passengers travelling to and from New Zealand by plane in 2005.
Impacts of transport on the environment and human health
Road, rail, shipping, and air transport all have an impact on the environment, including noise, wastes such as end-of-life vehicles and used oil and tyres (see chapter 6, ‘Waste’), and contaminated run-off from roads to freshwater and marine ecosystems (see chapter 10, ‘Freshwater’ and chapter 11, ‘Oceans’).
Transport accounts for 86 per cent of New Zealand’s total oil consumption, with road transport making up 89 per cent of that amount. As a result, 18 per cent of New Zealand’s total greenhouse gas emissions come from transport, mostly from road transport (see chapter 8, ‘Atmosphere’).
Motorised transport can also affect human health. The combustion of fossil fuels produces fine airborne emissions (called particulates), which can damage people’s health if they penetrate the lungs. The ill-health effects of transport pollution include irritated eyes, throat, and lungs. For people with respiratory conditions, such as asthma or bronchitis, breathing in particulates can make the conditions worse. (See chapter 7, ‘Air’ for further information on the impacts on health of vehicle emissions.)
Particulates from transport are primarily produced by diesel vehicles, especially older diesel vehicles that have not been well maintained.
Walking and cycling are among the most sustainable forms of transport. They also have benefits for our health and fitness, allowing us to build exercise into our daily routine.
Government action on transport
New Zealand Transport Strategy
The New Zealand Transport Strategy is the Government’s strategic framework for achieving the vision that ‘by 2010 New Zealand will have an affordable, integrated, safe, responsive, and sustainable transport system’ (Minister of Transport, 2002).
National Walking and Cycling Strategy
In February 2005, the Government launched a national strategy to encourage walking and cycling, Getting There – On Foot, By Cycle (Minister of Transport, 2005). Funding for walking and cycling initiatives was also boosted at this time by $1.15 million.
Mandatory Vehicle Fuel Economy Labelling
In 2007, a Mandatory Vehicle Fuel Economy Labelling Scheme was approved for both new and used vehicles. The labelling scheme will apply at the point of sale for later model vehicles for which fuel economy information is available.
The label will have a comparative ‘star-rating’ similar to the energy efficiency label seen on whiteware appliances, allowing buyers to compare fuel economy ratings across vehicles. The label will also show the annual fuel cost for a typical driver. The labelling scheme will help increase the level of information to consumers regarding fuel economy and encourage the purchase of more fuel efficient vehicles. (Energy Efficiency and Conservation Authority, 2007)
Biofuels Sales Obligation
The Government has announced a Biofuels Sales Obligation, which requires companies that sell petrol or diesel in New Zealand to also sell biofuels. The amount of biofuels they will have to sell will be a percentage of their total combined petrol and diesel sales each year, measured in petajoules and based on the volumetric energy content of each fuel. The amount has been set at a minimum of 0.53 per cent for year 1 (2008) and will increase each subsequent year. By 2012, at least 3.4 per cent of all fuel that oil companies sell in New Zealand will have to be biofuels.
Fuel Saver website
The Fuel Saver website was launched in 2006. The website provides up-to-date information about the fuel efficiency of vehicles sold in New Zealand. This information lets consumers assess different vehicles on the basis of fuel consumption.
See chapter 1, ‘Environmental reporting’ for more information on the core national environmental indicators and how they are used.
Vehicle kilometres travelled
The national environmental indicator for transport provides information on vehicle kilometres travelled (VKT) by road.
The report on the indicator derives its data from measurements of the following:
- vehicle kilometres travelled by vehicle type (cars, light commercial vehicles, heavy commercial vehicles, and motorbikes)
- vehicle kilometres travelled by vehicle age
- vehicle kilometres travelled by fuel type (petrol or diesel).
The characteristics of our vehicles, such as age and type, and the distance we drive them determine the pressures on the environment. We use the ‘vehicle kilometres travelled’ indicator to identify changes in the composition and use of New Zealand’s vehicle fleet and to determine how these changes may be affecting the environment. Improving the vehicle fleet’s environmental performance is one way to reduce the pressures transport places on our environment.
Limitations of the indicator
The ‘vehicle kilometres travelled’ indicator only accounts for kilometres travelled by road vehicles. It excludes rail, sea, or air transport modes, which also have impacts on the environment.
The indicator does not take traffic congestion into account. Therefore, it is not possible to assess the proportion of vehicle kilometres travelled during peak traffic, when congestion leads to greater fuel consumption and exhaust emissions per kilometre travelled than during off-peak traffic.
The indicator does not take into account improvements over time in fuel quality or emissions reduction technology when it compares vehicle kilometres travelled year on year.
Other information
As the ‘vehicle kilometres travelled’ indicator accounts only for road transport, this chapter presents a wider picture of transport in New Zealand by using:
- vehicle ownership rates to show the average number of vehicles owned per person in New Zealand
- the 2006 Census of Population and Dwellings to show our use of motorised vehicles for travel to work, and the extent to which we use other modes of transport (for example, public transport, walking, and cycling)
- information on the average engine size of vehicles used on New Zealand roads
- records of international passenger arrivals and departures for all modes of transport
- information about public transport.
This section discusses the national environmental indicator for transport, vehicle kilometres travelled. The section also includes information about vehicle ownership, average engine size, how we travel to work, and international passenger arrivals to and departures from New Zealand.
Vehicle kilometres travelled by vehicle type
On average, New Zealanders drive much further today than in the past. Between 1980 and 2000, total annual vehicle kilometres travelled in New Zealand more than doubled, from 18.52 billion kilometres to 37.33 billion kilometres (see Figure 4.1). In part, this increase reflects the growth in the total number of vehicles on our roads. Kilometres travelled by cars, light commercial vehicles, heavy commercial vehicles, and buses all increased over this period, but kilometres travelled by motorbikes decreased.
As a result of changes in data collection methods in 2001, it is not possible to compare trends in total vehicle kilometres travelled before 2001 with those travelled after 2001. (Figure 4.1 represents this with a broken line.)
Data from 2006 shows that we travelled over 39.2 billion vehicle kilometres in that year. Between 2001 and 2006, the proportional ranking of each vehicle class has remained largely unchanged, with the car still being the largest contributor to kilometres travelled.
Between 2001 and 2005, total vehicle kilometres travelled increased for all vehicle types. In 2006, total vehicle kilometres travelled for all vehicle types decreased slightly from the previous year.
Figure 4.1: Trends in vehicle kilometres travelled (VKT) by vehicle type, 1980–2006
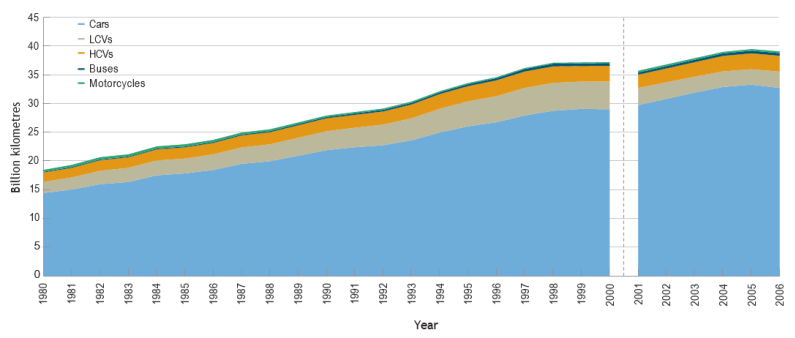
Image: Data source — Ministry of Economic Development, 2006a; Ministry of Transport.

Image: Data source — Ministry of Economic Development, 2006a; Ministry of Transport.
Vehicle kilometres travelled by vehicle age
On average, the vehicles on our roads are getting older. The age of vehicles has an effect on their fuel efficiency, and on how polluting they are.
In particular, the age of a vehicle indicates its overall efficiency and whether it is likely to have technology to control its exhaust emissions. Older vehicles are more likely to use fuel inefficiently (which increases greenhouse gas emissions), and to emit PM10 particulates and harmful gases that contribute to poor air quality. (See chapter 7, ‘Air’ for further information on the impact of vehicle emissions on air quality.)
The majority of vehicles on New Zealand roads are over 10 years old. This is partly because of the high number of used imports and our ageing fleet. In 2006, more than 61 per cent of New Zealand’s vehicle fleet was over 10 years old. This figure represents a 4 percentage point increase from 2001 when 57 per cent of New Zealand’s vehicle fleet was over 10 years old.
In 2006, the average age of New Zealand’s light vehicles (all private and commercial vehicles under 3.5 tonnes, excluding motorbikes) was 12.4 years. This is an increase from 2000 when the average age was 11.9 years (Ministry of Transport, 2007).
Figure 4.2 provides a snapshot of average vehicle kilometres travelled per vehicle in each age class in 2006, excluding vehicles that do not have to be licensed. The average vehicle kilometres travelled per vehicle decreased as the age of the vehicle increased; that is, we drive our newer vehicles further than we drive our older ones.
Vehicles in the age class 0–4 years, which make up 17 per cent of the fleet (just over 530,000 vehicles), contributed the highest average vehicle kilometres travelled (17,271 kilometres) per vehicle. This is partly because of the rapid turnover of vehicles in business and rental fleets. Vehicles in the age class 20 or more years contributed the lowest average kilometres (6,515 kilometres) of all vehicle classes.
Figure 4.2: Average vehicle kilometres travelled (VKT) per vehicle and total number of vehicles in each age class, 2006
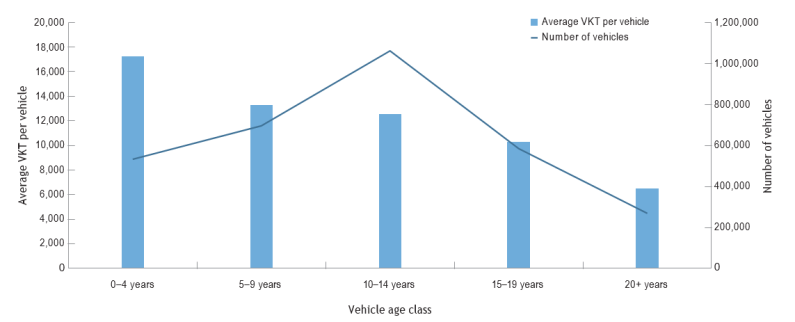
Image: Data source — Ministry of Transport.

Image: Data source — Ministry of Transport.
Vehicle kilometres travelled by fuel type
The vast majority (81 per cent) of vehicles on New Zealand roads are fuelled by petrol; the remaining 19 per cent are fuelled by diesel. As a result, petrol vehicles in New Zealand travel further in terms of total distance than diesel vehicles. In this discussion we exclude the small number of vehicles powered by alternatives such as biofuels and electricity.
In 2006, petrol vehicles in New Zealand travelled just over 29.34 billion kilometres, while diesel vehicles travelled about 9.86 million kilometres (see Figure 4.3). However, on average, each diesel vehicle travels further in a year than each petrol vehicle (15,300 kilometres per vehicle compared with 10,500 kilometres per vehicle).
Petrol vehicles contributed the majority of the kilometres travelled in New Zealand between 2001 and 2006. The share of kilometres travelled by diesel vehicles increased slightly from 22 per cent to 25 per cent of total vehicle kilometres travelled during the same period (probably because the number of diesel vehicles in the fleet increased 39 per cent over that period). The percentage share of diesel vehicles in the fleet, relative to petrol vehicles, also increased from 15 per cent to 18 per cent between 2001 and 2006.
The increase in diesel vehicle kilometres travelled has negative implications for our health. Diesel vehicles have a greater impact on air quality than petrol vehicles, because they produce about 73 per cent of all particulate emissions from transport (Auckland Regional Council, 2006). In addition, they produce more sulphur dioxide emissions than petrol vehicles (see chapter 7, ‘Air’).
Figure 4.3: Vehicle kilometres travelled (VKT) by fuel type, 2001–2006
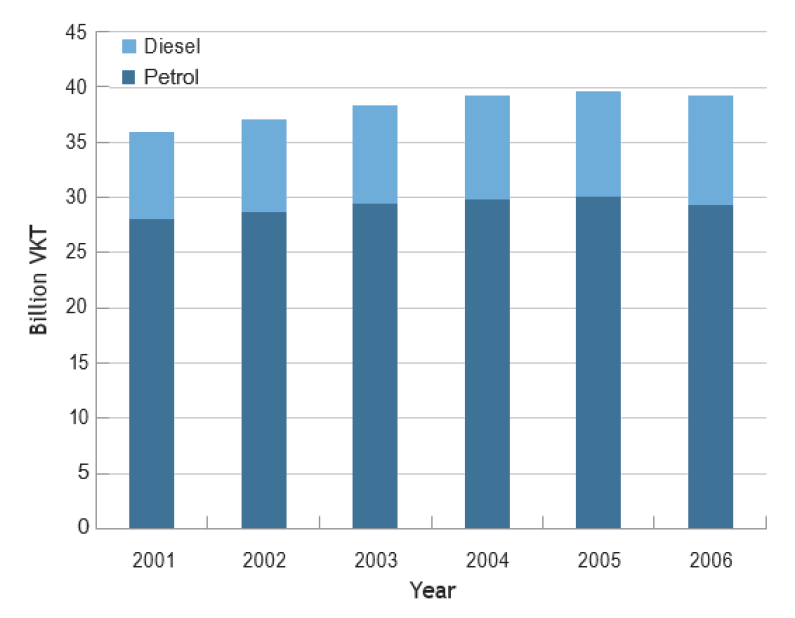
Image: Data source — Ministry of Transport.
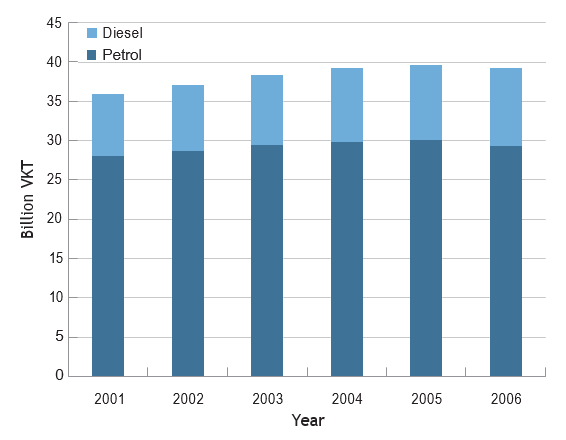
Image: Data source — Ministry of Transport.
Vehicle ownership in New Zealand
Since the 1950s, New Zealanders have become increasingly reliant on road transport. Vehicle ownership records in New Zealand show that the number of vehicles per person more than tripled from the 1950s to 2005 (the most recent year for which we have data).
In 2005, New Zealanders owned an average of 0.7 vehicles each, or 70 vehicles per 100 people. As a result, we have the fifth highest rate of vehicle ownership of member countries of the Organisation for Economic Co-operation and Development (Organisation for Economic Co-Operation and Development, 2007).
The number of vehicles per person in New Zealand has increased steadily over time since the 1950s, although growth has remained relatively static for brief periods (for example, during the 1990s). (See Figure 4.4.)
Figure 4.4: Vehicle ownership per person in New Zealand, 1950–2005
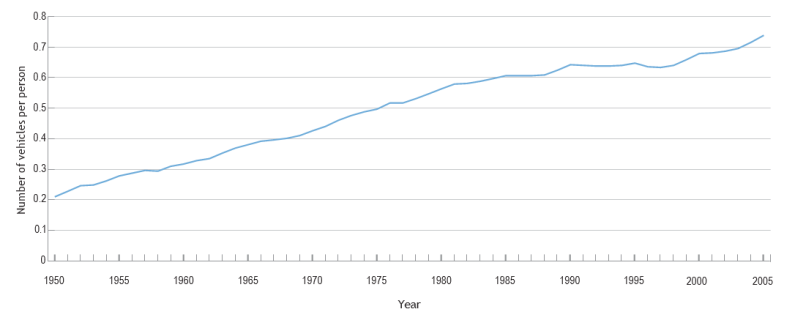
Image: Data source — Ministry of Transport, 2005.

Image: Data source — Ministry of Transport, 2005.
In 1996, the Census of Populations and Dwellings found that 45 per cent of New Zealand households had access to two or more vehicles (Statistics New Zealand, 1996). A decade on, the proportion of New Zealand households with access to two or more vehicles had risen to 54 per cent (Statistics New Zealand, 2006b).
Vehicle and engine size
The number of vehicles in New Zealand is increasing and, at the same time, engine sizes are increasing. In 2006, the average engine size of a vehicle in New Zealand was more than 2.2 litres. This has increased from just over 2 litres in 2000. (See Figure 4.5.)
The size of the engines in the vehicles we drive determines the amount of fuel the vehicles consume – smaller engines generally consume less fuel. Increased overall fuel consumption has an impact on exhaust emissions – an increase in fuel consumption usually results in an increase in greenhouse gas and particulate emissions.
The size of the vehicles we drive usually also determines the engine size – the larger the vehicle, the heavier it is, and the larger the engine required to power it. Recent years have seen a trend in consumers buying larger and heavier vehicles. The popularity of sport utility vehicles (SUVs) is one example of this trend. Registrations of SUVs increased from 26 per cent of the relevant vehicle class in January 2003 to 81 per cent in June 2006 (Land Transport New Zealand, no date).
Figure 4.5: Average engine size of the light vehicle fleet, 2000–2006

Image: Data source — Ministry of Transport, 2007.
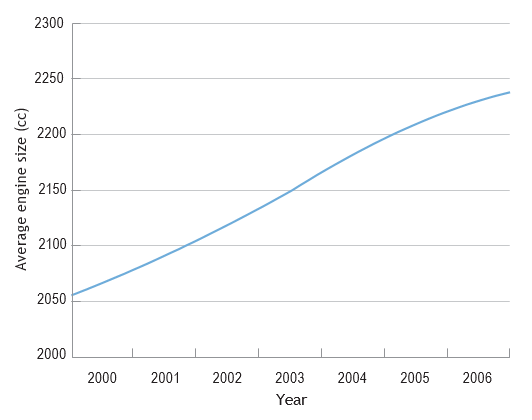
Image: Data source — Ministry of Transport, 2007.
Travelling to work
The way New Zealanders travel to work illustrates our dependence on motorised vehicles and the extent to which we use other means of transport.
Figure 4.6 presents data on how New Zealanders aged 15 years and over engaged in full-time employment travelled to work on census day (7 March) in 2006. On this day, 76 per cent of people travelled to work, as a driver or passenger, by motor vehicle (car, truck, van, motorcycle, or power cycle); 5 per cent travelled by public transport (bus or train); and 9 per cent walked, jogged, or cycled. Of those surveyed, 10 per cent worked from home and did not travel to work.
Figure 4.6: Means of travel to work on census day, 7 March 2006

Image: Data source — Statistics New Zealand, 2006a.
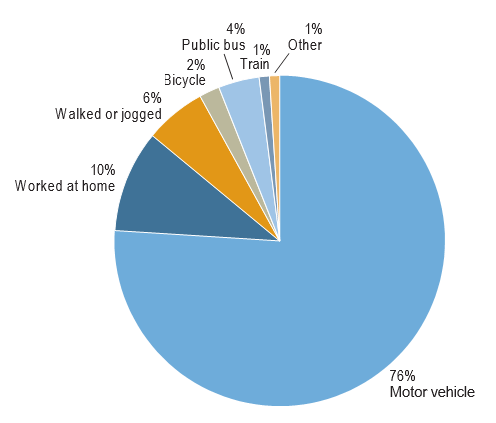
Image: Data source — Statistics New Zealand, 2006a.
More about public transport in New Zealand
Public transport generally provides a lower-cost and more environmentally friendly transport choice than using a private car. It also provides mobility for those who cannot or do not want to drive a car.
Public transport offers benefits to the environment in the form of less air pollution, lower fuel consumption, and less traffic congestion compared with private transport.
Public transport systems in New Zealand tend to be better developed in the main centres (Auckland, Wellington, Christchurch, and Dunedin) than in smaller centres. Public transport systems rely on being well used to remain a cost-effective alternative to private vehicles, so they need a large population base. Reliability, convenience, safety, cost, and frequency of public transport services determine how likely people are to use the services.
Public transport use is generally low in New Zealand compared with other modes of transport, but the number of people using public transport is growing. Between 1999 and 2006, the number of people who boarded bus, rail, and ferry services increased 68 per cent in Christchurch, 43 per cent in Auckland, and 23 per cent in Wellington. The number of people who used bus, rail, and ferry services increased across the country by 45 per cent. This increase in public transport replaced an estimated 49 million car trips (Ministry of Economic Development, 2006b).
Investment in public transport has also increased. In the 2006/2007 financial year, the Government committed $301 million to fund public transport and buy back the nation’s rail tracks. The 2006/2007 financial year National Land Transport Programme allocated $136 million to passenger transport community services and almost $160 million to passenger transport infrastructure.
Government funding for passenger transport services increased 16 per cent between the 2005/2006 financial year and the 2006/2007 financial year. In addition, the Government committed $600 million over four years to upgrade the Auckland rail network.
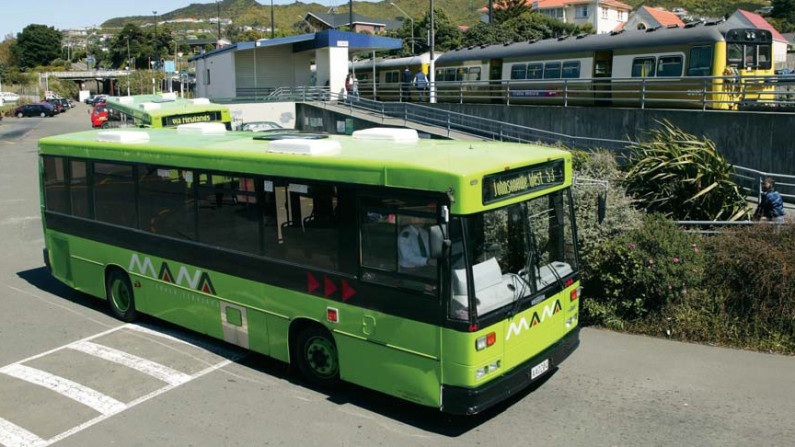
Image: Ministry for the Environment.
International arrivals and departures
New Zealand’s location in the Pacific Ocean means we rely on air and sea transport for imports and exports. Tourism, which contributes to our foreign exchange earnings, also relies heavily on air transport, with a small proportion of tourists arriving by sea.
However, until international jet services were introduced in the 1960s, most people travelled by sea, with two-thirds of all passengers travelling to or from New Zealand by sea in 1950 (Statistics New Zealand, 2006d).
Since the 1960s, the number of international passenger arrivals to and departures from New Zealand by all modes of transport has continued to increase. In 2005, 8.69 million passengers travelled to or departed from New Zealand by sea or air, with the vast majority (8.61 million or 99 per cent) travelling by air. This is an 83 per cent increase from 1995. (See Figure 4.7.)
The rise in international arrivals and departures can be attributed to international travel becoming more affordable and more accessible. In 2005, more than 60,000 flights arrived at and departed from New Zealand’s seven international airports.
Figure 4.7: Total international passenger arrivals to and departures from New Zealand, 1955–2005
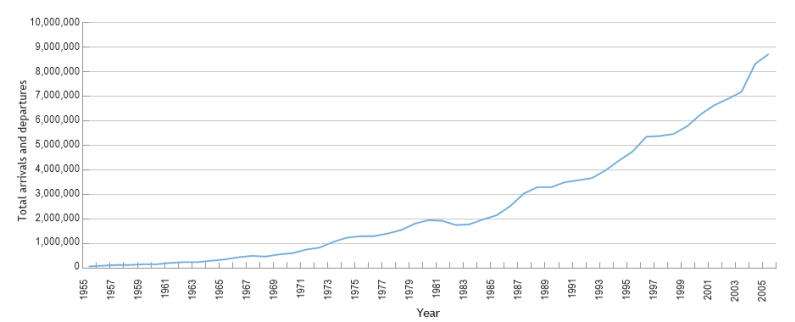
Image: Data source — Statistics New Zealand, 2006d.
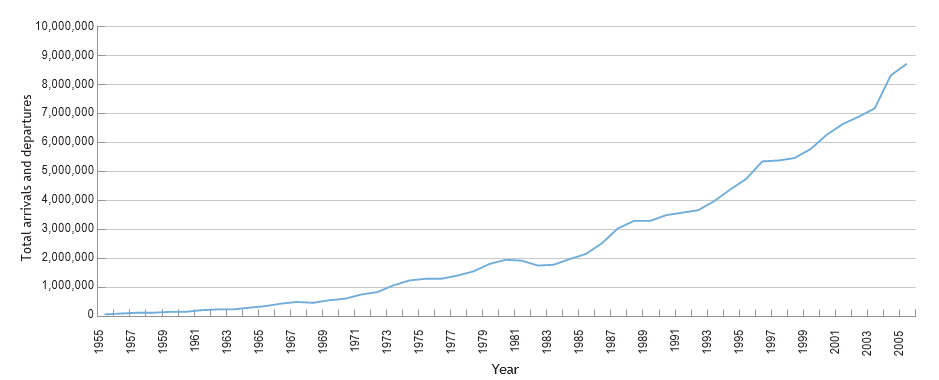
Image: Data source — Statistics New Zealand, 2006d.
Local action on sustainable transport
Walking school buses
Walking school buses have been established in communities throughout New Zealand to give children a safe and sustainable way to travel to school and back. Groups of families form a roster to take turns walking the families’ children to school. A walking school bus usually comprises several families, with one parent ‘driving’ up to eight children, either from the ‘driver’s’ house or by ‘picking up’ children on the way to school (Land Transport New Zealand, 2006).
Cycle Safe Christchurch
Cycle Safe Christchurch is a cycle safety education programme targeting year 6 pupils in Christchurch primary schools.
Land Transport New Zealand and the Christchurch City Council fund the programme.
The programme aims to enable children to cycle more safely to and from school by increasing their competency and confidence levels, and to encourage parents to let their children cycle (Christchurch City Council, no date).
‘Park and ride’ bus stations
Poor accessibility to public transport can inhibit people’s use of public transport. To help overcome this, two ‘park and ride’ bus stations have been created in Auckland. People who commute by bus from North Shore City to Auckland City can drive to the ‘park and ride’ bus stations at Constellation and Albany, park their cars, and board an express bus to Auckland City. Parking is free, so people have an incentive to leave their car at the bus stop and take the bus, instead of driving across the Auckland Harbour Bridge and adding to traffic congestion (North Shore City Council, no date).
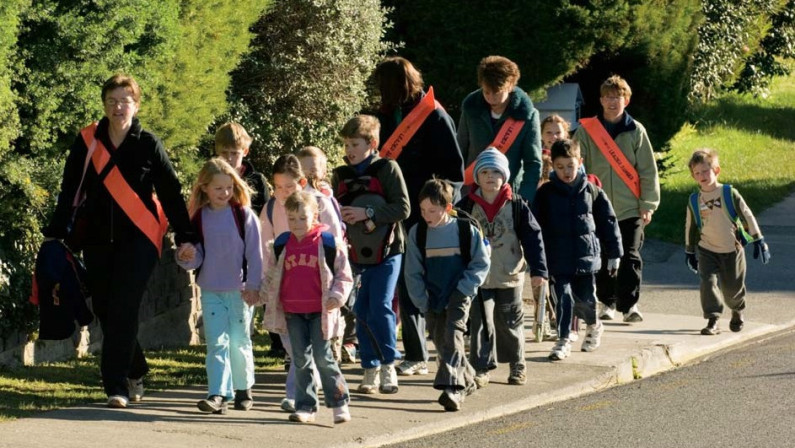
Image: Courtesy of Land Transport New Zealand.
The 1997 report, The State of New Zealand’s Environment 1997, concluded that:
Limited air and stormwater studies show that at times, carbon monoxide levels in some urban traffic corridors exceed the New Zealand Ambient Air Guidelines, and transport is also responsible for some of the extensive heavy metal contamination of some harbours and estuarine areas. Transport also contributes 40 percent of New Zealand’s CO2 emissions. …
Apart from banning lead in petrol, systematic measures do not currently exist to deal with the environmental impacts of transport services. The Vehicle Fleet Emissions Control Strategy is investigating appropriate measures to control transport noise and emissions to air and water.
Since the 1997 report, transportation in New Zealand has remained heavily weighted towards road transport, although other modes of transport (rail, sea, and air) also move people and goods.
Rate of car ownership
The average New Zealander owns 0.7 vehicles, the fifth highest rate of vehicle ownership among OECD countries. This increase reflects the increasing affordability of vehicles since 1997. The removal of import tariffs in 1998 made it cheaper to import cars, and led to a boom in the sale of imported used vehicles in New Zealand, along with a corresponding decline in the sale of new vehicles (Statistics New Zealand, 1998).
The increasing affordability of vehicles has meant half of all New Zealand households now own more than one vehicle. The 2003–2004 Household Travel Survey found that the average number of vehicles per household had increased by nearly 13 per cent (from 1.6 to 1.8 vehicles per household) since the 1997–1998 survey (Ministry of Transport, 2004).
Average age of used imported vehicles
In 2006, the average age of a used imported vehicle entering New Zealand was 8.2 years (Ministry of Transport, 2007).
The high number of used vehicles entering the country has contributed to the increasing age of New Zealand’s vehicle fleet: in 2006, the average age of light vehicles in the New Zealand fleet was 12.4 years, up from 11.9 years in 2000.
Vehicle engine size
Reflecting global trends, the size of our vehicles has increased since 1997, with the average engine size of vehicles in the light fleet now more than 2.2 litres, having increased from just over 2.0 litres in 2000. This change partly reflects the fact that New Zealand is a ‘technology taker’, which means we have to import our vehicles. It also reflects lower vehicle prices. As the average price of vehicles has fallen, we have been able to afford to buy larger vehicles.
Vehicle kilometres travelled
Also reflecting global trends, on average, we are driving our vehicles much further today than we did in the past. Between 1980 and 2000, total annual vehicle kilometres travelled in New Zealand more than doubled. In part, this increase reflects the growing number of vehicles on our roads. It also reflects our increasing mobility as our lifestyles change.
Technological changes
The trends discussed above often have a negative effect on the environment and human health. Since 1997, we have learnt much more about these effects and the extent of air pollution in New Zealand caused by vehicle emissions.
In the past 10 years there have been some improvements. New vehicles are less polluting of the air than they were 10 years ago, because engine technologies have improved in response to more stringent health and environmental standards. New engine technologies have also improved vehicle fuel economy over the past 10 years. However, some of these gains have been offset by consumers choosing larger and more powerful vehicles.
Technology to control exhaust emissions has developed significantly in recent years. New Zealand introduced vehicle exhaust emissions regulations in 2003 (requiring all vehicles to be built to recognised emissions standards) and 2006 (requiring a visible exhaust smoke test at the warrant of fitness or certificate of fitness check).
The quality of the fuels we use in New Zealand, and the impact these have on air pollution, has also improved since 1997. The sulphur content of diesel fuel has been significantly reduced. Since 2001, the sulphur content of diesel fuel has been reduced 60-fold, with further reductions expected by 2009. Reducing the sulphur content of diesel ensures the fuel is suitable for use in the newer, low-emission diesel vehicles New Zealand is importing.
We are continuing to experience changes in the fuels we use in our vehicles, with the uptake of biofuels (renewable transport fuels) and an increasing number of hybrid vehicles on our roads.
Encouraging the use of biofuels is expected to bring several benefits for our environment and health. Biofuels have already shown their potential to reduce greenhouse gas and particulate emissions and to reduce New Zealand’s dependence on imported transport fuels.
International pressures to reduce greenhouse gas emissions from transport are likely to encourage efforts in New Zealand and other countries to improve fuel efficiency and increase the use of biofuels. As an importer of vehicles and transport fuels, New Zealand will reap health and environmental benefits from improved fuel efficiency and greater use of biofuels.
Transport planning
Since 1997, transport planning has increasingly recognised the impact of transport on the environment. Greater effort has been put into encouraging the use of public transport, walking, and cycling; designing urban spaces to minimise the need for motorised forms of transport; and encouraging the use of more fuel-efficient vehicles.
Reducing New Zealand’s greenhouse gas emissions from the transport sector will continue to be a challenge. In part, the challenge arises from the scale of the issue; transport is one of our major contributors to emissions. Given the average, and increasing, age of the vehicles we import, it may be some time before we see the results of global action to reduce emissions in our vehicle fleet.
These issues will continue to remain a focus for transport planners into the future. In addition, New Zealand is likely to be able to capitalise on international and onshore opportunities for developing and using biofuels and other alternative transport fuels, for example, using electricity to power cars.
Auckland Regional Council. 2006. Auckland Air Emissions Inventory: 2004. Auckland: Auckland Regional Council.
Christchurch City Council. No date. Christchurch city cycling: Cycle Safely. Retrieved from http://www.ccc.govt.nz/Recreation/Cycling/CycleSafely/ (4 May 2007).
Land Transport New Zealand. 2006. The Walking School Bus Coordinator’s Guide. Wellington: Land Transport New Zealand.
Land Transport New Zealand. 2007. New Zealand Motor Vehicle Registration Statistics 2006. Palmerston North: Land Transport New Zealand.
Land Transport New Zealand. No date. New Zealand Motor Vehicle Register, unpublished. Wellington: Land Transport New Zealand.
Energy Efficiency and Conservation Authority, 2007. Vehicle Fuel Economy Labelling. Retrieved from: http://www.eeca.govt.nz/eeca-library/transport/fact-sheet/vehicle-fuel-economy-fact-sheet-07.pdf (11 September 2007).
Ministry for the Environment. 1997. The State of New Zealand’s Environment 1997. Wellington: Ministry for the Environment and GP Publications.
Ministry of Economic Development. 2006a. New Zealand’sEnergy Outlook to 2030. Wellington: Ministry of Economic Development.
Ministry of Economic Development. 2006b. Powering Our Future: Towards a sustainable low emissions energy system – Draft New Zealand Energy Strategy to 2050. Wellington: Ministry for Economic Development.
Minister of Transport. 2002. New Zealand Transport Strategy. Wellington: Ministry of Transport.
Minister of Transport. 2005. Getting There – On Foot, By Cycle: A strategy to advance walking and cycling in New Zealand transport. Wellington: Ministry of Transport.
Ministry of Transport. 2004. Preliminary Results of Household Travel Survey 2003–2004. Retrieved from http://www.transport.govt.nz/assets/NewPDFs/Travel-Survey-Year12-prelimary-results-for-release.pdf (20 April 2007).
Ministry of Transport. 2005. Motor Vehicle Crashes in New Zealand. Wellington: Ministry of Transport.
Ministry of Transport. 2007. The New Zealand light vehicle fleet, unpublished. Wellington: Ministry of Transport.
North Shore City Council. No date. Transport and Roads. Retrieved from http://www.nscc.govt.nz/transport_and_roads/Public-transport/Northern-Busway.htm (7 May 2007).
Organisation for Economic Co-operation and Development. 2007. OECD Factbook 2007: Economic, environmental and social statistics. Paris: OECD Publishing.
Statistics New Zealand, 1996. More Census 96 Counts (1996 Census of Populations and Dwellings). Retrieved from http://www.stats.govt.nz/tables/more-census-96-counts.htm (18 July 2007).
Statistics New Zealand. 1998. Business Activity Statistics: Part 4: Motor vehicle industry 1998. Retrieved from http://www.stats.govt.nz/analytical-reports/business-activity-1998/bus-a... (16 April 2007).
Statistics New Zealand. 2006a. Main Means of Travel to Work. Retrieved from http://www.stats.govt.nz/census/2006-census-data/classification-counts/a... (1 May 2007).
Statistics New Zealand, 2006b. Number of Motor Vehicles. Retrieved from http://www.stats.govt.nz/NR/rdonlyres/5E05E6A7-808D-4F1B-AE47-E18E49D73C... (22 June 2007).
Statistics New Zealand. 2006c. Overseas Cargo Statistics. Retrieved from http://www.stats.govt.nz/products-and-services/hot-off-the-press/oversea... (1 May 2007).
Statistics New Zealand. 2006d. Tourism and Migration 2005. Retrieved from http://www.stats.govt.nz/tables/tourism-migration-2005.htm (2 May 2007).
Chapter 4: Transport
December 2007
© Ministry for the Environment