Purpose of environmental reporting
People who make decisions about the environment need accurate and reliable environmental information. State of the environment reporting can provide this. It also helps us to know whether policy initiatives or environmental management approaches are effective over time.
Environmental indicators
We cannot continuously measure every aspect of our environment, so environmental reporting relies on using a range of ‘indicators’ to assess the overall state of the environment in a practical, cost-effective, and meaningful way.
In the same way that gross domestic product is an indicator of economic activity, each environmental indicator allows us to measure and report on a specific aspect of the state of our environment.
Ecological classification systems
Ecological classification systems can be used alongside environmental indicators to group and extrapolate data across geographical areas that are environmentally similar. Data from a limited number of monitored sites can then be used to build a national picture of the state of the environment.
Creating a national picture
This report uses a set of core national environmental indicators and ecological classification systems to present a national picture of key aspects of the New Zealand environment.
This national picture will highlight for decision-makers and environmental managers the aspects of our environment that have come under particular pressure and require priority attention.
People who make decisions about the environment need accurate and reliable environmental information. With this information, they can make informed decisions about natural resource management and set environmental policy. Environmental reporting also helps us know whether policy initiatives or environmental management approaches are effective over time.
We cannot continuously measure every aspect of the environment. In the same way that gross domestic product is used as an indicator of economic activity, an environmental indicator provides information on a specific aspect of our environment.
Environmental reporting relies on using a range of indicators to measure and report on the overall health of our environment in a cost-effective, practical, and meaningful way.
State of the environment reporting is widely used as an environmental management tool (Department of the Environment and Heritage, 2006). It uses environmental indicators to draw together scientific knowledge, information, and data to track:
- environmental trends
- activities that have an impact on the environment
- the effectiveness of environmental policies and management actions.
In New Zealand, environmental reporting happens at the national level (for example, in reports such as this one) and at regional and local levels.
Many different organisations and groups are involved in developing environmental indicators, collecting data against the indicators, and reporting on what the data shows.
This section gives details of some of the environmental reporting that occurs in New Zealand, and who is involved.
National reporting
The 1997 report, The State of New Zealand’s Environment 1997, concluded:
New Zealand’s environmental information needs considerable upgrading if the state of the nation’s environment is to be accurately described and trends detected.
In response, the Ministry for the Environment developed a national environmental reporting programme to report regularly on New Zealand’s key environmental issues.
As a result, a number of reports on the New Zealand environment have been produced over the last decade. These have primarily focused on particular pressures on the environment (for example, waste flows or greenhouse gas emissions) or specific aspects of the environment (for example, water quality or air quality), for which data is available across the whole country.
To give greater momentum to environmental reporting, the Ministry for the Environment defined a new set of core national environmental indicators in 2007. These indicators underpin the Ministry’s new national environmental reporting programme, and will be used to support regular and ongoing national-level reporting on the state of key aspects of New Zealand’s environment.
Many of the selected indicators link directly to aspects of the environment that are measured by other agencies in New Zealand (for example, local government).
This report introduces the set of national environmental indicators and uses them to present a national picture of the New Zealand environment.
Regional monitoring
Local government undertakes a wide range of environmental monitoring at the regional level to meet its obligations relating to the environment. Under section 35(2)(a) of the Resource Management Act 1991, local authorities must monitor ‘[t]he state of the whole or any part of the environment of its region or district to the extent that is appropriate to enable the local authority to effectively carry out its functions under this Act’.
Local government uses environmental monitoring to improve its understanding of the state of the environment for which it is responsible, and to make informed and appropriate management decisions about it. Monitoring also allows local government to determine whether management approaches have been effective, and whether new approaches to emerging environmental issues are needed.
The scope of environmental monitoring differs around the country. For example, Auckland Regional Council has an extensive marine sediment monitoring programme. This reflects the pressures on the Auckland marine environment from stormwater run-off, coastal construction and excavation activity, and intensive urban development.
Different types of monitoring may be needed in regions facing other pressures. Councils in rural areas that are intensively farmed would be expected to focus their monitoring efforts on freshwater quality and quantity, the health of aquatic ecosystems, soil quality and erosion, and sustainable land management.
Regional reporting
Regional-level state of the environment reporting is not a legislative requirement. Councils must simply compile and make available to the public a review of the results of their monitoring at least every five years. The review is then used to assess the effectiveness of the policies, rules, or other methods in the council’s policy statement or plan.
Most councils in New Zealand use their monitoring results to produce comprehensive state of the environment reports for their district or region every few years. Increasingly, these have become more targeted reports that use selected indicators to monitor specific aspects of the environment (for example, biodiversity or the coastal environment).
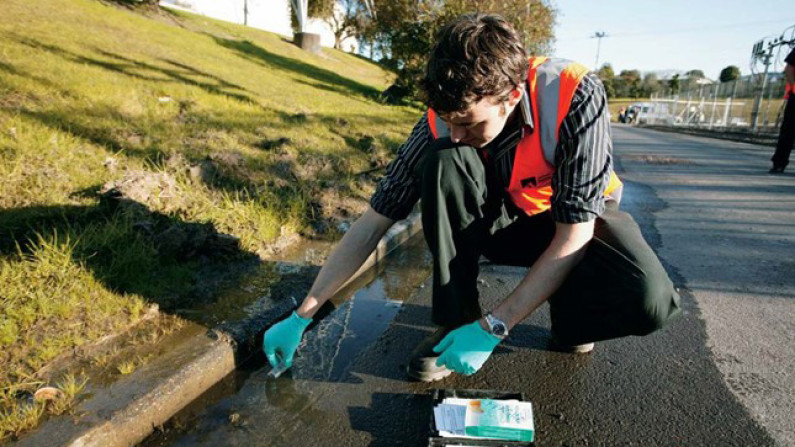
Image: Ministry for the Environment.
Some councils (such as Environment Southland) produce summary ‘report cards’ that give a snapshot of the state of the environment in their region over the last monitoring period. These easy-to-read summaries provide a succinct picture of the quality of a particular dimension of the environment (for example, local air quality).
Local monitoring and reporting
Right across New Zealand, iwi, hapū, and community groups are involved in projects to monitor, protect, and enhance the health of their local environment. Local monitoring and reporting play an important role in environmental management: careful tracking of local environments can identify emerging pressures and ensure measures are put in place to manage them at an early stage.
Monitoring and reporting by local groups may be specific to a project with which they are involved, or may feed into more formal reporting networks. For example, community-based river care and restoration groups may gather information on the state of specific parts of the local environment, which in turn contributes to formal state of the environment reporting by councils.
One example of local monitoring is community-group participation in annual monitoring of shellfish at several locations in the Hauraki Gulf. With support from territorial authorities, Auckland Regional Council and the Department of Conservation, schools and community groups collect information on shellfish type, size, and distribution. The results are reported to both the community and the Ministry of Fisheries, and are used to inform the Hauraki Gulf State of the Environment Report.
A further example is research into tuna (eel) stocks in the Ngāti Raukawa area, which extends from Bulls to Ōtaki. Monitoring was conducted by Te Wānanga-o-Raukawa and involved a number of hapū. The project aimed to develop a tuna management plan by recording oral narratives about historic tuna levels and collecting present-day data about tuna in the area.
Takiwā – a culturally-based environmental monitoring system
Takiwā is a culturally-based environmental monitoring and reporting tool that incorporates both traditional and science-based knowledge and methods. Te Rūnanga o Ngāi Tahu worked with Papatipu Rūnanga, regional councils, and a number of Crown Research Institutes to develop Takiwā, with funding from the Ministry for the Environment.
The monitoring tool uses a specially designed database and a series of associated monitoring forms. Together, these allow for data from selected sites to be gathered, stored, analysed, and reported on in terms of the values Māori associate with the environment – in particular, the concept of mahinga kai, or customary food and resource gathering.
Currently, the system has a particular focus on freshwater monitoring, drawing on the Cultural Health Index (see box ‘More about iwi monitoring of freshwater: Cultural Health Index’ in chapter 10, ‘Freshwater’). Plans are under way to develop and include specific cultural assessment tools for coastal, estuarine, and lake sites.
To date, Takiwā has been used to assess more than 100 sites within 11 catchments in Canterbury, Ōtago, and Southland, including sites of traditional importance and those within coastal, headwater, plains, and urban areas. Results from this monitoring will be used to develop a report on the quality of waterways in the South Island.
Takiwā monitoring has also been used to complement regional council monitoring of waterways, as well as to monitor the conditions of resource consents affecting sites of cultural significance, such as Te Waihora/Lake Ellesmere.
This monitoring aims to identify the current health of catchments both as a baseline for future monitoring and restoration work, and to report the extent of change within these areas. It does so by allocating a ‘score’ to each site, based on factors such as pressures on the site, its suitability for harvesting mahinga kai, ease of access to the site, its degree of modification, and whether valued and pest species are present. Other natural resources, such as particular types of stone (for example, pounamu/greenstone or hāngi stones), are also identified.
Where appropriate, Takiwā site assessments are complemented by the Cultural Health Index and other assessment methods.
Because Takiwā monitoring focuses on whether the environment is healthy enough to allow food and resources to be gathered, it plays an important role in building a more complete picture of overall environmental health. This is because conventional monitoring may focus only on either ecological or recreational requirements. For example, an assessment of the quality of water for swimming does not identify whether it is safe to gather mahinga kai or drink the water. Moreover, the presence at a site of a particular species, such as tuna (eels), does not mean the species is abundant or healthy enough to harvest.
Through its ongoing use and development of Takiwā, Te Rūnanga o Ngāi Tahu hopes culturally-based indicators will become a regular part of future environmental monitoring and reporting.
Many countries have defined their own environmental indicators, as have international bodies such as the Organisation for Economic Co-operation and Development (OECD) and the European Environment Agency (EEA).
As noted earlier, environmental indicators are used to provide an estimate of the overall state of the environment by:
- reporting on specific aspects of the environment
- tracking trends in these aspects over time.
As an example, air quality in managed airsheds is one of the core national environmental indicators used to report on the state of New Zealand’s environment (see the section ‘Core national environmental indicators’ on the following page).
The air quality in managed airsheds is assessed by measuring and reporting on several aspects of air quality. These aspects are known as ‘variables’. The variables used to assess air quality in managed airsheds are the maximum concentrations and annual averages of PM10 particulate matter, carbon monoxide, nitrogen dioxide, sulphur dioxide, and ground-level ozone.
The value of an indicator lies in its ability to show whether measured aspects of the environment are improving or getting worse over time. Indicators can be used to trigger appropriate and timely action to address environmental problems.
Core national environmental indicators
Table 1.1 lists the set of core national environmental indicators used in this report.
The indicators have been chosen to provide the key information needed for national environmental policy-making and natural resource management in New Zealand. They were also selected for their ability to provide the best representation of the information that is currently available on high-priority issues for the environment. They form a representative sample of indicators, which can be added to over time as more national-level data becomes available.
The indicators were distilled from a wider set of 160 indicators, which were developed by the Ministry for the Environment and used in its earlier Environmental Performance Indicators Programme (Ministry for the Environment, 2006).
As Table 1.1 shows, many agencies collect and share the environmental data used to report against the core national environmental indicators. These agencies include central and local government agencies, non-government organisations, and Crown Research Institutes.
Table 1.1: National environmental indicators used in this report
| National environmental indicator | Reporting partner | Relevant chapter of this report |
|---|---|---|
|
Household consumption |
StatsNZ |
Household consumption |
|
Vehicle kilometres travelled (VKT) by road |
MoT |
Transport |
|
Energy supply and consumption |
MED |
Energy |
|
Solid waste disposed of to landfill |
Regional councils, territorial authorities |
Waste |
|
Air quality in managed airsheds |
Regional councils |
Air |
|
Emissions and removals of greenhouse gases |
MED, MoT |
Atmosphere |
|
Stratospheric ozone levels |
NIWA |
Atmosphere |
|
Land cover |
DOC, MAF, regional councils |
Land |
|
Land use |
DOC, MAF, regional councils |
Land |
|
Soil health |
Regional councils, MAF, CRIs |
Land |
|
Soil intactness of erosion-prone hill country |
Regional councils, MAF, CRIs |
Land |
|
Water quality in rivers, lakes, and groundwater aquifers |
Regional councils, NIWA |
Freshwater |
|
Freshwater demand |
Regional councils |
Freshwater |
|
Fish stocks under the quota management system |
MFish |
Oceans |
|
Seabed trawling in deep waters |
MFish |
Oceans |
|
Water quality at coastal swimming spots |
Regional councils, territorial authorities |
Oceans |
|
Marine areas with legal protection |
DOC, MFish |
Oceans |
|
Land area with native vegetation, including area under legal protection |
DOC, QEII, regional councils, territorial authorities |
Biodiversity |
|
Distribution of selected native plants and animals |
DOC, OSNZ |
Biodiversity |
Note: CRIs = Crown Research Institutes; DOC = Department of Conservation; MAF = Ministry of Agriculture and Forestry; MED = Ministry of Economic Development; MFish = Ministry of Fisheries; MoT = Ministry of Transport; NIWA = National Institute of Water and Atmospheric Research; OSNZ = Ornithological Society of New Zealand; QEII = Queen Elizabeth the Second National Trust; StatsNZ = Statistics New Zealand.
Source: Ministry for the Environment.
The DPSIR model
To help decision-makers use the information from the core environmental indicators in a meaningful way, indicators are often developed within a particular framework or model. The model is used to highlight what type of information the indicator is trying to show and how this information can best be used.
The Ministry for the Environment has developed the framework for the core set of national environmental indicators from two well-tested analytical models:
- the Driving force–Pressure–State–Impact–Response (DPSIR) model, which was developed from the OECD’s Pressure–State–Response model
- the typology of indicators developed by the European Environment Agency (European Environment Agency, 1999; 2003; 2005).
The DPSIR model (see Figure 1.1) shows how human activity (also known as a driver or driving force) exerts pressure on the environment and, as a result, changes the state of the environment. The state of the environment can have impacts on people’s health, ecosystems, and natural resources. These impacts can result in responses in the form of management approaches, policies, or actions that alter the driving forces, pressures, and, ultimately, the state of the environment. Changes in impacts over time can result in people modifying their response to those impacts (European Environment Agency, 2003).
Figure 1.1: DPSIR model
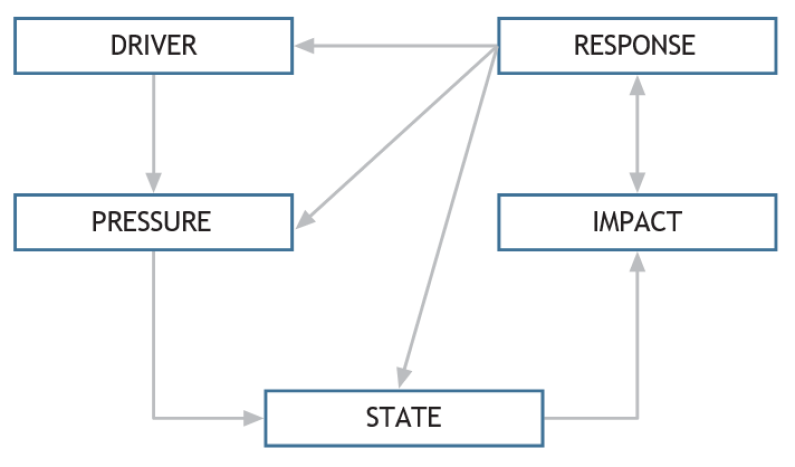
Image: Source — adapted from Smeets and Weterings, 1999.
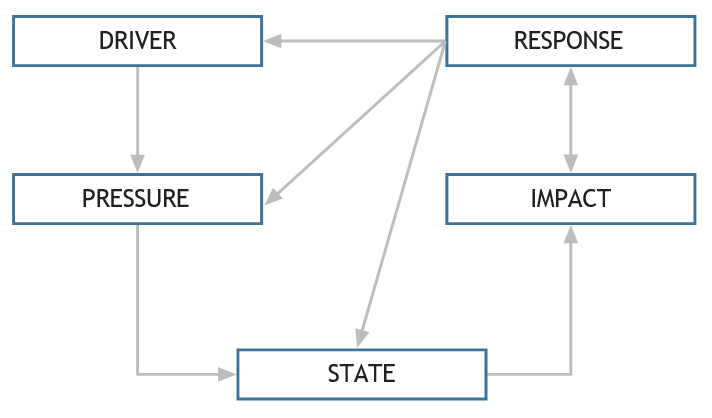
Image: Source — adapted from Smeets and Weterings, 1999.
An environmental indicator developed under the DPSIR model can be categorised as a ‘driving force’, ‘pressure’, ‘state’, ‘impact’, or ‘response’ indicator, according to the type of information it provides. For example, the indicator for the emissions and removals of greenhouse gases is a pressure indicator, because increasing greenhouse gas emissions put pressure on the atmosphere and change the climate. The indicator for national water quality tracks the quality or condition of waterways, so it is a state indicator.
Table 1.2 explains DPSIR indicators in more detail.
Table 1.2: Description of DPSIR indicators
| Indicator type | Description of indicator type |
|---|---|
|
Driving force (driver) |
Describes social, demographic, and economic developments. Primary driving forces are population growth and changes in people’s needs and activities. These change lifestyles and overall levels of production and consumption, which in turn exert pressures on the environment. |
|
Pressure |
Tracks people’s use of natural resources and land, and production of waste and emissions (for example, greenhouse gases and particulates into the air). These pressures can change environmental conditions. |
|
State |
Describes the quantity and quality of the environment and natural resources (for example, water quality, air quality, or land cover). |
|
Impact |
Describes the effects that environmental changes have on environmental or human health (for example, the level of human illness related to exposure to air pollution). |
|
Response |
Describes responses by government, organisations, or the community to prevent, compensate, ameliorate, or adapt to changes in the environment (for example, the introduction of regulations such as national environmental standards and legislative initiatives to protect native vegetation and biodiversity). |
Source: Adapted from European Environment Agency, 2003.
Collectively, indicators developed under the DPSIR model demonstrate how people’s activities and environmental effects are interconnected, and the effectiveness of policy and management responses to environmental problems.
DPSIR indicators aim to address four fundamental questions:
- What is happening to the environment?
- Why are changes happening to the environment?
- Are these changes to the environment significant?
- What is society’s response to these changes to the environment?
Typology of indicators
Indicators can also be classified by type using the European Environment Agency’s typology (European Environment Agency, 2003). This typology distinguishes four types of indicator, each of which addresses a different question and provides different information.
Descriptive indicators: What is happening in the environment and to people?
Descriptive indicators describe key environmental issues and their impact on people, and show changes over time.
Performance indicators: Is a policy or management approach making a difference?
Performance indicators compare actual conditions against a set of reference conditions (for example, progress towards targets, goals, or environmental objectives).
Efficiency indicators: Are we improving?
Efficiency indicators relate environmental pressures to people’s activities, and to the efficiency of products and processes. Activities are measured in terms of the resources they use and the emissions and waste they generate.
Total welfare indicators: Are we better off?
Total welfare indicators are one measure of social, economic, and environmental well-being. In this way, they are indicators of sustainability.
Core indicators by DPSIR model and EEA type
The DPSIR model and EEA typology can be used to describe the core national environmental indicators in more detail (see Table 1.3).
Categorising the core indicators in this way makes explicit their value and limitations for decision-making. Policy-makers and natural resource managers can make best use of information that illustrates the most relevant aspects of complex environmental issues.
Table 1.3: Classification of national environmental indicators by DPSIR model and EEA type
| National environmental indicator | Position in DPSIR model | EEA type |
|---|---|---|
|
Household consumption |
Driving force |
Descriptive. |
|
Vehicle kilometres travelled (VKT) by road |
Driving force |
Descriptive. |
|
Energy supply and consumption |
Driving force |
Descriptive.
Efficiency, when compared with gross domestic product or in a ratio such as total consumer energy / total primary energy supply. |
|
Solid waste disposed of to landfill |
Pressure |
Descriptive.
Efficiency, when compared with total waste generation.
Performance, when compared with New Zealand Waste Strategy targets. |
|
Air quality in managed airsheds |
State |
Performance. |
|
Emissions and removals of greenhouse gases |
Pressure |
Performance. |
|
Stratospheric ozone levels |
State |
Descriptive. |
|
Land cover |
State |
Descriptive. |
|
Land use |
Pressure |
Descriptive. |
|
Soil health |
State |
Efficiency. |
|
Soil intactness of erosion-prone hill country |
State |
Efficiency. |
|
Water quality in rivers, lakes, and groundwater aquifers |
State |
Descriptive.
Performance, when compared with national guideline or Australian and New Zealand Environment Conservation Council trigger values. |
|
Freshwater demand |
Pressure |
Efficiency. |
|
Fish stocks under the quota management system |
Driving force, pressure, and response |
Efficiency.
Performance. |
|
Seabed trawling in deep waters |
Driving force and pressure |
Descriptive. |
|
Water quality at coastal swimming spots |
State |
Performance. |
|
Marine areas with legal protection |
Response |
Descriptive.
Performance. |
|
Land area with native vegetation, including area under legal protection |
State and response |
Descriptive.
Performance, when compared with the New Zealand Biodiversity Strategy goals. |
|
Distribution of selected native plants and animals |
State |
Descriptive. |
Source: Ministry for the Environment.
New Zealand’s geography is highly variable, and its environment can change greatly over relatively short distances. However, geographically remote areas can have similar environmental characteristics (that is, similar climate conditions, landforms, and soils) that support particular ecosystems (habitats and species). These areas are said to be ecologically similar.
As an example, swampy areas on poorly drained recent soils in river valleys occur in many places between Gisborne and mid-Canterbury, although these places are geographically separate. Another example is the similarity of kiwi habitats, found in some parts of the North Island, South Island, and Stewart Island, even though these habitats are not geographically connected.
Once we have identified and mapped areas that have a similar ecological character, we can compare environmental data from these areas. This helps build a greater understanding of the state of New Zealand’s environment (Snelder et al, 2000), and helps decision-makers make appropriate environmental management decisions.
Environmental data from one area can also be used to extrapolate what might be happening in an area with similar ecological character, for which environmental data is not available. In this way, data from a limited number of monitored sites can be used to build a national picture of the state of the environment.
To identify, map, and extrapolate data in the ways described above, we use ecological classification systems. These systems compile information to identify and then map similar environments, biological regions, or land covers.
The five ecological classifications used in New Zealand for national state of the environment reporting are:
- Land Cover Database series 1 and 2
- River Environment Classification
- Coastal and Marine Habitat and Ecosystem Classification System, comprising:
- Coastal Biogeographic Regions Classification
- Marine Environment Classification (which is not used in this report, but will be used for ongoing national environmental reporting)
- Demersal Fish Community Classification
- Land Environments of New Zealand.
A brief explanation of each classification follows. Technical information about the classifications can be found in Environment New Zealand 2007 – A Technical Guide to New Zealand’s Environmental Indicators (Ministry for the Environment, forthcoming).
Land Cover Database
The Land Cover Database series 1 and 2 is a geographically spatial (satellite) map of New Zealand’s land cover. Land cover describes the types of features present on the surface of the earth (for example, pastures, lakes, forests, or concrete).
Both database series are made up of 43 classes of land cover. This report uses these classes to monitor and report on the national environmental indicators for land cover, land use, soil intactness on erosion-prone hill country, and areas of land under legal protection.
The Land Cover Database series 2 is shown in Figures 1.2 and 1.3, with its 43 classes grouped into nine major land cover classes.
Figure 1.2: Land Cover Database series 2, North Island, 2002
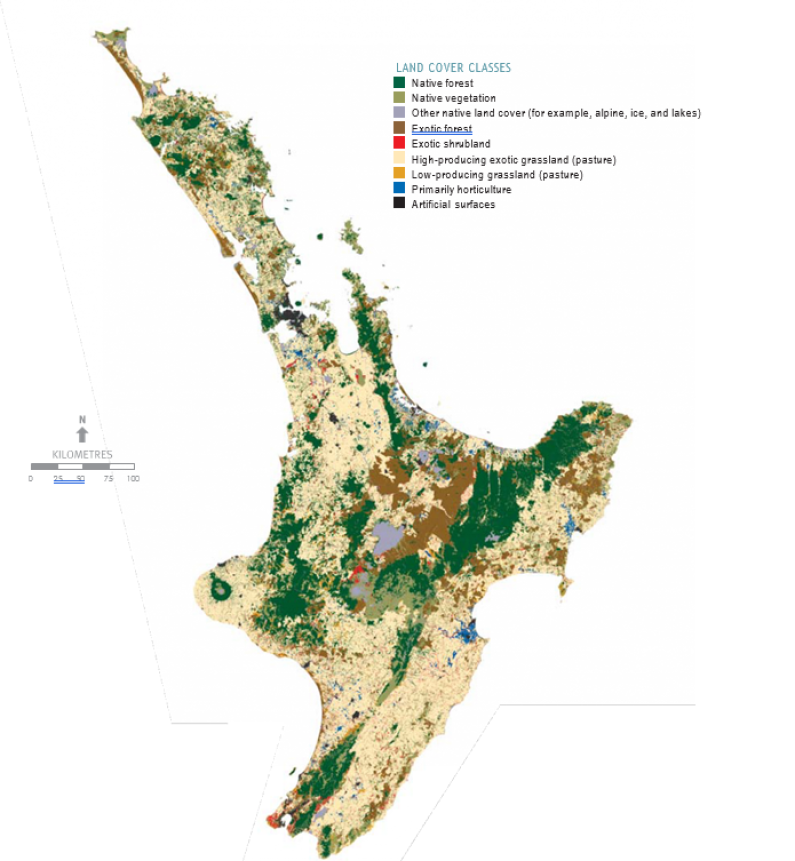
Image: Source — Ministry for the Environment, 2004.

Image: Source — Ministry for the Environment, 2004.
Figure 1.3: Land Cover Database series 2, South Island, 2002

Image: Source — Ministry for the Environment, 2004.
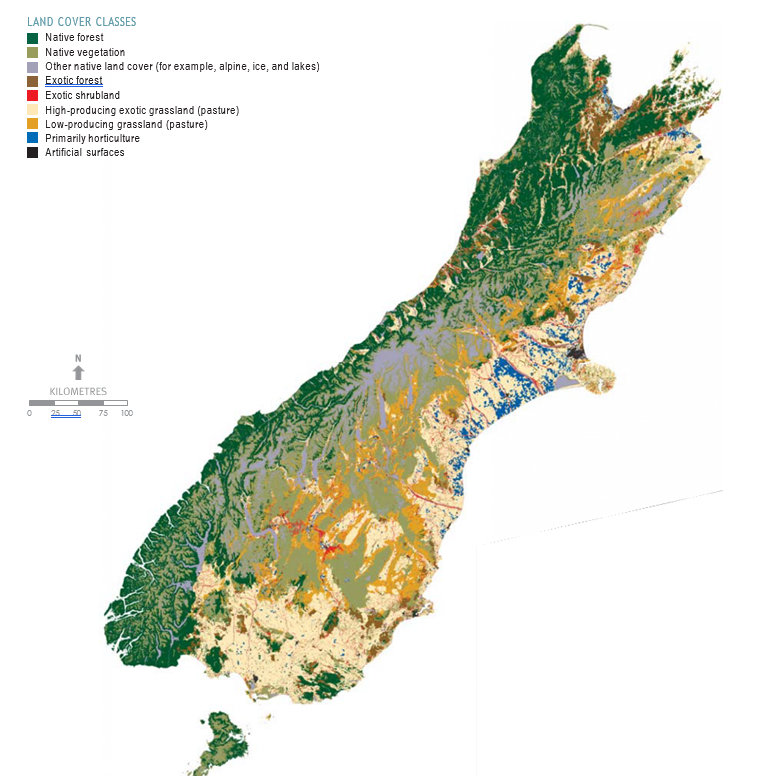
Image: Source — Ministry for the Environment, 2004.
River Environment Classification
The River Environment Classification maps rivers that have a similar character across New Zealand’s landscape. Individual river sections are mapped according to physical factors such as climate, topography, and geology, and land cover conditions. Sections of river that have similar ecological characteristics can then be grouped together, no matter where they are (Snelder et al, 2004).
Figure 1.4 shows an image of the lower North Island. The coloured ribbons show the river network in these areas. The River Environment Classification identifies rivers according to their climate and source of flow. For example, the red rivers have a cool, wet climate and low elevation source, while the yellow rivers have a cool, wet climate and hilly source. ‘Other rivers’ includes several categories of climate and source of flow that have been combined for the purposes of this figure.
Different types of river respond differently to the pressures placed on them; the River Environment Classification can be used to highlight the most appropriate management tools and approaches to reduce these pressures for each river type. Information from the classification is used to develop policy, assess the environment, and report on the quality of river water.
Figure 1.5 shows the River Environment Classification for the river network in the Canterbury region. The rivers are divided into nine groups, according to the type of landscape they spring from (for example, a glacial mountain) and their underlying geology (for example, soft sedimentary rock). The key shows a colour code for each different river type.
Figure 1.4: Satellite image of lower North Island with rivers and streams overlaid using the River Environment Classification
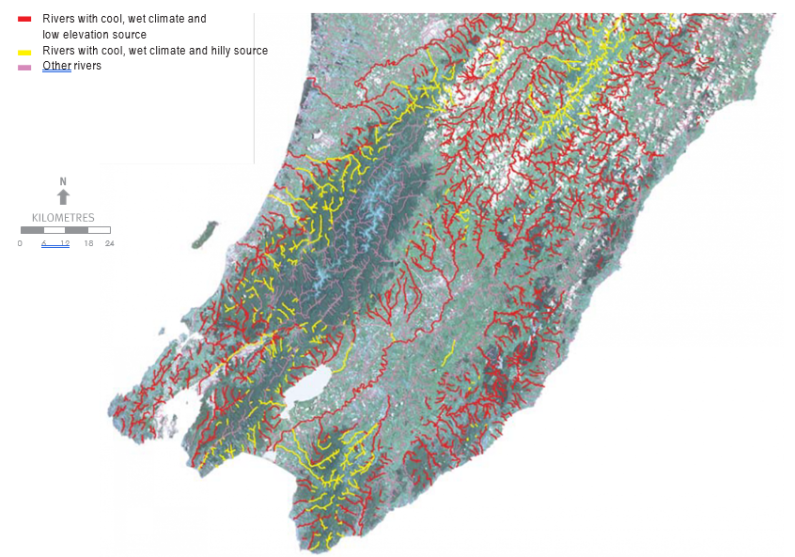
Image: Source — Ministry for the Environment.

Image: Source — Ministry for the Environment.
Figure 1.5: River Environment Classification of rivers and streams in the Canterbury region

Image: Source — Snelder et al, 2001.
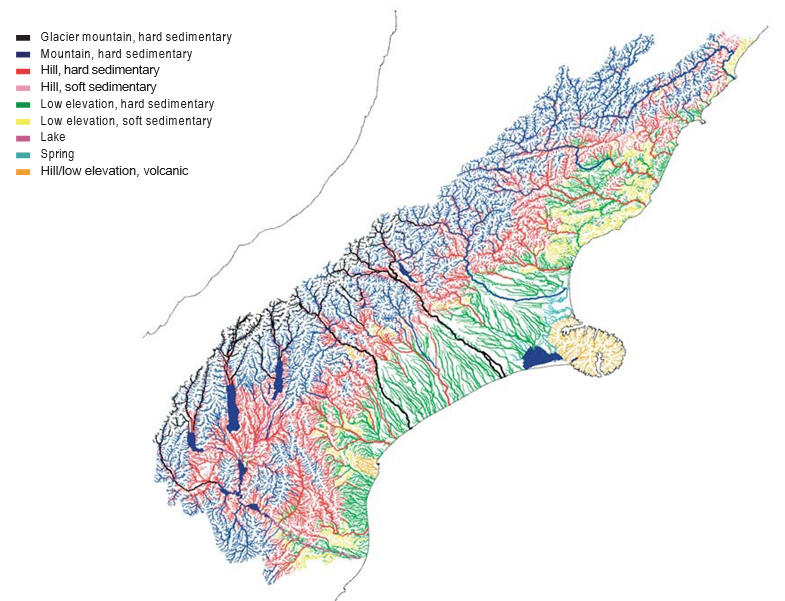
Image: Source — Snelder et al, 2001.
Coastal and Marine Habitat and Ecosystem Classification System
New Zealand’s marine environment is characterised by sandy and rocky beaches, exposed cliffs, bays, and estuaries of varying sizes; and a variety of coastal and deep-sea habitats and ecosystems. Beneath the surface are diverse seascapes and plant and animal life.
Two ecological classifications for New Zealand’s marine environment have been developed and are used together for state of the environment reporting. The Coastal Biogeographic Regions Classification is used as a framework to provide information on the coastal marine environment (that is, waters less than 200 metres deep), and the Marine Environment Classification is used as a framework for deep-water environments (waters 200 metres or more deep) (Department of Conservation and Ministry of Fisheries, 2007; also see Figures 1.6 and 1.7).
Coastal Biogeographic Regions Classification
A biogeographic region is an area defined and classified according to visible ecological patterns and the physical characteristics of a geographic or hydrographic area. New Zealand is divided into 13 coastal biogeographic regions.
The Coastal Biogeographic Regions Classification (see Figure 1.6) can be used for assessing the health of the coastal marine environment, planning associated with marine protected areas, and reporting on the extent of marine reserves by ecosystem type within the territorial sea.
Figure 1.6: Coastal biogeographic regions to 12 nautical miles within New Zealand’s Exclusive Economic Zone

Image: Source — Department of Conservation and Ministry of Fisheries.
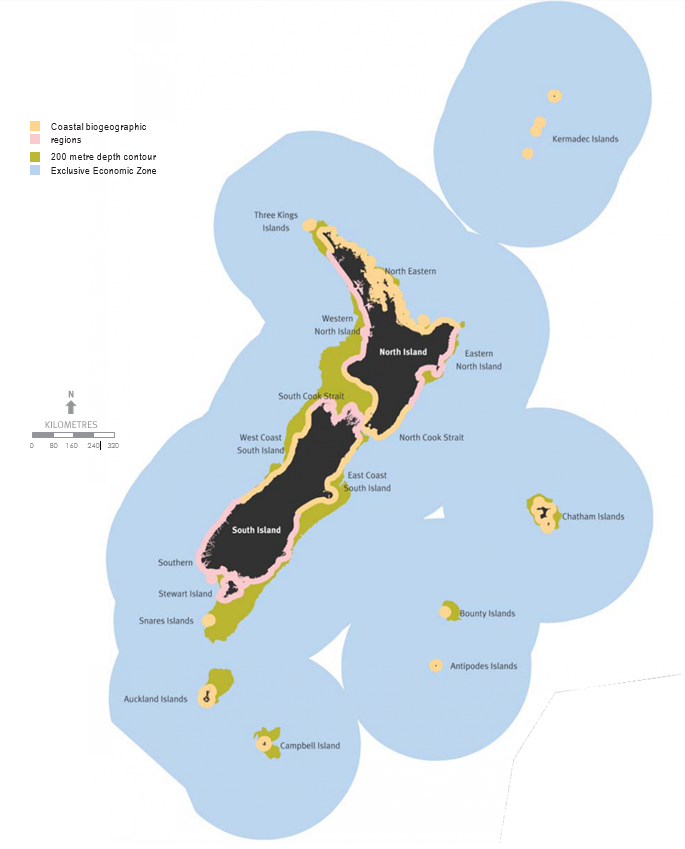
Image: Source — Department of Conservation and Ministry of Fisheries.
Marine Environment Classification
The 2005 Marine Environment Classification uses eight physical factors (for example, depth, sea-surface temperature, seabed slope, tidal current, and annual solar radiation) to classify and map marine areas that have a similar environmental character. The marine environments can be mapped to different levels of detail, ranging from two to more than 70 marine environment groups (Ministry for the Environment, 2005).
The Marine Environment Classification can be used at different levels for state of the environment reporting on deep-water environments to 200 nautical miles offshore (that is, the full extent of New Zealand’s Exclusive Economic Zone). Figure 1.7 shows the Marine Environment Classification at the 20-group level.
Demersal Fish Community Classification
The Demersal Fish Community Classification uses an extensive set of research data about trawling to model the distribution of 122 demersal fish species (species that live near the sea floor). This includes blue cod, hake, hoki, John dory, orange roughy, snapper, and tarakihi (Leathwick et al, 2006).
This research data was used to estimate the abundance of fish in each species across New Zealand’s entire Exclusive Economic Zone, including at sites for which trawl data was not available. These estimations enabled areas with a similar composition of species to be classified together.
The Demersal Fish Community Classification shows the geographic distribution of particular demersal fish communities, and describes their composition (the types of fish that live in the area) and the environmental conditions in which the fish occur. See chapter 11, ‘Oceans’ for an example of how the classification has been used.
Land Environments of New Zealand
The Land Environments of New Zealand classification maps areas of the New Zealand landscape that have a similar environmental character. It is used to identify areas that are similar, regardless of where they occur (that is, which areas are not necessarily the same in all respects, but are likely to contain similar species, and have similar biological interactions and processes) (Ministry for the Environment and Landcare Research 2002).
This classification differs from the Land Cover Database series 1 and 2 discussed earlier in this chapter. These simply identify land cover (what is growing on the ground or what feature covers the ground), whereas Land Environments of New Zealand uses 15 climate, landform, and soil factors that are considered likely to influence the distribution of animal or plant species. Based on these factors, land environments can be used as a surrogate for ecosystems.
Land Environments of New Zealand can be used at four levels of detail to map 20, 100, 200, or 500 land environments (see Figure 1.8). The higher levels provide greater detail by showing more land environments.
This classification is used to report on native biodiversity indicators. (See also Figure 12.2 in chapter 12, ‘Biodiversity’, which illustrates the mapping of 20 environments.)
Figure 1.7: Marine Environment Classification (MEC) at the 20-group level, 2005

Image: Source — Ministry of Fisheries.
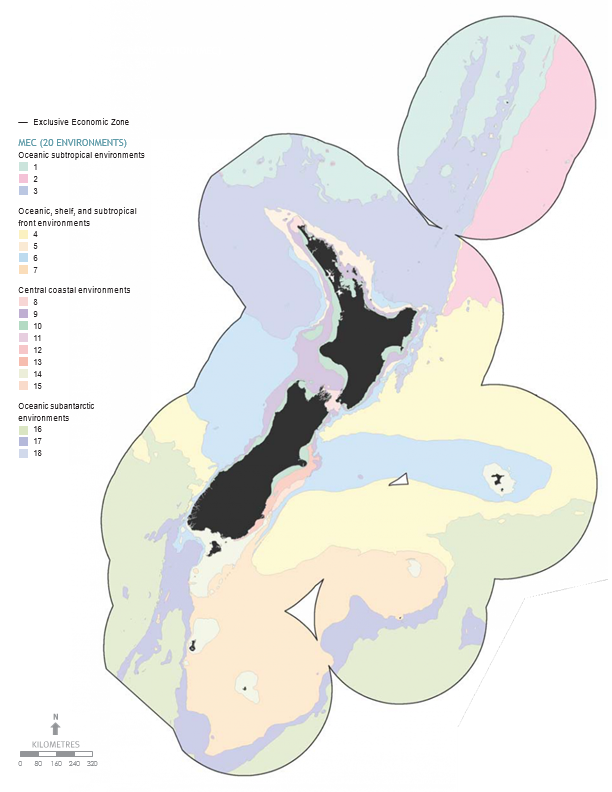
Image: Source — Ministry of Fisheries.
Figure 1.8: Land Environments of New Zealand, Levels 1 to 4, showing mapping scales for 20 to 500 land environments
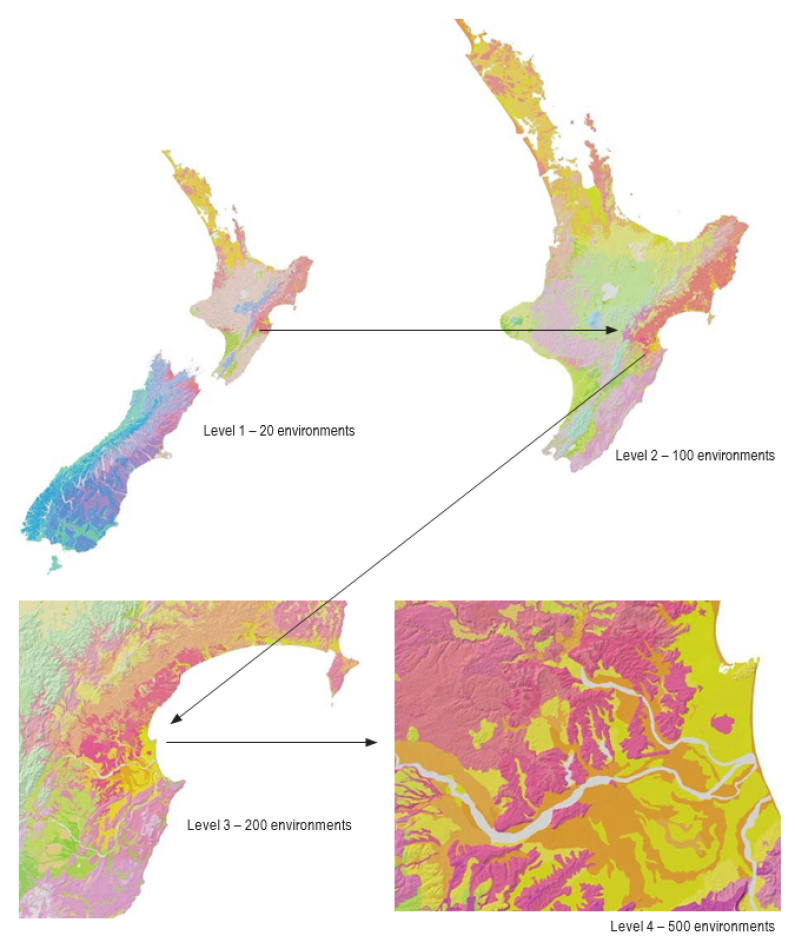
Image: Source — Ministry for the Environment and Landcare Research, 2003.

Image: Source — Ministry for the Environment and Landcare Research, 2003.
For practical and cost reasons, we cannot measure all aspects of the environment. However, an indicator set needs to be more than a loose assortment of unconnected indicators if it is to provide an informative national picture of the state of the environment.
In selecting the core national environmental indicators and how they would be monitored, the Ministry for the Environment considered:
- standard international criteria for indicator selection – for example, whether the indicator was:
- relevant to policy
- measurable at a reasonable cost
- analytically valid and scientifically defensible
- environmentally informative
- cost-effective
- easily understood
- what data and information are available for national-level reporting in New Zealand
- the information needs of New Zealand environmental managers and policy-makers.
As noted earlier, the primary objective of this report is to use the set of core national environmental indicators to present a national picture of environmental conditions in New Zealand. This national picture will highlight for decision-makers and environmental managers the aspects of our environment that have come under particular pressure and require priority attention.
Many of the findings in this report will not surprise decision-makers. Anecdotally, we already know many of the pressures on the New Zealand environment and the particular aspects of the environment that are most at risk.
However, by reporting against the indicators, we have been able to present quantitative data at the national level, in some cases for the first time, to support this anecdotal knowledge.
Department of Conservation and Ministry of Fisheries. 2007. Marine protected areas draft classification and protection standard, public consultation document released June 2007. Wellington: Department of Conservation and Ministry of Fisheries.
Department of the Environment and Heritage. 2006. SoE in an international context, paper prepared for the 2006 Australian State of the Environment Committee. Retrieved from http://www.deh.gov.au/soe/2006/emerging/soe-international/index.html (19 May 2007).
European Environment Agency. 1999. A Checklist for State of the Environment Reporting. Retrieved from http://reports.eea.europa.eu/TEC15/en/tech_15.pdf (22 June 2007).
European Environment Agency. 2003. Environmental Indicators: Typology and use in reporting, internal working paper. Copenhagen: European Environment Agency.
European Environment Agency. 2005. EEA Core Set of Indicators: Guide. Retrieved from http://reports.eea.europa.eu/technical_report_2005_1/en (4 June 2007).
Leathwick, J, Francis, M, and Julian, K. 2006. Development of a Demersal Fish Community Classification for New Zealand’s Exclusive Economic Zone, prepared for the Department of Conservation. Retrieved from http://biodiversity.govt.nz/pdfs/seas/DOC06213_fish_classification.pdf (13 June 2007).
Ministry for the Environment. 1997. The State of New Zealand’s Environment 1997. Wellington: Ministry for the Environment and GP Publications.
Ministry for the Environment. 2004. New Zealand Land Cover Database (LCDB2). Wellington: Ministry for the Environment.
Ministry for the Environment. 2005. The New Zealand Marine Environment Classification. Wellington: Ministry for the Environment.
Ministry for the Environment. 2006. Lessons learnt from the Environmental Performance Indicator (EPI) Programme, unpublished. Wellington: Ministry for the Environment.
Ministry for the Environment. Forthcoming. Environment New Zealand 2007: A Technical Guide to New Zealand’s Environmental Indicators. Wellington: Ministry for the Environment.
Ministry for the Environment and Landcare Research. 2002. Land Environments of New Zealand: A technical guide. Auckland: David Bateman Ltd.
Ministry for the Environment and Landcare Research. 2003. Land Environments of New Zealand. Auckland: David Bateman Ltd.
Smeets, E, and Weterings, R. 1999. Environmental Indicators: Typology and overview. Retrieved from http://reports.eea.europa.eu/TEC25/en/tech_25_text.pdf (1 June 2007).
Snelder, T, Biggs, B, and Weatherhead, M. 2004. New Zealand River Environment Classification User Guide. Wellington: Ministry for the Environment and National Institute of Water and Atmospheric Research.
Snelder, T, Leathwick, J, Biggs, B, and Weatherhead, M. 2000. Ecosystem Classification: A discussion of various approaches and their application to environmental management. Prepared for the Ministry for the Environment. Wellington: National Institute of Water and Atmospheric Research.
Snelder, T, Mason, C, Woods, R, and Robb, C. 2001. Application of the River Ecosystem Management Framework to water allocation management. Prepared for the Ministry for the Environment. Wellington: Ministry for the Environment.
Chapter 1: Environmental reporting
December 2007
© Ministry for the Environment