Theme 3: Pollution from our activities

Our environment is polluted when substances or kinds of energy (noise, light, heat) enter it and cause harm.

Image: Ministry for the Environment
Some pollutants directly affect our health. Pathogens (disease-causing microorganisms like the bacteria Campylobacter) in drinking water can cause illness, and very fine particles in the air can cause lung and heart problems. Other pollutants pose threats to the health of plants, animals, and ecosystems, like plastic waste in the ocean or excess nutrients in our waterways.
Pollution also affects our connections to nature. Artificial light from towns and cities reduces our view of the night sky, and murky streams spoil our enjoyment of these environments.
Most pollution comes from human activities, such as industry, agriculture, power generation, home heating, and transport, but some comes from natural events like volcanic eruptions. Often pollution has a mix of sources. Waterways, for example, can contain disease-causing bacteria from human or animal faeces, nutrients from farm run-off and urban areas, and heavy metals from vehicle wear (copper from brake pads and zinc from tyres).
This theme focuses on two kinds of pollution – pollution of waterways from farming and pollution in urban areas.
Waterways in farming areas are polluted by excess nutrients, pathogens, and sediment. This threatens our freshwater ecosystems and cultural values, and may make our water unsafe for drinking and recreation.
In farming areas, water pollution affects almost all rivers and many aquifers. Some lakes and estuaries may also be affected. Compared to catchments dominated by native vegetation, waterways in areas of pastoral farming have markedly higher levels of pollution by excess nutrients (like nitrogen), sediment, and pathogens.
Recent measurements show that water quality has been improving at some places, but worsening at others. It can be difficult to understand exactly what is causing the changes in water quality because water catchments can contain a mix of different types of farms and land uses, and the effects of natural variations in climate and the connections between rivers and groundwater are also poorly understood.
In less than 1,000 years New Zealand has changed from an unpopulated group of islands covered with dense forest, to an intensely farmed country. Setting up our farms involved clearing native vegetation and draining wetlands, which have dramatically affected how our soils and water function.
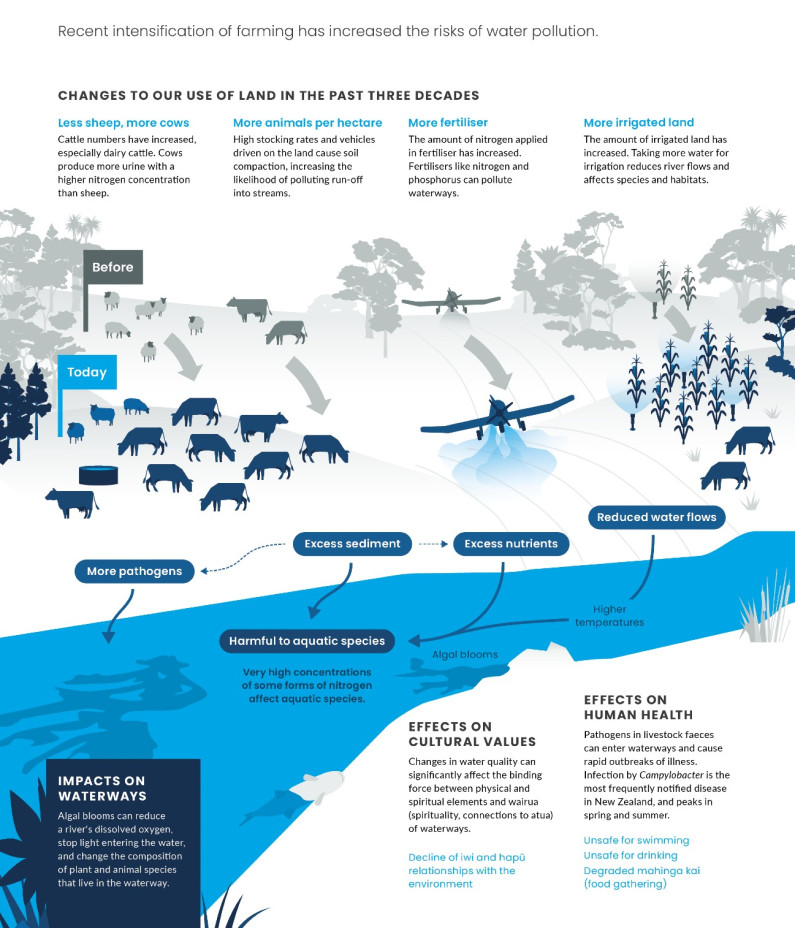
More recently there has been a significant shift from sheep and beef farming into dairy farming, most notably in Canterbury, Otago, and Southland. The national dairy herd increased by 70 percent between 1994 and 2017, while numbers of sheep and beef cattle declined. This shift is important because cattle excrete more nitrogen per animal than sheep (cows produce more urine and the urine has a higher nitrogen concentration).
We are also using our farmland more intensively now than a few decades ago. The number of cattle per hectare has increased in some parts of the country, a change that can make it more likely that pollutants will leach into waterways. The amount of nitrogen applied in fertiliser has also increased more than six-fold across the country since 1990.
Our ecosystems can be seriously impacted by water pollution. For 2013–17, 71 percent of river length in pastoral farming areas had modelled nitrogen levels that could affect the growth of sensitive aquatic species. Higher nutrient levels may also cause excess algal growth (or blooms), which degrades the ecosystems and can make waterways and coastal environments unfit for recreational and cultural uses.
Water pollution by pathogens from livestock dung also has risks to human health, including gastrointestinal illness. Computer models estimate that 82 percent of the river length in pastoral farming areas was not suitable for activities such as swimming, based on the predicted average Campylobacter infection risk during the period 2013–17.
Water pollution degrades cultural values such as mauri and wairua of waterways, and impacts the customary practices associated with mahinga kai and kaitiakitanga (guardianship). When waterways are polluted it can also affect the mana (prestige) associated with an iwi or hapū.


Read the long description for Intensified farming
Recent intensification of farming has increased the risks of water pollution
Changes to our use of land in the past three decades
Harmful to aquatic species
Impact on waterways
Effects on cultural values
Effects on human health
Some of our cities and towns have polluted air, land, and water. This comes from home heating, vehicle use, industry, and disposal of waste, wastewater, and stormwater. Pollution affects ecosystems, health, and use of nature.
Many different pollutants are produced in urban centres where most (86 percent) New Zealanders live (see Issue 3). The pollutants vary in type and amount, from place to place, and over time.
Our air quality is good in most places and at most times of the year. However, levels of tiny particles in the air that are bad for our health can exceed air quality standards, especially in cooler months because of emissions from home heating.
Urban waterways contain many of the same pollutants found in farming areas – excess nutrients (such as nitrogen), sediment, and pathogens – but their levels are typically even higher in our cities and towns. Urban waterways can also contain other pollutants, like heavy metals.
Recent measurements show that urban pollution has lessened in many places. Air particulate matter (PM10) levels decreased in 17 of 39 monitored areas in winter between 2007 and 2016. Where changes in water quality could be detected between 2008 and 2017, the majority of urban river water monitoring sites had improving trends for nutrients and sediment. The trends for E. coli were mixed, with some sites getting better and some getting worse.
Less information is available about other types of urban pollution. Monitoring networks do not yet cover all our cities and towns. Data is not available to assess trends in light pollution, noise pollution, odours, or pollution in urban soil, land, or coastal waters.
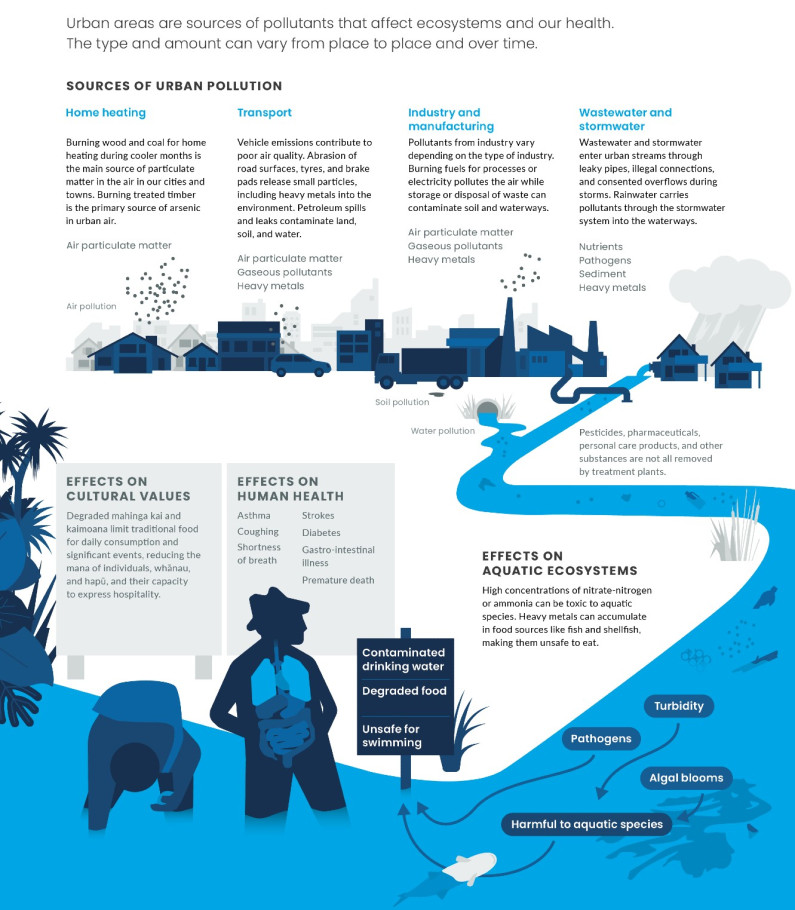
In urban areas, burning wood and coal for home heating in winter are the main sources of particulate matter in the air. Emissions from vehicles and industry also contribute to air pollution in some places. This includes particulate matter and carbon dioxide from cars, and nitrogen oxides and other gases from industries.
Pollutants enter urban waterways through the stormwater and wastewater networks. Stormwater is rainwater plus any pollutants it picks up on the land surface, like nutrients, pathogens, sediment, or heavy metals from the wear of road surfaces, tyres, and brake pads. Wastewater is the water that has been used in houses and businesses, which can contain nutrients, pathogens, and many chemicals used in industrial and domestic activities.
Air pollution can have health impacts including shortness of breath, asthma, heart attack, stroke, and even premature death.
Water pollution can affect both human and ecosystem health. Computer models estimate that 94 percent of the river length in urban areas is not suitable for activities such as swimming, based on the predicted average Campylobacter infection risk between 2013 and 2017.
The models also show that 94 percent of river length in urban areas has nitrogen levels that may affect the growth of sensitive aquatic species. The elevated levels of nutrients in urban streams also increase the likelihood of excessive algal growth.
Pollution in urban areas impacts the mauri of ecosystems and affects values like the condition of mahinga kai and kaimoana (traditional foods), recreation (swimming, waka ama), and oranga (health and well-being) of Māori.
Limited knowledge of the full range of pollutants, their extent, and their cumulative effects, makes it challenging to fully understand the impacts of urban pollution.


Read the long description for Urban pollution
Urban areas are sources of pollutants that affect ecosystems and our health. The type and amount can vary from place to place and over time.
Sources of urban pollution
Pesticides, pharmaceuticals, personal care products, and other substances are not all removed by treatment plants.
Effects on cultural values
Effects on human health
Effects on aquatic ecosystems

Theme 3: Pollution from our activities
April 2019
© Ministry for the Environment