This study presents New Zealand data collected to refine estimates for polychlorinated dibenzo-p-dioxin (PCDD) and polychlorinated dibenzofuran (PCDF) emissions to air from secondary metallurgical processes. These data include the results of a comprehensive survey undertaken to characterise the size and nature of the secondary metallurgical industry, and the results of emission measurements from a range of different processing sites throughout the country.
Industry survey
The survey determined there were 82 sites falling within the scope of the study, melting approximately 91,000 tonnes of metal per year. This tonnage is greater than that estimated in 1998, where approximately 70,000 tonnes were attributed to the same process categories (Ministry for the Environment, 2000). The difference is largely accounted for by the contribution from medium- and small-scale ferrous foundries, which were mostly ignored in 1998, and offset slightly by one large site recently ceasing to process copper-based scrap (much of which may now go offshore).
Other key findings of the survey were:
- the majority of the metal is melted in large sites, which are responsible for 71% of the total production
- the most common furnaces in use are electric induction and oil- or gas-fired crucibles
- most large and medium sites have fabric filtration for air pollution control
- the processing of dirty or contaminated scrap is confined mostly to a few large sites
- two or three sites use a thermal scrap pre-treatment process (pyrolysis, combustion, or drying).
Emission measurements
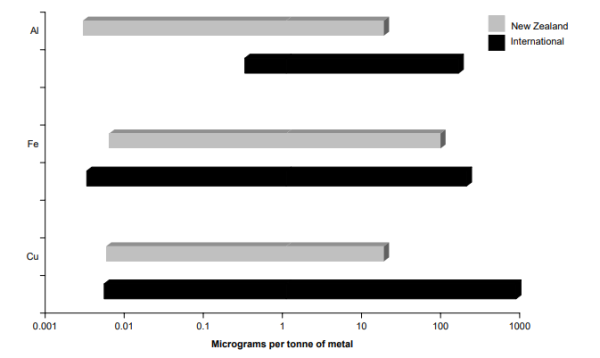
Emission testing was conducted at 12 sites covering a range of metals, furnace types and plant sizes. Twenty-four samples were collected and 30 PCDD and PCDF analyses undertaken, including some samples for which the gaseous and particulate phase were analysed separately. Even though there was considerable scatter in the measured emissions, all results fell within the range of comparable international data (see following figure).
Apart from two sites, emissions were well below the maximum emissions from overseas data when expressed as mass of PCDD and PCDF per tonne of metal melted. This indicates that, generally, emissions from the New Zealand secondary metallurgical industry are low.
New Zealand PCDD and PCDF emissions compared to international data
Sites that showed comparatively higher emissions were:
- large sites
- sites that processed dirty or contaminated scrap
- a site where the pollution control equipment was thought to have been malfunctioning.
There is no evidence, from the data collected, to show a disproportionate emission per tonne of metal melted from smaller (less-controlled) sites. The larger sites appear to contribute the majority of PCDD and PCDF emitted.
The contribution to New Zealand's PCDD and PCDF emissions
This study estimates that the secondary metallurgical industry emits a total of 0.017 to 3.1 g I-TEQ per year to air, which is similar to the 1998 New Zealand inventory estimate of 0.126 to 3.16 g I-TEQ per year. The new data confirms the 1998 inventory estimates, but also significantly improves confidence in the estimates.
The following table presents estimates for each part of the industry sector.
Annual PCDD and PCDF emissions from the secondary metallurgical industry, 2002
|
Metal production sector |
Basis of production estimate |
Annual production |
Measured emission factors |
Emission range |
|---|---|---|---|---|
|
Secondary steel |
One large plant in Auckland (as per 1998 inventory) |
170,000 |
0.098 - 0.37a |
0.017- 0.063 |
|
Ferrous foundries |
Estimated from this survey |
21,000 |
0.0058 - 89 |
0.00012 - 1.90 |
|
Non-ferrous metals (copper and other) |
Estimated from this survey |
23,200 |
0.0053 - 17 |
0.000012 - 0.394 |
|
Secondary aluminium |
Estimated from this survey |
47,000 |
0.0027 - 17 |
0.00013 - 0.799 |
|
Total |
- |
261,200 |
- |
0.017 - 3.10 |
a Data from 1998 dioxin inventory.
The total emission estimates include emissions from New Zealand's largest secondary steel production facility located in Auckland. This site was not part of the monitoring programme for the current study because its emissions have already been well characterised. However, its emissions estimate is provided in the above table for completeness, and to provide a national overall figure for the secondary metallurgical industry in New Zealand.
While the 2002 estimates span a larger range of values when compared to 1998, the reliability of the data has improved. In 1998 the estimates for the secondary ferrous industry were rated as high, while production estimates and emission factors for the secondary aluminium industry were rated as having a medium and lowcertainty respectively. Both the production and emission factors were rated as low for the non-ferrous industry. The new data allows the production estimates and emission factors for ferrous, aluminium and non-ferrous industries all to be given at least medium or high certainty ratings.
Conclusions
The overall findings of this study are:
- the range of measured emissions from the New Zealand secondary metallurgical industry is consistent with international data
- most sites have low emissions, with a small number of large sites contributing most of the total amount of PCDD and PCDF emitted nationally
- estimates of total emissions from the sector are similar to those for the 1998 dioxin inventory, but are considered more reliable.
See more on...
Executive Summary
April 2004
© Ministry for the Environment